Upgrade to Pro — share decks privately, control downloads, hide ads and more …

EuroPython 2019: Introduction to low-level profiling and tracing

EuroPython 2019: Introduction to low-level profiling and tracing

https://ep2019.europython.eu/talks/es2pZ6C-introduction-to-low-level-profiling-and-tracing/

Introduction to low-level profiling and tracing
User space, Kernel, and hardware profiling and tracing with ptrace, perf, SystemTap, and BCC

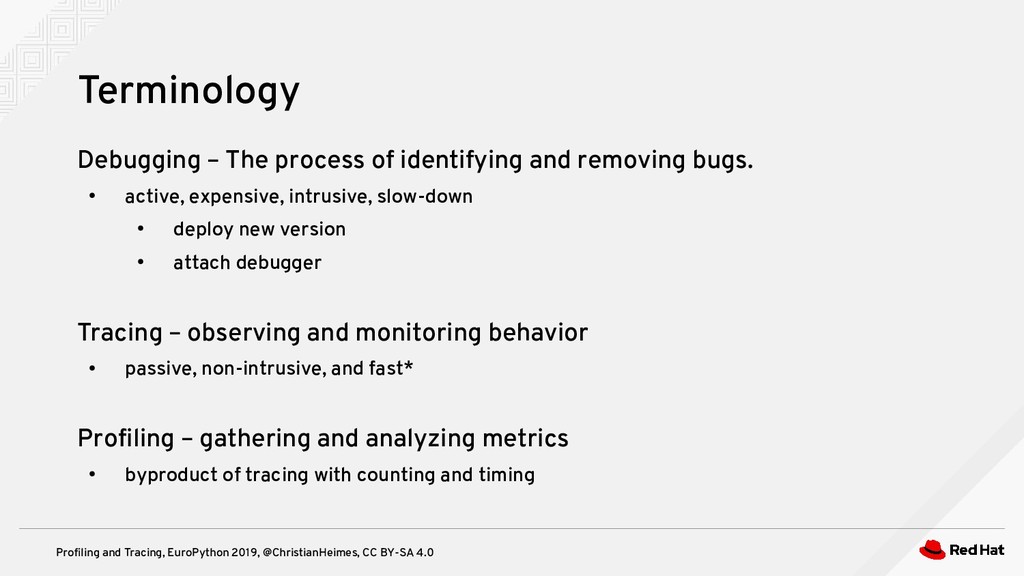
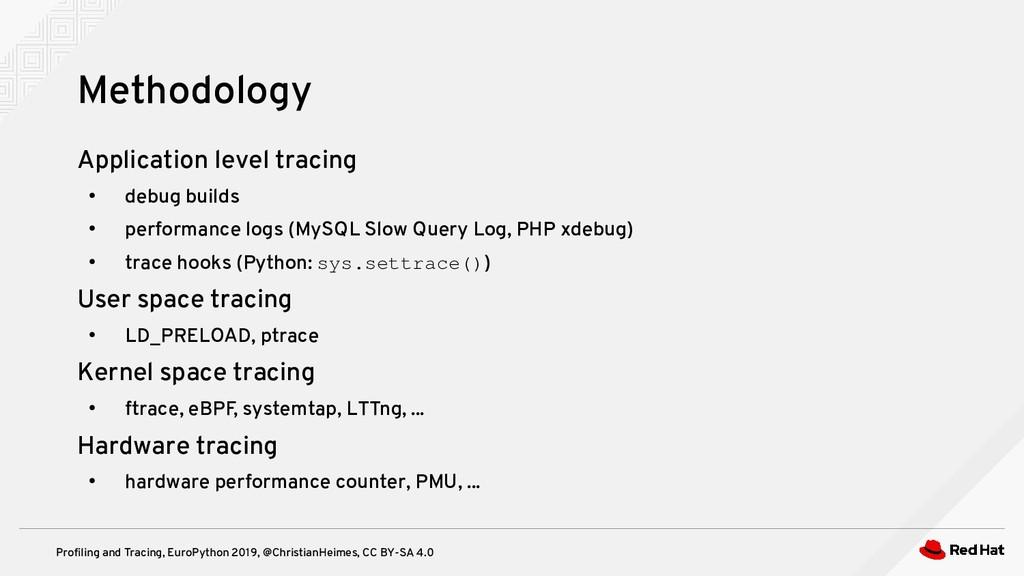
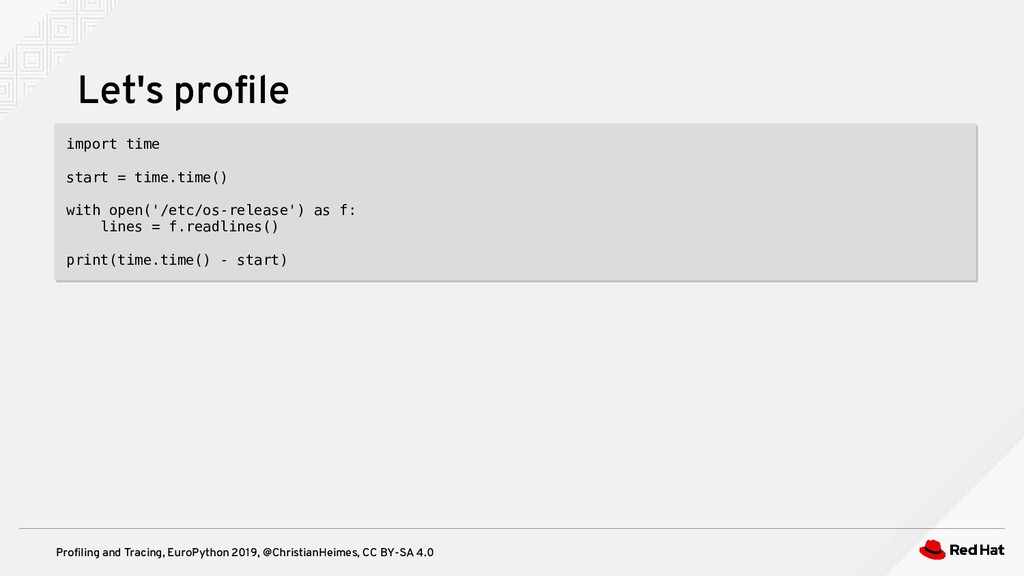
Python has built-in tracing and profiling facilities in form of callback hooks in the sys module. The settrace and setprofile callbacks have several drawbacks. They slow down the Python interpreter considerable and only allow tracing of Python code. Modern OS and CPUs come with a variety of APIs for efficient and low-level tracing down to system calls, Kernel space code, and hardware events. Some tools even create code that runs in Kernel space.

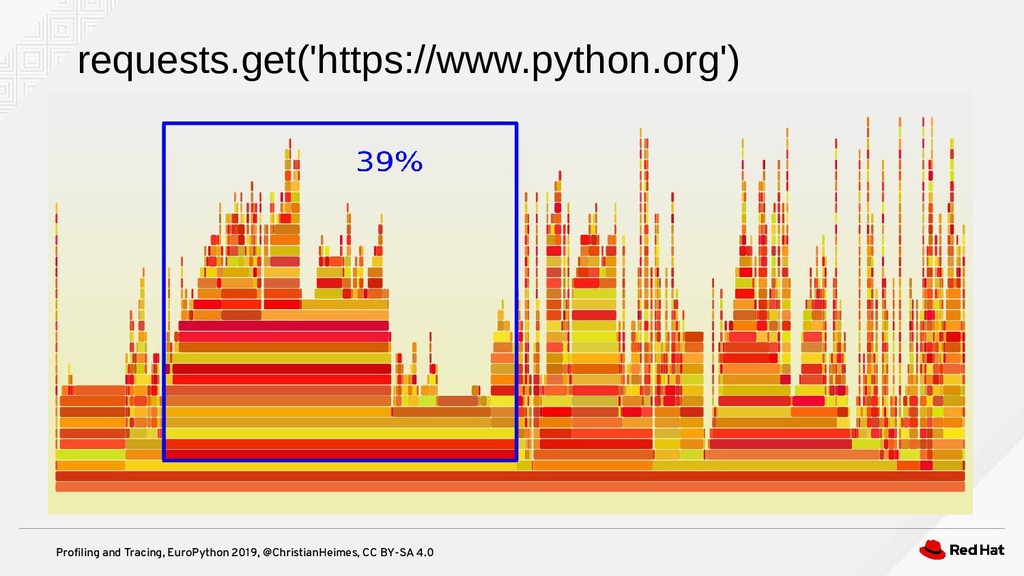
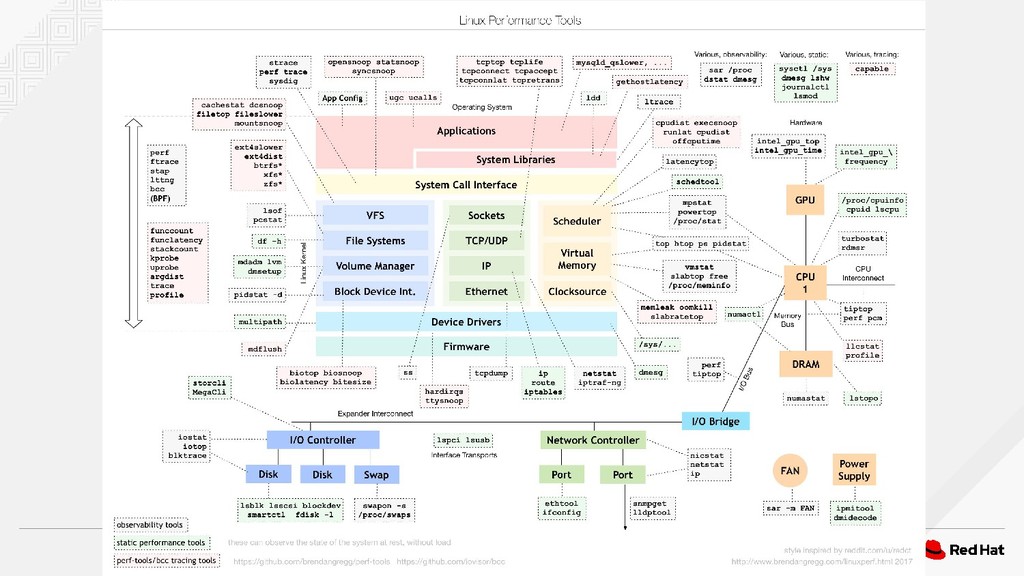
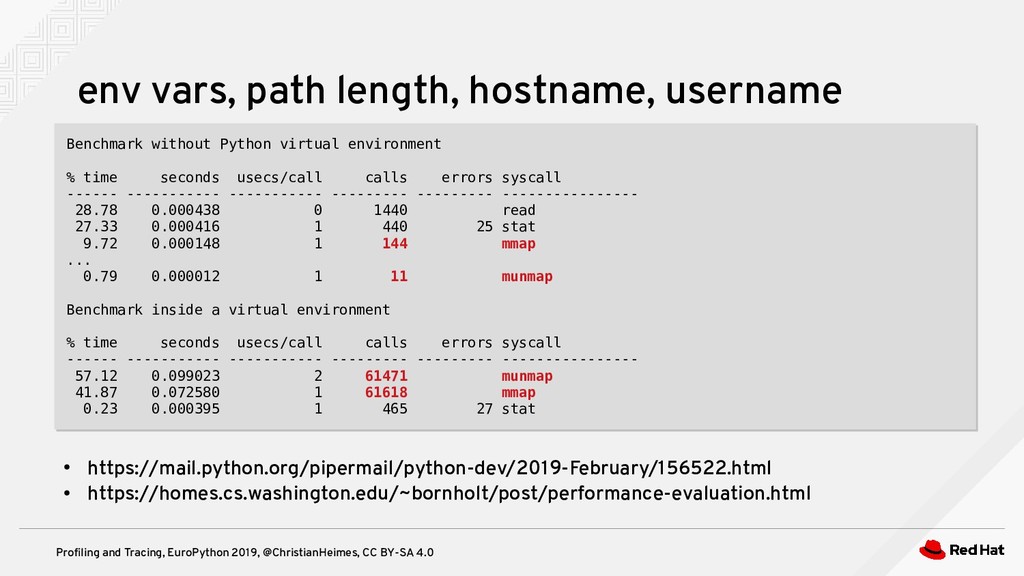
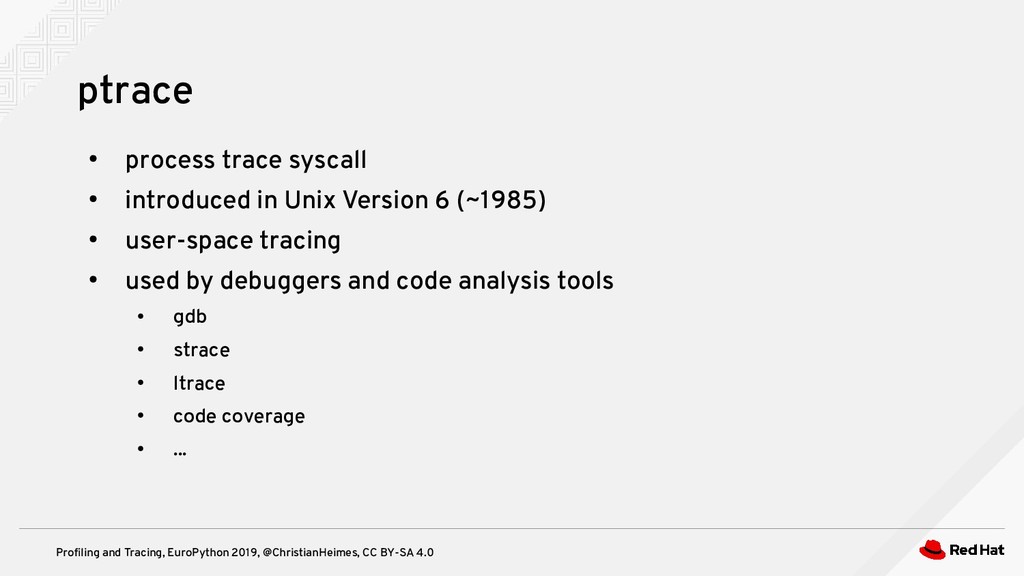
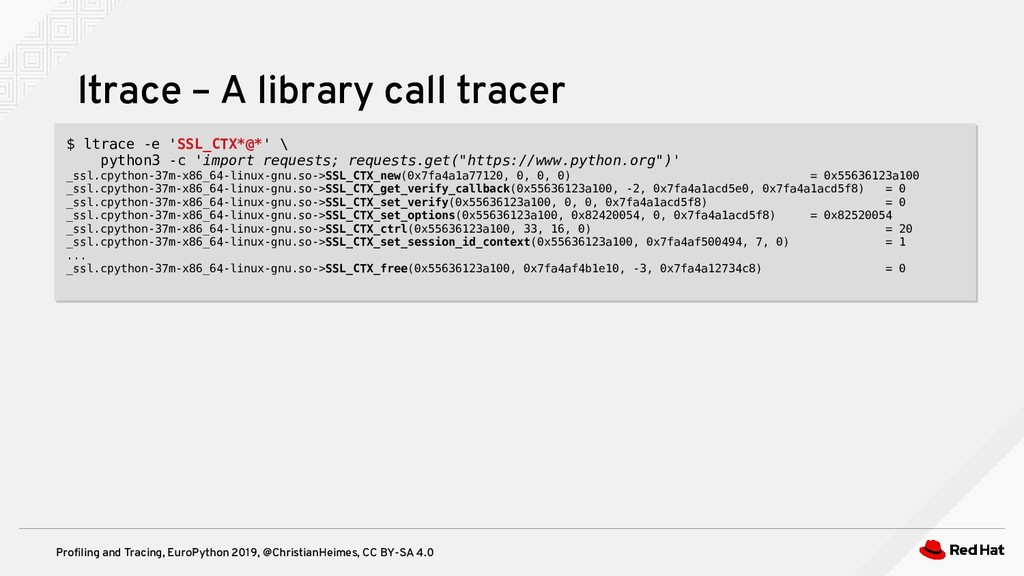
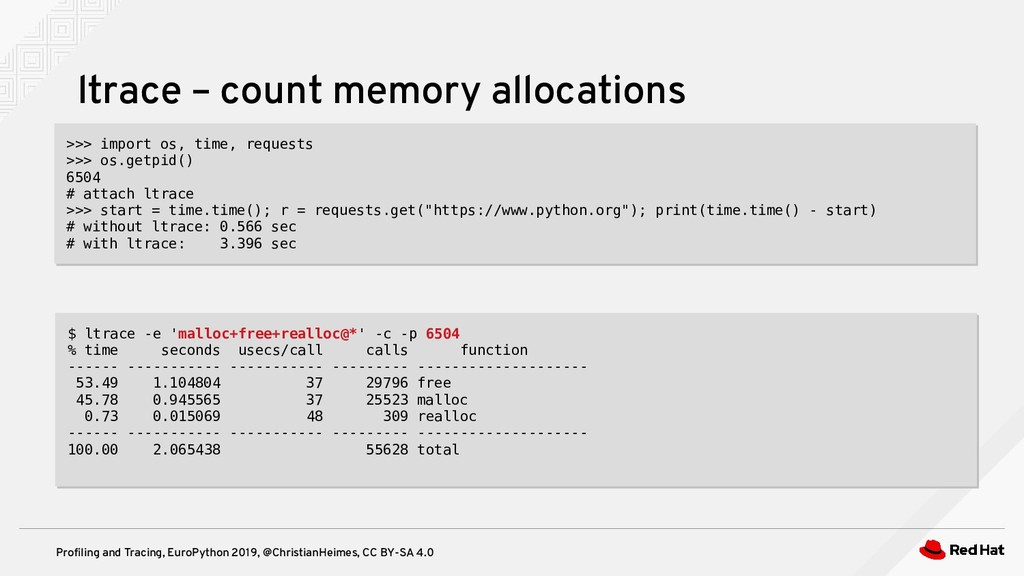
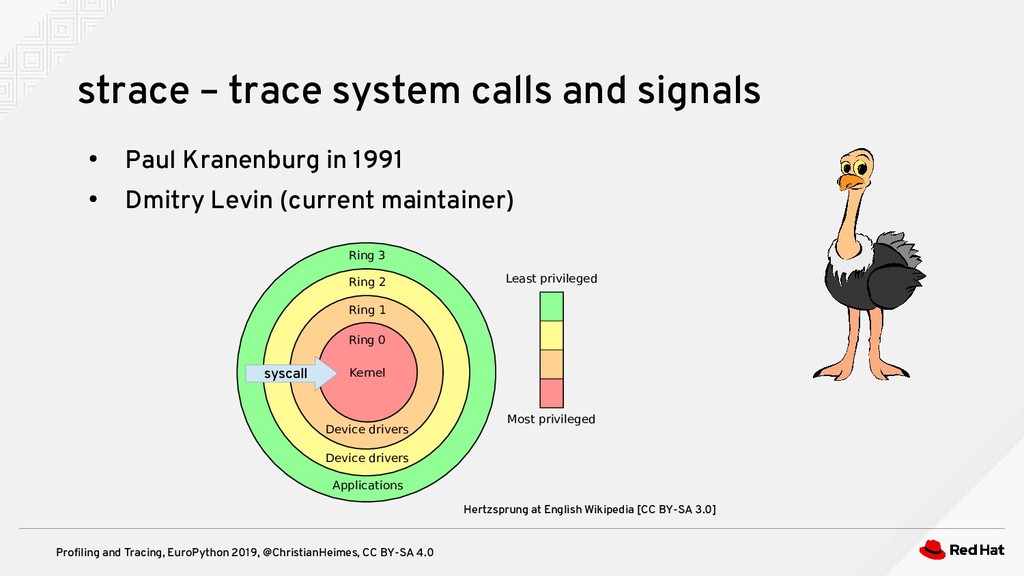
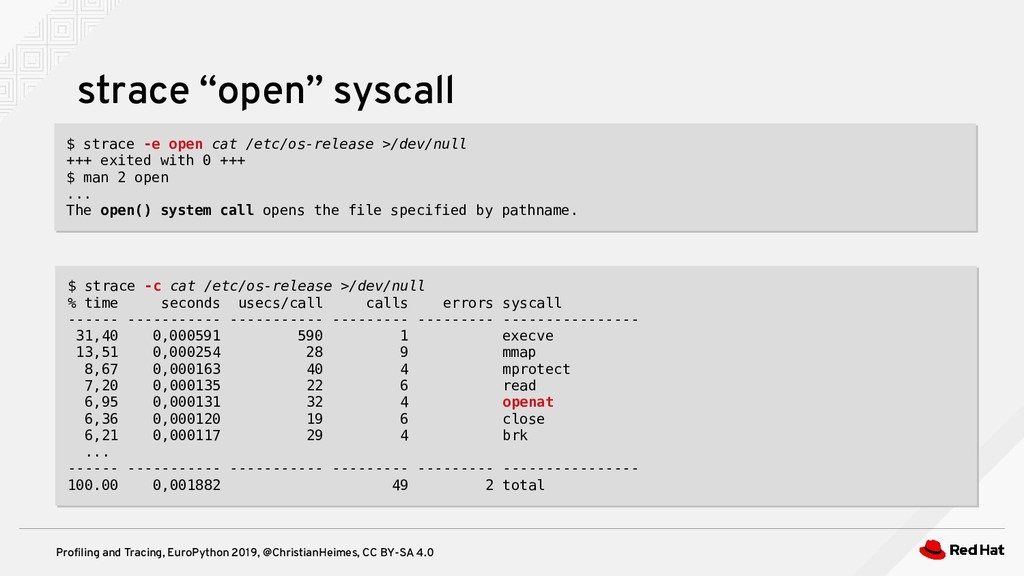
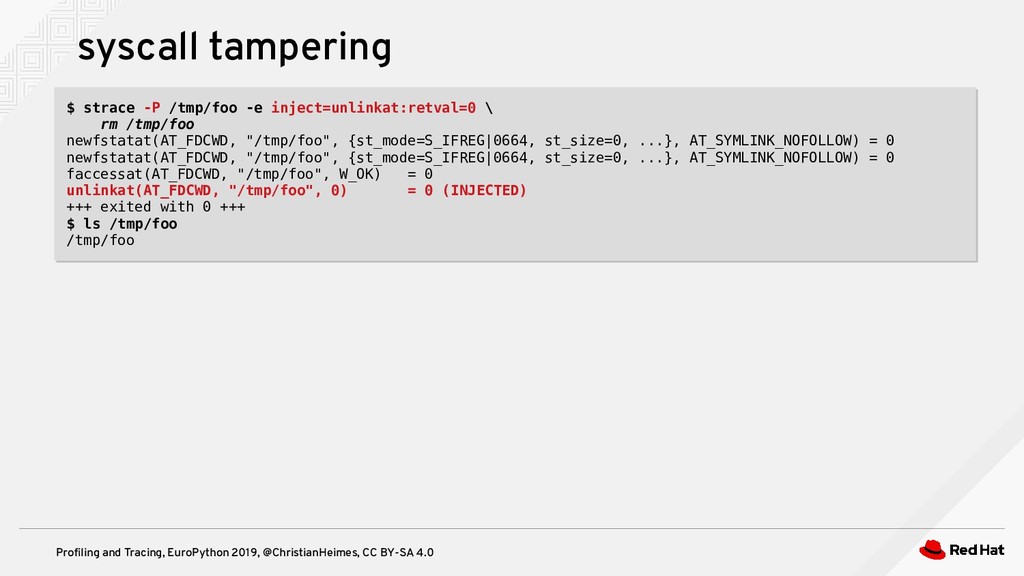
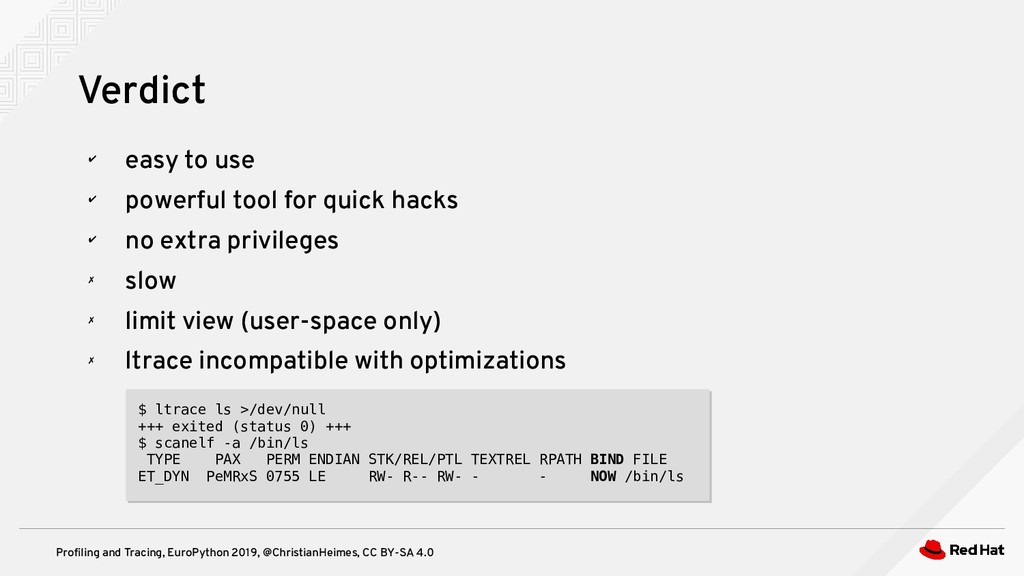
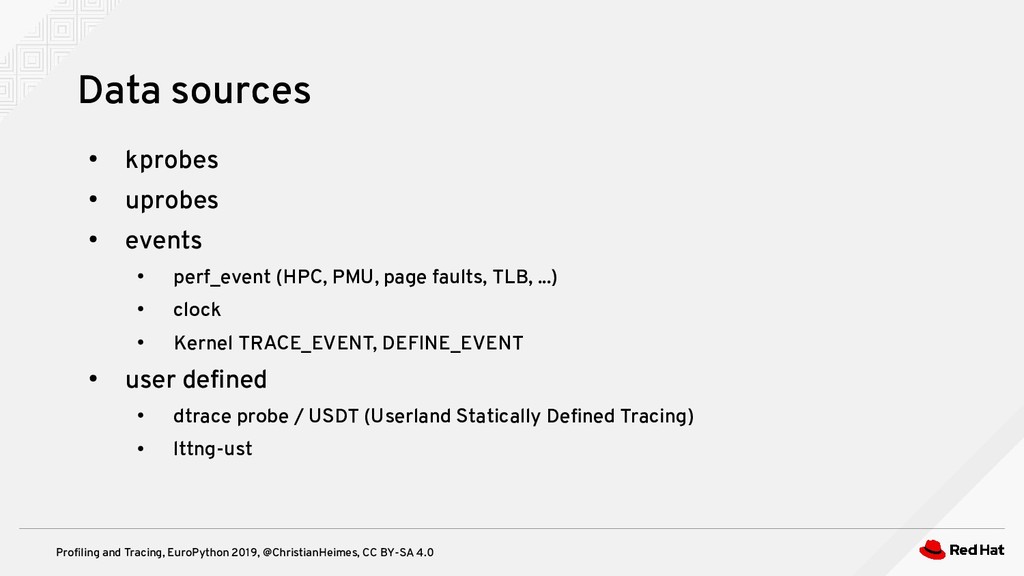
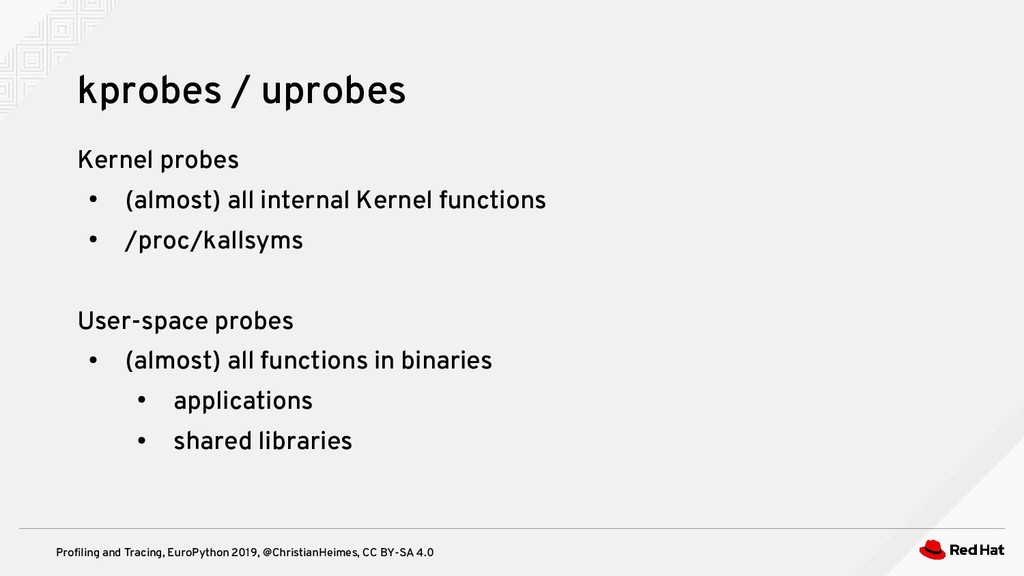
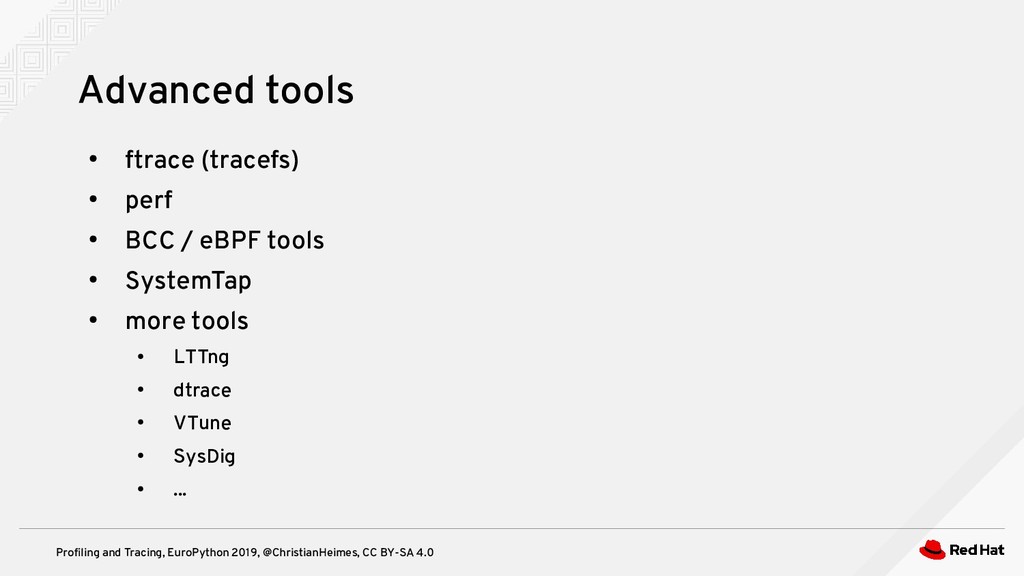
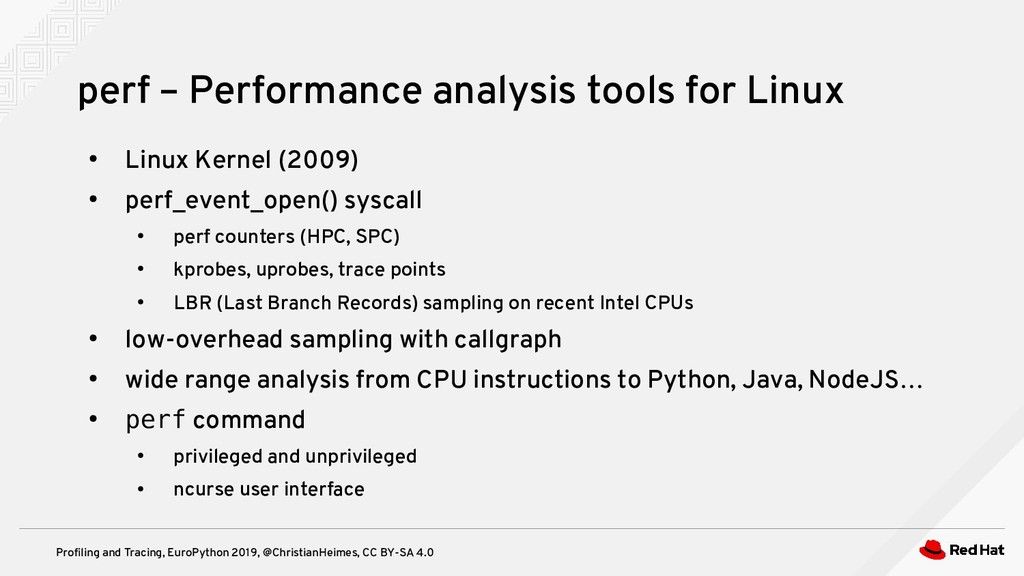
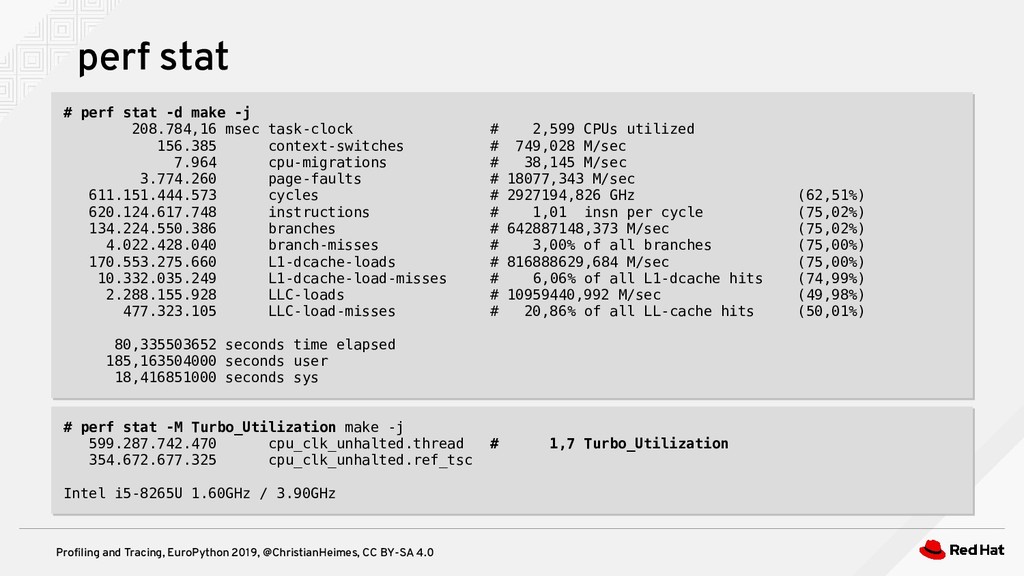
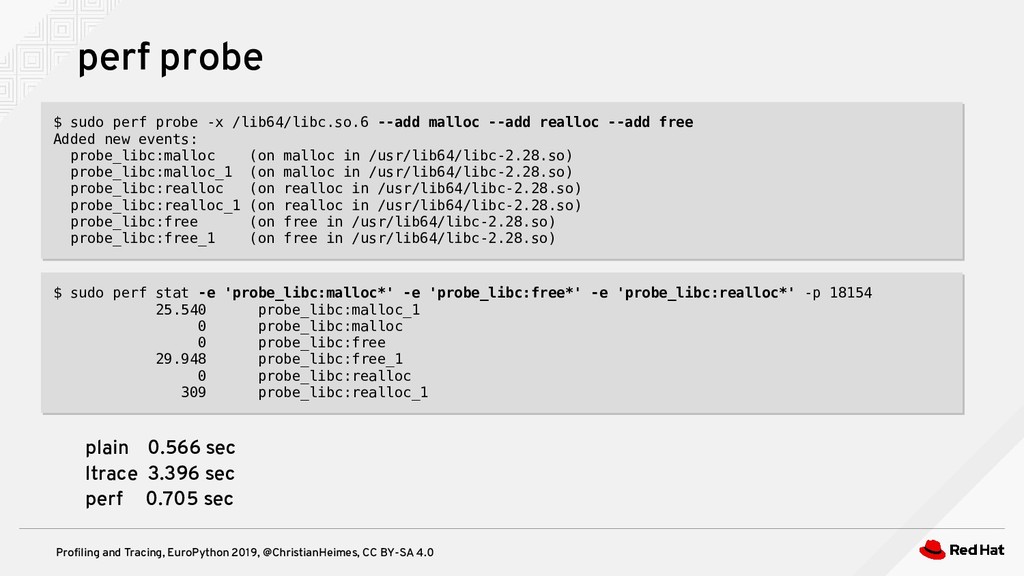
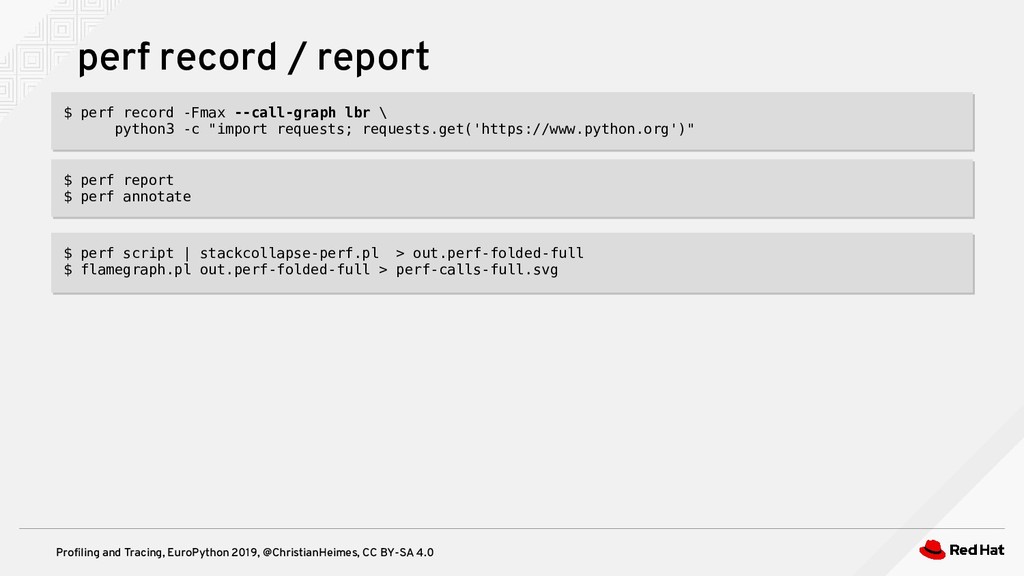
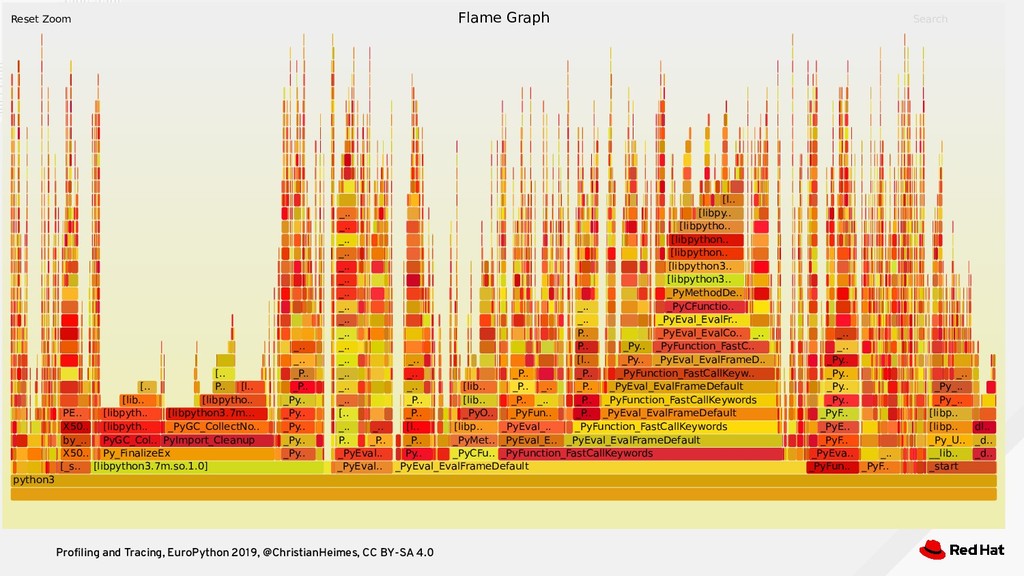
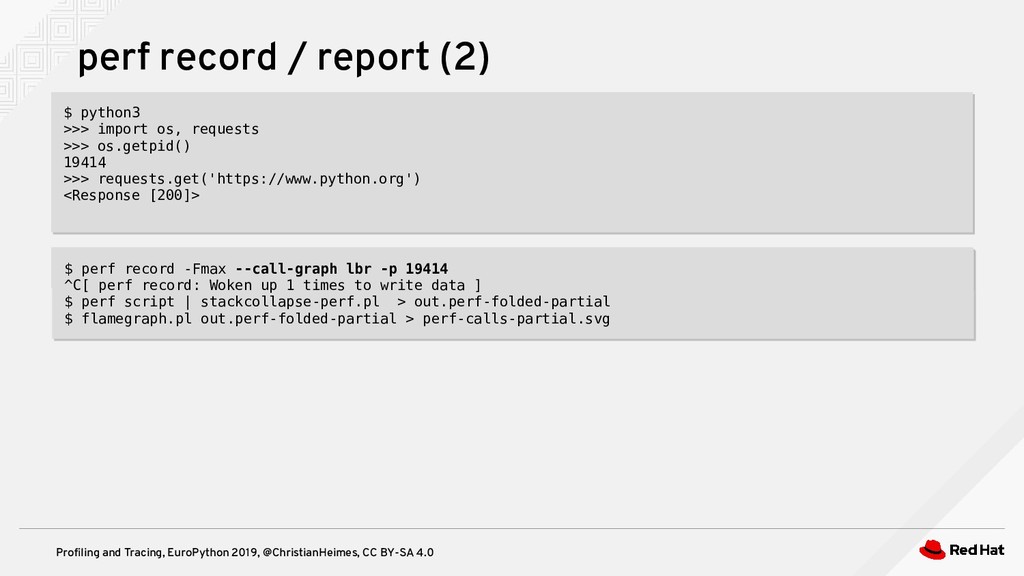
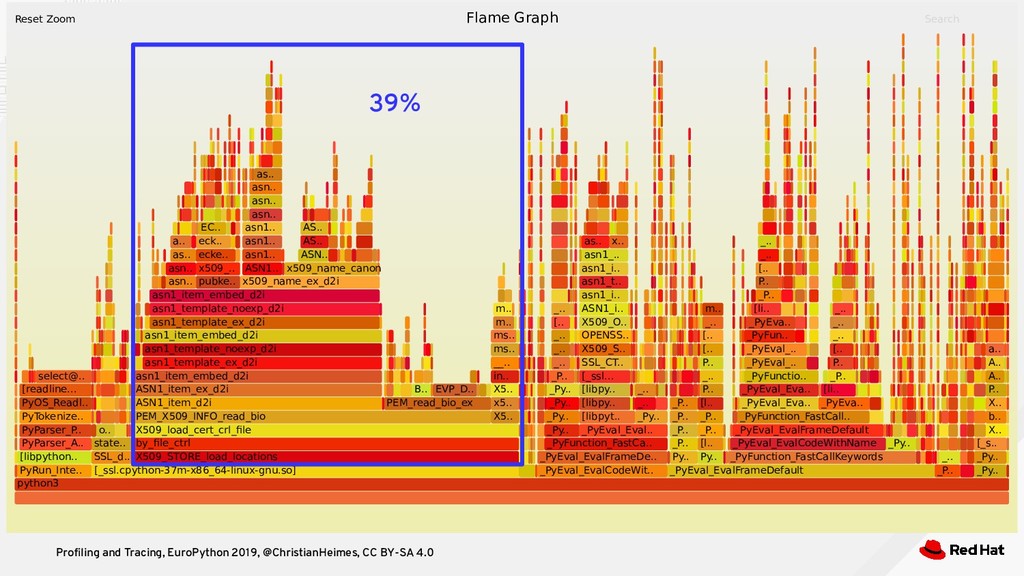
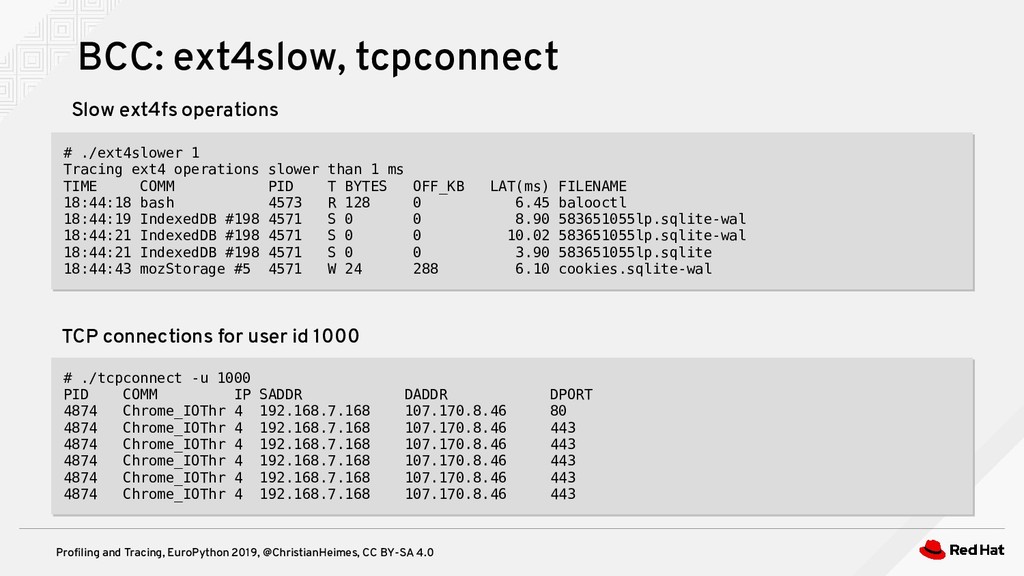
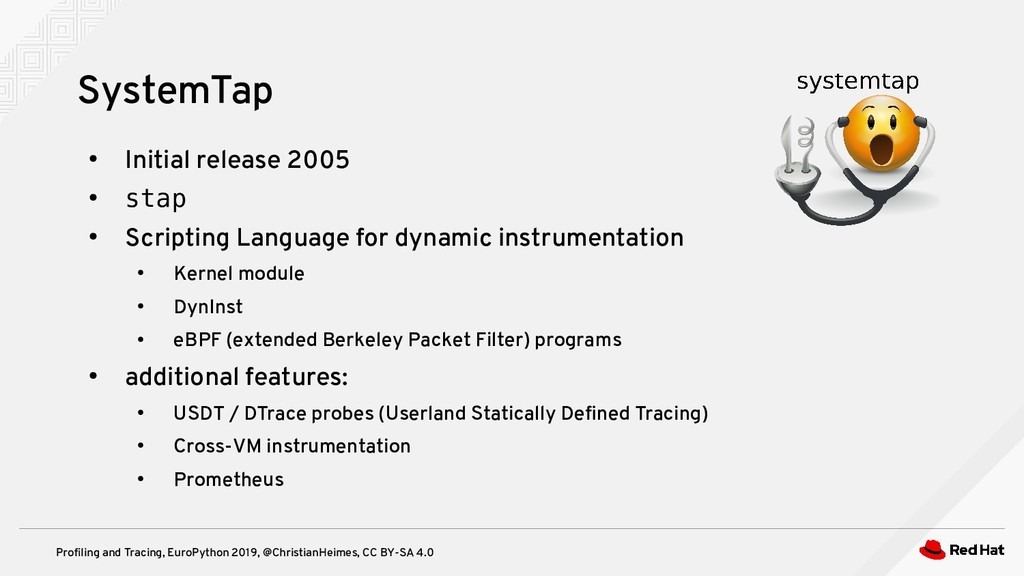
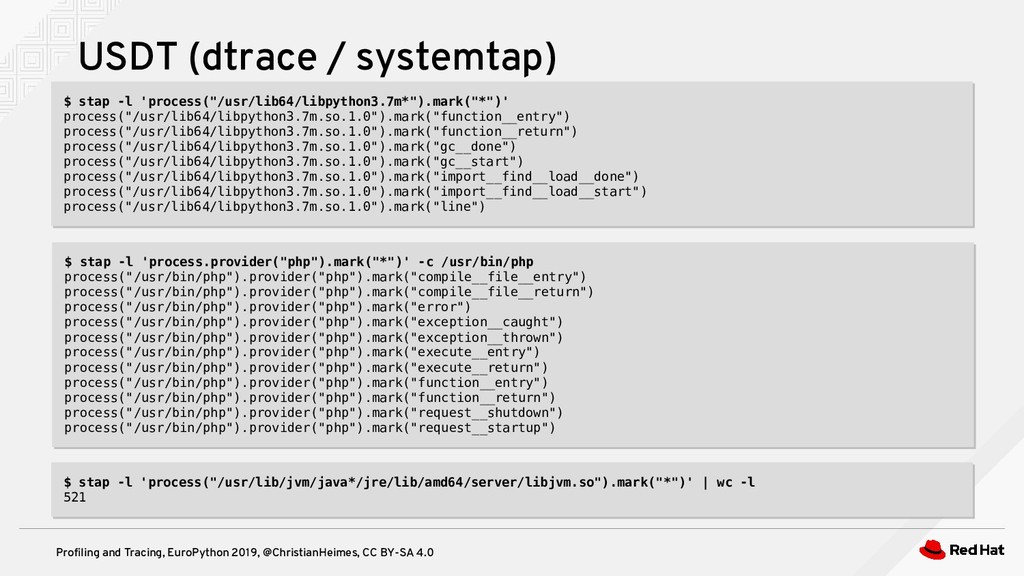
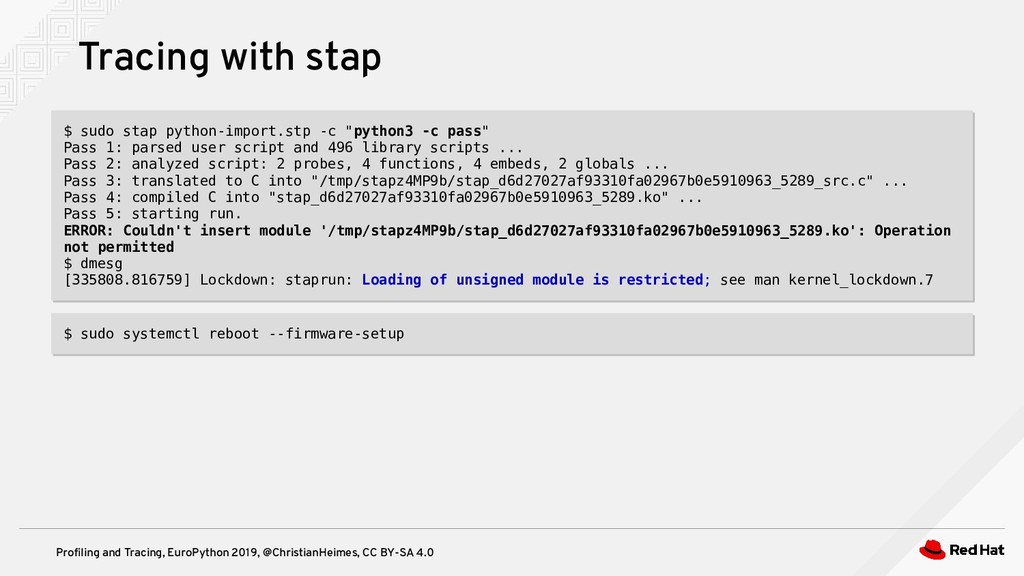
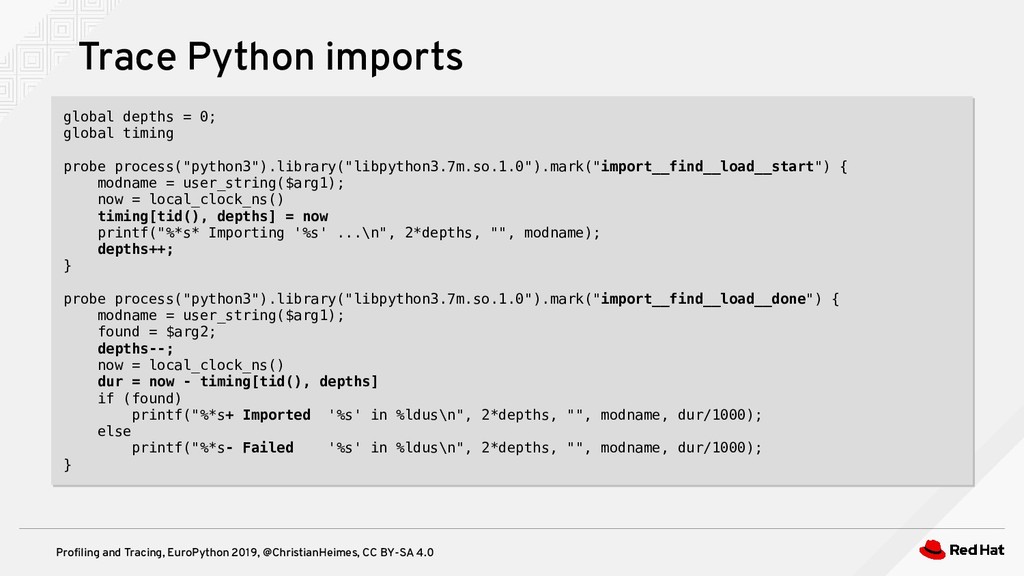
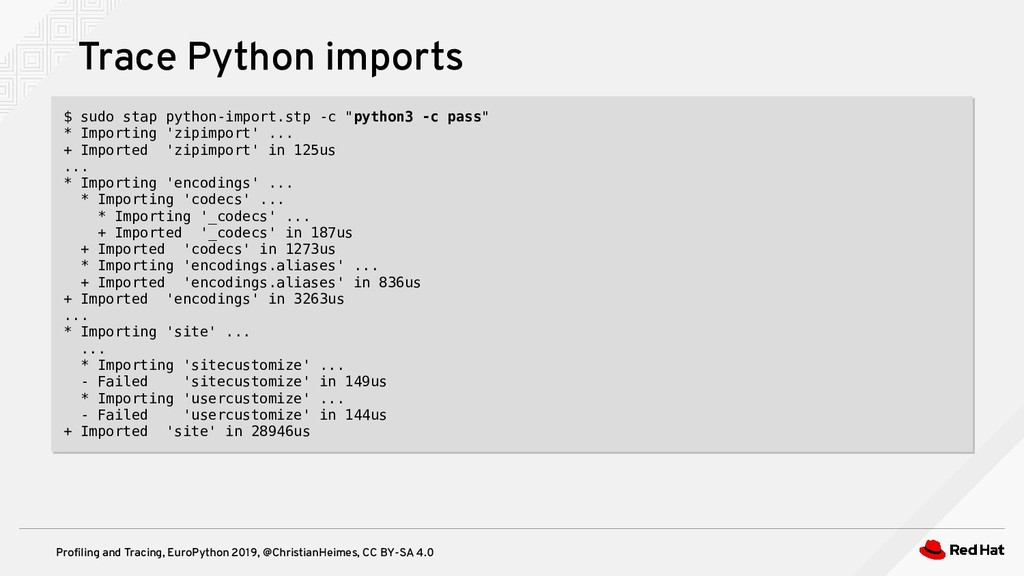
This talks is an introduction and comparison of various low and high level tools for profiling and tracing as well as visualization tools like flame graphs. It covers ptrace, perf, SystemTap, and BCC/eBPF. Ptrace based commands like strace are easy to use but slow. Perf allows lightweight profiling of hardware events and CPU instructions. SystemTap is a powerful toolkit plus DSL to instrument probe points inside the Kernel as well as static SystemTap/DTrace markers in libs and languages like Java, PHP, and Python. CPython comes with a set of instrumentations for SystemTap. BCC is a collection of tools that run as JIT optimized eBPF code in Kernel space.

The talk is an introduction to basic concepts of low-level tracing and profiling on Linux. The main goal is the show the potential of the tools.

Christian Heimes

July 11, 2019
Tweet

More Decks by Christian Heimes

Other Decks in Programming

Transcript

  1. Introduction to low-level
    profiling and tracing
    EuroPython 2019 / Basel 2019-07-11
    Christian Heimes
    Principal Software Engineer
    [email protected] / [email protected]
    @ChristianHeimes

    View Slide

  2. Profiling and Tracing, EuroPython 2019, @ChristianHeimes, CC BY-SA 4.0
    Our systems block every 5 minutes.
    We are loosing money. Fix it!

    View Slide

  3. Profiling and Tracing, EuroPython 2019, @ChristianHeimes, CC BY-SA 4.0
    Is it me, or the GIL?
    Christoph Heer
    EuroPython 2019

    View Slide

  4. Profiling and Tracing, EuroPython 2019, @ChristianHeimes, CC BY-SA 4.0
    requests.get('https://www.python.org')

    View Slide

  5. 2 ½ use case
    for tracing tools

    View Slide

  6. Profiling and Tracing, EuroPython 2019, @ChristianHeimes, CC BY-SA 4.0
    Who am I?

    from Hamburg/Germany

    Python and C developer

    Python core contributor since 2008

    maintainer of ssl and hashlib module

    Python security team

    View Slide

  7. Profiling and Tracing, EuroPython 2019, @ChristianHeimes, CC BY-SA 4.0
    Professional life

    Principal Software Engineer at Red Hat

    Security Engineering

    FreeIPA Identity Management

    Dogtag PKI

    View Slide

  8. Agenda
    &
    Goals

    View Slide

  9. View Slide

  10. Profiling and Tracing, EuroPython 2019, @ChristianHeimes, CC BY-SA 4.0

    introduction

    ptrace (strace, ltrace)

    kernel & hardware tracing tools

    Summary

    ~ 5 minutes Q&A
    Agenda

    View Slide

  11. Profiling and Tracing, EuroPython 2019, @ChristianHeimes, CC BY-SA 4.0

    Brendan Gregg (Netflix)

    Victor Stinner (CPython, Red Hat)
    https://vstinner.readthedocs.io/benchmark.html

    Dmitry Levin (strace)
    ”Modern Strace”, DevConf.CZ 2019

    Michal Sekletár (Red Hat)
    ”Tracing Tools for Systems Engineers”, DevConf.CZ 2019
    Special thanks

    View Slide

  12. Introduction

    View Slide

  13. Profiling and Tracing, EuroPython 2019, @ChristianHeimes, CC BY-SA 4.0
    Debugging – The process of identifying and removing bugs.

    active, expensive, intrusive, slow-down

    deploy new version

    attach debugger
    Tracing – observing and monitoring behavior

    passive, non-intrusive, and fast*
    Profiling – gathering and analyzing metrics

    byproduct of tracing with counting and timing
    Terminology

    View Slide

  14. Profiling and Tracing, EuroPython 2019, @ChristianHeimes, CC BY-SA 4.0
    Application level tracing

    debug builds

    performance logs (MySQL Slow Query Log, PHP xdebug)

    trace hooks (Python: sys.settrace())
    User space tracing

    LD_PRELOAD, ptrace
    Kernel space tracing

    ftrace, eBPF, systemtap, LTTng, ...
    Hardware tracing

    hardware performance counter, PMU, ...
    Methodology

    View Slide

  15. Profiling and Tracing, EuroPython 2019, @ChristianHeimes, CC BY-SA 4.0

    installation of extra packages

    permissions

    root or special group

    CAP_SYS_PTRACE, CAP_SYS_ADMIN, CAP_SYS_MODULE

    recent Kernel (BCC, eBPF)

    debug symbols
    dnf debuginfo-install package, apt install package-dbg

    compiler/linker flags (-g, -fno-omit-framepointer, BIND_LAZY)

    disable secure boot (stap)
    Kernel Live Patching or dynamic modules
    Prerequisites

    View Slide

  16. Profiling and Tracing, EuroPython 2019, @ChristianHeimes, CC BY-SA 4.0
    “Lies, damned lies,
    and statistics”
    ”Wer misst, misst Mist.”

    View Slide

  17. Profiling and Tracing, EuroPython 2019, @ChristianHeimes, CC BY-SA 4.0

    average, median, standard deviation, percentile

    observational error

    systematic error

    random error

    systemic bias, cognitive bias (human factor)

    misleading presentation (Vatican City has 2.27 popes / km²)

    sampling profiler: quantization error, Nyquist–Shannon theorem
    “Producing Wrong Data Without Doing Anything Obviously Wrong!”
    (Mytkowicz, Diwan, Hauswirth, Sweeney)
    benchmarks / statistics

    View Slide

  18. Profiling and Tracing, EuroPython 2019, @ChristianHeimes, CC BY-SA 4.0

    CPU power states (P-states, C-states, TurboBoost, thermal throttling)

    caches (L1 CPU, file system, JIT warm-up, DNS/HTTP)

    hardware IRQs, Address Space Layout Randomization (ASLR)
    https://vstinner.readthedocs.io/benchmark.html
    Computers are noisy

    View Slide

  19. Profiling and Tracing, EuroPython 2019, @ChristianHeimes, CC BY-SA 4.0
    env vars, path length, hostname, username
    Benchmark without Python virtual environment
    % time seconds usecs/call calls errors syscall
    ------ ----------- ----------- --------- --------- ----------------
    28.78 0.000438 0 1440 read
    27.33 0.000416 1 440 25 stat
    9.72 0.000148 1 144 mmap
    ...
    0.79 0.000012 1 11 munmap
    Benchmark inside a virtual environment
    % time seconds usecs/call calls errors syscall
    ------ ----------- ----------- --------- --------- ----------------
    57.12 0.099023 2 61471 munmap
    41.87 0.072580 1 61618 mmap
    0.23 0.000395 1 465 27 stat

    https://mail.python.org/pipermail/python-dev/2019-February/156522.html

    https://homes.cs.washington.edu/~bornholt/post/performance-evaluation.html

    View Slide

  20. Profiling and Tracing, EuroPython 2019, @ChristianHeimes, CC BY-SA 4.0
    Let's profile
    import time
    start = time.time()
    with open('/etc/os-release') as f:
    lines = f.readlines()
    print(time.time() - start)
    import time
    start = time.time()
    with open('/etc/os-release') as f:
    lines = f.readlines()
    print(time.time() - start)

    View Slide

  21. Profiling and Tracing, EuroPython 2019, @ChristianHeimes, CC BY-SA 4.0

    shell

    cat

    Python

    open + read file

    HTTPS request with requests
    Examples

    View Slide

  22. ptrace

    View Slide

  23. Profiling and Tracing, EuroPython 2019, @ChristianHeimes, CC BY-SA 4.0

    process trace syscall

    introduced in Unix Version 6 (~1985)

    user-space tracing

    used by debuggers and code analysis tools

    gdb

    strace

    ltrace

    code coverage

    ...
    ptrace

    View Slide

  24. Profiling and Tracing, EuroPython 2019, @ChristianHeimes, CC BY-SA 4.0
    ltrace – A library call tracer
    $ ltrace -e 'SSL_CTX*@*' \
    python3 -c 'import requests; requests.get("https://www.python.org")'
    _ssl.cpython-37m-x86_64-linux-gnu.so->SSL_CTX_new(0x7fa4a1a77120, 0, 0, 0) = 0x55636123a100
    _ssl.cpython-37m-x86_64-linux-gnu.so->SSL_CTX_get_verify_callback(0x55636123a100, -2, 0x7fa4a1acd5e0, 0x7fa4a1acd5f8) = 0
    _ssl.cpython-37m-x86_64-linux-gnu.so->SSL_CTX_set_verify(0x55636123a100, 0, 0, 0x7fa4a1acd5f8) = 0
    _ssl.cpython-37m-x86_64-linux-gnu.so->SSL_CTX_set_options(0x55636123a100, 0x82420054, 0, 0x7fa4a1acd5f8) = 0x82520054
    _ssl.cpython-37m-x86_64-linux-gnu.so->SSL_CTX_ctrl(0x55636123a100, 33, 16, 0) = 20
    _ssl.cpython-37m-x86_64-linux-gnu.so->SSL_CTX_set_session_id_context(0x55636123a100, 0x7fa4af500494, 7, 0) = 1
    ...
    _ssl.cpython-37m-x86_64-linux-gnu.so->SSL_CTX_free(0x55636123a100, 0x7fa4af4b1e10, -3, 0x7fa4a12734c8) = 0

    View Slide

  25. Profiling and Tracing, EuroPython 2019, @ChristianHeimes, CC BY-SA 4.0
    ltrace – count memory allocations
    >>> import os, time, requests
    >>> os.getpid()
    6504
    # attach ltrace
    >>> start = time.time(); r = requests.get("https://www.python.org"); print(time.time() - start)
    # without ltrace: 0.566 sec
    # with ltrace: 3.396 sec
    >>> import os, time, requests
    >>> os.getpid()
    6504
    # attach ltrace
    >>> start = time.time(); r = requests.get("https://www.python.org"); print(time.time() - start)
    # without ltrace: 0.566 sec
    # with ltrace: 3.396 sec
    $ ltrace -e '[email protected]*' -c -p 6504
    % time seconds usecs/call calls function
    ------ ----------- ----------- --------- --------------------
    53.49 1.104804 37 29796 free
    45.78 0.945565 37 25523 malloc
    0.73 0.015069 48 309 realloc
    ------ ----------- ----------- --------- --------------------
    100.00 2.065438 55628 total

    View Slide

  26. Profiling and Tracing, EuroPython 2019, @ChristianHeimes, CC BY-SA 4.0
    Ring 3
    Ring 2
    Ring 1
    Ring 0
    Kernel
    Device drivers
    Applications
    Device drivers
    Least privileged
    Most privileged
    Hertzsprung at English Wikipedia [CC BY-SA 3.0]

    Paul Kranenburg in 1991

    Dmitry Levin (current maintainer)
    strace – trace system calls and signals
    syscall

    View Slide

  27. Profiling and Tracing, EuroPython 2019, @ChristianHeimes, CC BY-SA 4.0
    strace “open” syscall
    $ strace -e open cat /etc/os-release >/dev/null
    +++ exited with 0 +++
    $ man 2 open
    ...
    The open() system call opens the file specified by pathname.
    $ strace -e open cat /etc/os-release >/dev/null
    +++ exited with 0 +++
    $ man 2 open
    ...
    The open() system call opens the file specified by pathname.
    $ strace -c cat /etc/os-release >/dev/null
    % time seconds usecs/call calls errors syscall
    ------ ----------- ----------- --------- --------- ----------------
    31,40 0,000591 590 1 execve
    13,51 0,000254 28 9 mmap
    8,67 0,000163 40 4 mprotect
    7,20 0,000135 22 6 read
    6,95 0,000131 32 4 openat
    6,36 0,000120 19 6 close
    6,21 0,000117 29 4 brk
    ...
    ------ ----------- ----------- --------- --------- ----------------
    100.00 0,001882 49 2 total

    View Slide

  28. Profiling and Tracing, EuroPython 2019, @ChristianHeimes, CC BY-SA 4.0

    open

    x86_64 glibc <= 2.25: open

    x86_64 glibc >= 2.26: openat

    riscv: openat
    $ strace -e ’/^open(at)?$’
    syscall ABI / API

    stat

    fstat, fstat64, fstatat64, lstat, lstat64, newfstatat, oldfstat, oldlstat, oldstat, stat,
    stat64, statx
    $ strace -e %%stat
    %%stat = %stat + %lstat + %fstat + statx

    View Slide

  29. Profiling and Tracing, EuroPython 2019, @ChristianHeimes, CC BY-SA 4.0
    strace “openat” syscall
    $ strace -e openat cat /etc/os-release >/dev/null
    openat(AT_FDCWD, "/etc/ld.so.cache", O_RDONLY|O_CLOEXEC) = 3
    openat(AT_FDCWD, "/lib64/libc.so.6", O_RDONLY|O_CLOEXEC) = 3
    openat(AT_FDCWD, "/usr/lib/locale/locale-archive", O_RDONLY|O_CLOEXEC) = 3
    openat(AT_FDCWD, "/etc/os-release", O_RDONLY) = 3
    +++ exited with 0 +++
    $ strace -P /etc/os-release cat /etc/os-release >/dev/null
    strace: Requested path '/etc/os-release' resolved into '/usr/lib/os.release.d/os-release-fedora'
    openat(AT_FDCWD, "/etc/os-release", O_RDONLY) = 3
    fstat(3, {st_mode=S_IFREG|0644, st_size=693, ...}) = 0
    fadvise64(3, 0, 0, POSIX_FADV_SEQUENTIAL) = 0
    read(3, "NAME=Fedora\nVERSION=\"29 (Twenty "..., 131072) = 693
    read(3, "", 131072) = 0
    close(3) = 0
    +++ exited with 0 +++

    View Slide

  30. Profiling and Tracing, EuroPython 2019, @ChristianHeimes, CC BY-SA 4.0

    filter class examples

    %file: syscall that take a file name as argument

    %desc: file descriptor related syscalls

    %net: network related syscalls

    arguments

    -P: path filter

    -y: print path associated with file descriptor

    -yy: print protocol information (e.g. ip:port)

    -t/-tt/-ttt: time stamp

    -T: time spent

    -k: caller stack trace
    strace options

    View Slide

  31. Profiling and Tracing, EuroPython 2019, @ChristianHeimes, CC BY-SA 4.0
    strace: requests.get(...)
    $ strace -e %file -p 6504
    ...
    stat("/etc/resolv.conf", {st_mode=S_IFREG|0644, st_size=300, ...}) = 0
    openat(AT_FDCWD, "/etc/hosts", O_RDONLY|O_CLOEXEC) = 3
    openat(AT_FDCWD, "/etc/crypto-policies/back-ends/openssl.config", O_RDONLY) = 4
    openat(AT_FDCWD, "/etc/ssl/cacert.pem", O_RDONLY) = -1 ENOENT (No such file or directory)
    $ strace -e %net -p 6504
    socket(AF_INET, SOCK_DGRAM|SOCK_CLOEXEC|SOCK_NONBLOCK, IPPROTO_IP) = 3
    connect(3, {sa_family=AF_INET, sin_port=htons(53), sin_addr=inet_addr("10.38.5.26")}, 16) = 0
    sendto(3, "\323\300\1\0\0\1\0\0\0\0\0\0\3www\6python\3org\0\0\1\0\1", 32, MSG_NOSIGNAL, NULL, 0) = 32
    recvfrom(3, "\323\300\201\200\0\1\0\2\0\0\0\0\3www\6python\3org\0\0\1\0\1"..., 2048, 0,
    {sa_family=AF_INET, sin_port=htons(53), sin_addr=inet_addr("10.38.5.26")}, [28->16]) = 93
    socket(AF_INET, SOCK_STREAM|SOCK_CLOEXEC, IPPROTO_TCP) = 3
    setsockopt(3, SOL_TCP, TCP_NODELAY, [1], 4) = 0
    connect(3, {sa_family=AF_INET, sin_port=htons(443), sin_addr=inet_addr("151.101.36.223")}, 16) = 0
    getsockopt(3, SOL_SOCKET, SO_TYPE, [1], [4]) = 0
    getpeername(3, {sa_family=AF_INET, sin_port=htons(443), sin_addr=inet_addr("151.101.36.223")}, [16]) = 0

    View Slide

  32. Profiling and Tracing, EuroPython 2019, @ChristianHeimes, CC BY-SA 4.0
    syscall tampering
    $ strace -e inject=socket:error=EMFILE -p 6504
    >>> requests.get("https://www.python.org/en")
    Traceback (most recent call last):
    ...
    socket.gaierror: [Errno -2] Name or service not known
    $ strace -e inject=socket:error=EMFILE:when=2+ -p 6504
    Traceback (most recent call last):
    ...
    File "/usr/lib64/python3.7/socket.py", line 151, in __init__
    _socket.socket.__init__(self, family, type, proto, fileno)
    OSError: [Errno 24] Too many open files
    $ dd if=/dev/zero of=/dev/null bs=1M count=10
    10485760 bytes (10 MB, 10 MiB) copied, 0,00328225 s, 3,2 GB/s
    $ strace -e inject=write:delay_exit=100000 -o /dev/null \
    dd if=/dev/zero of=/dev/null bs=1M count=10
    10485760 bytes (10 MB, 10 MiB) copied, 1,10699 s, 9,5 MB/s
    $ dd if=/dev/zero of=/dev/null bs=1M count=10
    10485760 bytes (10 MB, 10 MiB) copied, 0,00328225 s, 3,2 GB/s
    $ strace -e inject=write:delay_exit=100000 -o /dev/null \
    dd if=/dev/zero of=/dev/null bs=1M count=10
    10485760 bytes (10 MB, 10 MiB) copied, 1,10699 s, 9,5 MB/s

    View Slide

  33. Profiling and Tracing, EuroPython 2019, @ChristianHeimes, CC BY-SA 4.0
    syscall tampering
    $ strace -P /tmp/foo -e inject=unlinkat:retval=0 \
    rm /tmp/foo
    newfstatat(AT_FDCWD, "/tmp/foo", {st_mode=S_IFREG|0664, st_size=0, ...}, AT_SYMLINK_NOFOLLOW) = 0
    newfstatat(AT_FDCWD, "/tmp/foo", {st_mode=S_IFREG|0664, st_size=0, ...}, AT_SYMLINK_NOFOLLOW) = 0
    faccessat(AT_FDCWD, "/tmp/foo", W_OK) = 0
    unlinkat(AT_FDCWD, "/tmp/foo", 0) = 0 (INJECTED)
    +++ exited with 0 +++
    $ ls /tmp/foo
    /tmp/foo

    View Slide

  34. Profiling and Tracing, EuroPython 2019, @ChristianHeimes, CC BY-SA 4.0

    easy to use

    powerful tool for quick hacks

    no extra privileges

    slow

    limit view (user-space only)

    ltrace incompatible with optimizations
    Verdict
    $ ltrace ls >/dev/null
    +++ exited (status 0) +++
    $ scanelf -a /bin/ls
    TYPE PAX PERM ENDIAN STK/REL/PTL TEXTREL RPATH BIND FILE
    ET_DYN PeMRxS 0755 LE RW- R-- RW- - - NOW /bin/ls
    $ ltrace ls >/dev/null
    +++ exited (status 0) +++
    $ scanelf -a /bin/ls
    TYPE PAX PERM ENDIAN STK/REL/PTL TEXTREL RPATH BIND FILE
    ET_DYN PeMRxS 0755 LE RW- R-- RW- - - NOW /bin/ls

    View Slide

  35. Low-level tracing

    View Slide

  36. Profiling and Tracing, EuroPython 2019, @ChristianHeimes, CC BY-SA 4.0
    What is the Kernel doing?
    What is my hardware doing?

    View Slide

  37. Profiling and Tracing, EuroPython 2019, @ChristianHeimes, CC BY-SA 4.0

    Trace inside the Kernel

    file system

    hardware drivers

    Profile hardware

    CPU cache

    memory / MMU

    efficient user-space tracing

    single process

    system-wide

    learn how Kernel space and hardware works
    Low-level tracing

    View Slide

  38. Profiling and Tracing, EuroPython 2019, @ChristianHeimes, CC BY-SA 4.0

    kprobes

    uprobes

    events

    perf_event (HPC, PMU, page faults, TLB, ...)

    clock

    Kernel TRACE_EVENT, DEFINE_EVENT

    user defined

    dtrace probe / USDT (Userland Statically Defined Tracing)

    lttng-ust
    Data sources

    View Slide

  39. Profiling and Tracing, EuroPython 2019, @ChristianHeimes, CC BY-SA 4.0
    Kernel probes

    (almost) all internal Kernel functions

    /proc/kallsyms
    User-space probes

    (almost) all functions in binaries

    applications

    shared libraries
    kprobes / uprobes

    View Slide

  40. Profiling and Tracing, EuroPython 2019, @ChristianHeimes, CC BY-SA 4.0
    perf_event & metrics
    $ perf list
    branch-instructions OR branches [Hardware event]
    branch-misses [Hardware event]
    bus-cycles [Hardware event]
    ...
    alignment-faults [Software event]
    bpf-output [Software event]
    context-switches OR cs [Software event]
    cpu-clock [Software event]
    cpu-migrations OR migrations [Software event]
    ...
    L1-dcache-load-misses [Hardware cache event]
    L1-dcache-loads [Hardware cache event]
    L1-dcache-stores [Hardware cache event]
    L1-icache-load-misses [Hardware cache event]
    ...
    power/energy-cores/ [Kernel PMU event]
    power/energy-gpu/ [Kernel PMU event]
    power/energy-pkg/ [Kernel PMU event]
    power/energy-psys/ [Kernel PMU event]
    ...
    floating point:
    fp_arith_inst_retired.128b_packed_double
    [Number of SSE/AVX computational 128-bit packed double precision floating-point instructions ...]
    ...
    Summary:
    CLKS
    [Per-thread actual clocks when the logical processor is active. This is called 'Clockticks' in VTune]
    CPI
    [Cycles Per Instruction (threaded)]

    View Slide

  41. Profiling and Tracing, EuroPython 2019, @ChristianHeimes, CC BY-SA 4.0
    Kernel trace events
    # find /sys/kernel/debug/tracing/events -name format | wc -l
    1897
    # find /sys/kernel/debug/tracing/events -name format | wc -l
    1897
    # trace-cmd record -e 'cfg80211:cfg80211_inform_bss_frame' -e 'cfg80211:cfg80211_get_bss'
    # trace-cmd report
    ...
    irq/140-iwlwifi-1834 [002] 91697.995389: cfg80211_inform_bss_frame: phy0, band: 1, freq:
    5180(scan_width: 0) signal: -6600, tsb:132269768490547, detect_tsf:0, tsf_bssid: 00:00:00:00:00:00
    kworker/u16:3-23176 [004] 91697.995468: cfg80211_inform_bss_frame: phy0, band: 1, freq:
    5180(scan_width: 0) signal: -6600, tsb:132269768490547, detect_tsf:0, tsf_bssid: 00:00:00:00:00:00
    irq/140-iwlwifi-1834 [002] 91698.002485: cfg80211_inform_bss_frame: phy0, band: 1, freq:
    5180(scan_width: 0) signal: -6700, tsb:132269775585563, detect_tsf:0, tsf_bssid: 00:00:00:00:00:00
    wpa_supplicant-2320 [000] 91698.198168: cfg80211_get_bss: phy0, band: 1, freq: 5180,
    08:96:d7:XX:XX:XX, buf: 0x73, bss_type: 0, privacy: 2
    wpa_supplicant-2320 [000] 91698.216052: cfg80211_get_bss: phy0, band: 1, freq: 5180,
    08:96:d7:XX:XX:XX, buf: 0x73, bss_type: 0, privacy: 2

    View Slide

  42. Advanced Tools

    View Slide

  43. Profiling and Tracing, EuroPython 2019, @ChristianHeimes, CC BY-SA 4.0

    ftrace (tracefs)

    perf

    BCC / eBPF tools

    SystemTap

    more tools

    LTTng

    dtrace

    VTune

    SysDig

    ...
    Advanced tools

    View Slide

  44. Profiling and Tracing, EuroPython 2019, @ChristianHeimes, CC BY-SA 4.0

    Sun Microsystems (2005) for Solaris

    DTrace markers

    operating systems

    Linux (2017)

    Windows (2018)

    macOS

    FreeBSD

    NetBSD
    DTrace

    View Slide

  45. Profiling and Tracing, EuroPython 2019, @ChristianHeimes, CC BY-SA 4.0

    by Steven Rostedt (2008)

    tracefs /sys/kernel/debug/tracing

    ring buffer / pipes

    GCC profiling, live patching, trampolines

    foundation for Live Kernel Patching

    frontends

    busybox / shell (cat, echo)

    trace-cmd

    KernelShark

    perf
    ftrace – Function Tracer

    View Slide

  46. Profiling and Tracing, EuroPython 2019, @ChristianHeimes, CC BY-SA 4.0
    trace-cmd: NFS open (simplified)
    # trace-cmd record -p function_graph -l 'nfs_*' -c python3 python_open.py
    # trace-cmd report
    ...
    -56879 [006] 8398345.057032: funcgraph_entry: | nfs_permission() {
    -56879 [006] 8398345.057032: funcgraph_entry: 0.065 us | nfs_do_access();
    -56879 [006] 8398345.057033: funcgraph_entry: | nfs_do_access() {
    -56879 [006] 8398345.057034: funcgraph_entry: 0.912 us | nfs_alloc_fattr();
    -56879 [006] 8398345.057947: funcgraph_entry: | nfs_refresh_inode() {
    -56879 [006] 8398345.057950: funcgraph_entry: | nfs_refresh_inode.part.27() {
    -56879 [006] 8398345.057951: funcgraph_entry: | nfs_refresh_inode_locked() {
    -56879 [006] 8398345.057952: funcgraph_entry: | nfs_update_inode() {
    -56879 [006] 8398345.057952: funcgraph_entry: 0.190 us | nfs_file_has_writers();
    -56879 [006] 8398345.057954: funcgraph_entry: 0.235 us | nfs_set_cache_invalid();
    -56879 [006] 8398345.057955: funcgraph_exit: 3.089 us | }
    -56879 [006] 8398345.057955: funcgraph_exit: 4.106 us | }
    -56879 [006] 8398345.057955: funcgraph_exit: 4.830 us | }
    -56879 [006] 8398345.057964: funcgraph_exit: + 14.691 us | }
    -56879 [006] 8398345.057964: funcgraph_entry: 0.053 us | nfs_access_set_mask();
    -56879 [006] 8398345.057966: funcgraph_entry: 2.621 us | nfs_access_add_cache();
    -56879 [006] 8398345.057970: funcgraph_exit: ! 936.572 us | }
    -56879 [006] 8398345.057970: funcgraph_exit: ! 937.907 us | }

    View Slide

  47. Profiling and Tracing, EuroPython 2019, @ChristianHeimes, CC BY-SA 4.0
    trace-cmd: NFS open call stack
    # trace-cmd record -p function --func-stack -l nfs_permission -c python3 python_open.py
    # trace-cmd report
    -56912 [006] 8398623.394239: function: nfs_permission
    -56912 [006] 8398623.394605: kernel_stack:
    => nfs_permission (ffffffffc075d415)
    => inode_permission (ffffffffba2bb34e)
    => link_path_walk.part.49 (ffffffffba2bf172)
    => path_lookupat.isra.53 (ffffffffba2bfbc3)
    => filename_lookup.part.67 (ffffffffba2c18c0)
    => vfs_statx (ffffffffba2b5683)
    => __do_sys_newstat (ffffffffba2b5c29)
    => do_syscall_64 (ffffffffba00418b)
    => entry_SYSCALL_64_after_hwframe (ffffffffbaa00088)
    ...
    -56912 [006] 8398623.396069: function: nfs_permission
    -56912 [006] 8398623.396093: kernel_stack:
    => nfs_permission (ffffffffc075d415)
    => inode_permission (ffffffffba2bb34e)
    => link_path_walk.part.49 (ffffffffba2bf172)
    => path_openat (ffffffffba2bfdef)
    => do_filp_open (ffffffffba2c26e3)
    => do_sys_open (ffffffffba2ada36)
    => do_syscall_64 (ffffffffba00418b)
    => entry_SYSCALL_64_after_hwframe (ffffffffbaa00088)

    View Slide

  48. Profiling and Tracing, EuroPython 2019, @ChristianHeimes, CC BY-SA 4.0

    Linux Kernel (2009)

    perf_event_open() syscall

    perf counters (HPC, SPC)

    kprobes, uprobes, trace points

    LBR (Last Branch Records) sampling on recent Intel CPUs

    low-overhead sampling with callgraph

    wide range analysis from CPU instructions to Python, Java, NodeJS…

    perf command

    privileged and unprivileged

    ncurse user interface
    perf – Performance analysis tools for Linux

    View Slide

  49. Profiling and Tracing, EuroPython 2019, @ChristianHeimes, CC BY-SA 4.0
    perf stat
    # perf stat -d make -j
    208.784,16 msec task-clock # 2,599 CPUs utilized
    156.385 context-switches # 749,028 M/sec
    7.964 cpu-migrations # 38,145 M/sec
    3.774.260 page-faults # 18077,343 M/sec
    611.151.444.573 cycles # 2927194,826 GHz (62,51%)
    620.124.617.748 instructions # 1,01 insn per cycle (75,02%)
    134.224.550.386 branches # 642887148,373 M/sec (75,02%)
    4.022.428.040 branch-misses # 3,00% of all branches (75,00%)
    170.553.275.660 L1-dcache-loads # 816888629,684 M/sec (75,00%)
    10.332.035.249 L1-dcache-load-misses # 6,06% of all L1-dcache hits (74,99%)
    2.288.155.928 LLC-loads # 10959440,992 M/sec (49,98%)
    477.323.105 LLC-load-misses # 20,86% of all LL-cache hits (50,01%)
    80,335503652 seconds time elapsed
    185,163504000 seconds user
    18,416851000 seconds sys
    # perf stat -M Turbo_Utilization make -j
    599.287.742.470 cpu_clk_unhalted.thread # 1,7 Turbo_Utilization
    354.672.677.325 cpu_clk_unhalted.ref_tsc
    Intel i5-8265U 1.60GHz / 3.90GHz
    # perf stat -M Turbo_Utilization make -j
    599.287.742.470 cpu_clk_unhalted.thread # 1,7 Turbo_Utilization
    354.672.677.325 cpu_clk_unhalted.ref_tsc
    Intel i5-8265U 1.60GHz / 3.90GHz

    View Slide

  50. Profiling and Tracing, EuroPython 2019, @ChristianHeimes, CC BY-SA 4.0
    perf probe
    $ sudo perf probe -x /lib64/libc.so.6 --add malloc --add realloc --add free
    Added new events:
    probe_libc:malloc (on malloc in /usr/lib64/libc-2.28.so)
    probe_libc:malloc_1 (on malloc in /usr/lib64/libc-2.28.so)
    probe_libc:realloc (on realloc in /usr/lib64/libc-2.28.so)
    probe_libc:realloc_1 (on realloc in /usr/lib64/libc-2.28.so)
    probe_libc:free (on free in /usr/lib64/libc-2.28.so)
    probe_libc:free_1 (on free in /usr/lib64/libc-2.28.so)
    $ sudo perf stat -e 'probe_libc:malloc*' -e 'probe_libc:free*' -e 'probe_libc:realloc*' -p 18154
    25.540 probe_libc:malloc_1
    0 probe_libc:malloc
    0 probe_libc:free
    29.948 probe_libc:free_1
    0 probe_libc:realloc
    309 probe_libc:realloc_1
    $ sudo perf stat -e 'probe_libc:malloc*' -e 'probe_libc:free*' -e 'probe_libc:realloc*' -p 18154
    25.540 probe_libc:malloc_1
    0 probe_libc:malloc
    0 probe_libc:free
    29.948 probe_libc:free_1
    0 probe_libc:realloc
    309 probe_libc:realloc_1
    plain 0.566 sec
    ltrace 3.396 sec
    perf 0.705 sec

    View Slide

  51. Profiling and Tracing, EuroPython 2019, @ChristianHeimes, CC BY-SA 4.0
    perf record / report
    $ perf record -Fmax --call-graph lbr \
    python3 -c "import requests; requests.get('https://www.python.org')"
    $ perf record -Fmax --call-graph lbr \
    python3 -c "import requests; requests.get('https://www.python.org')"
    $ perf script | stackcollapse-perf.pl > out.perf-folded-full
    $ flamegraph.pl out.perf-folded-full > perf-calls-full.svg
    $ perf script | stackcollapse-perf.pl > out.perf-folded-full
    $ flamegraph.pl out.perf-folded-full > perf-calls-full.svg
    $ perf report
    $ perf annotate
    $ perf report
    $ perf annotate

    View Slide

  52. Profiling and Tracing, EuroPython 2019, @ChristianHeimes, CC BY-SA 4.0
    Flame Graph
    Reset Zoom Search
    [l..
    [libpython..
    [libp..
    _Py..
    PyGC_Col..
    P..
    _start
    _Py..
    _P..
    _Py_U..
    dl..
    [libpython3.7m.so.1.0]
    _PyEva..
    _..
    [libpyth..
    _..
    _PyFunction_FastCallKeyw..
    X50..
    _P..
    _..
    [libpython..
    [l..
    _..
    _..
    _..
    _..
    _P..
    _P..
    X50..
    [libpytho..
    _PyGC_CollectNo..
    _..
    _PyEval_..
    [libpython3..
    _P..
    P..
    _PyMethodDe..
    _Py..
    _PyMet..
    _PyFunction_FastCallKeywords
    [libpyth..
    _..
    [libpython3..
    [lib..
    P..
    _..
    _Py..
    by_.. _PyEval_E..
    _..
    _PyE..
    _PyEval_EvalFrameDefault
    _Py..
    [libp..
    _Py_..
    python3
    [..
    [_s..
    _P..
    _PyEval_EvalFrameDefault
    _..
    _..
    _PyF..
    PE..
    _d..
    _..
    _..
    _PyCFu..
    _..
    [lib..
    Py_FinalizeEx
    _PyFunction_FastCallKeywords
    _P..
    _PyFun..
    [libpy..
    _..
    [libpytho..
    _P..
    [..
    P..
    _d..
    _PyFunction_FastC..
    _..
    _..
    _PyFun..
    _PyEval_EvalCo..
    _PyO..
    _..
    _..
    _PyEval_EvalFr..
    _PyEval_EvalFrameDefault
    _P..
    _P..
    _PyEval..
    [libp..
    _P..
    _..
    [..
    _Py..
    __lib..
    [libpython3.7m...
    [l..
    _..
    _PyEval_EvalFrameD..
    _Py..
    _Py..
    _Py_..
    _PyF..
    _P..
    _PyCFunctio..
    _Py..
    _..
    [l..
    Py..
    _..
    _PyEval.. _PyFunction_FastCallKeywords
    _..
    _..
    [lib..
    _Py..
    _..
    _PyEval_EvalFrameDefault
    _PyF..
    _..
    _P..
    PyImport_Cleanup
    _Py..
    _..
    _..

    View Slide

  53. Profiling and Tracing, EuroPython 2019, @ChristianHeimes, CC BY-SA 4.0
    perf record / report (2)
    $ python3
    >>> import os, requests
    >>> os.getpid()
    19414
    >>> requests.get('https://www.python.org')

    $ python3
    >>> import os, requests
    >>> os.getpid()
    19414
    >>> requests.get('https://www.python.org')

    $ perf record -Fmax --call-graph lbr -p 19414
    $ perf record -Fmax --call-graph lbr -p 19414
    $ perf record -Fmax --call-graph lbr -p 19414
    ^C[ perf record: Woken up 1 times to write data ]
    $ perf script | stackcollapse-perf.pl > out.perf-folded-partial
    $ flamegraph.pl out.perf-folded-partial > perf-calls-partial.svg
    $ perf record -Fmax --call-graph lbr -p 19414
    ^C[ perf record: Woken up 1 times to write data ]
    $ perf script | stackcollapse-perf.pl > out.perf-folded-partial
    $ flamegraph.pl out.perf-folded-partial > perf-calls-partial.svg

    View Slide

  54. Profiling and Tracing, EuroPython 2019, @ChristianHeimes, CC BY-SA 4.0
    Flame Graph
    Reset Zoom Search
    [_ssl...
    asn1..
    _PyFunctio..
    asn1_i..
    asn1_template_ex_d2i
    o..
    asn1_template_noexp_d2i
    _P..
    ASN..
    PyRun_Inte..
    _..
    _PyEval_EvalFrameDe..
    X509_S..
    _..
    _..
    X5..
    _Py..
    in..
    asn1_item_embed_d2i
    __..
    PyTokenize..
    X509_STORE_load_locations
    asn1_item_embed_d2i
    x..
    _Py..
    A..
    by_file_ctrl
    asn1_template_ex_d2i
    asn1_t..
    _PyEval_..
    [..
    asn..
    as.. asn1_..
    state..
    _Py..
    ms..
    [email protected]
    EC..
    ms..
    _..
    [_s..
    _Py..
    PEM_X509_INFO_read_bio
    a..
    b..
    _..
    _..
    PEM_read_bio_ex
    _..
    _PyFunction_FastCall..
    Py..
    X509_O..
    [libpy..
    asn1..
    _PyEva..
    eck..
    m..
    Py..
    asn1_item_embed_d2i
    asn1_i..
    [..
    _..
    _P..
    AS..
    ecke..
    P..
    _..
    x509_name_ex_d2i
    ASN1_i..
    pubke..
    _P..
    _P..
    asn1..
    P..
    _Py..
    _..
    EVP_D..
    SSL_CT..
    x5..
    [..
    _PyEval_Eva..
    X..
    B..
    _PyEval_EvalCodeWithName
    AS..
    _..
    [libpython..
    _PyEval_EvalCodeWit..
    [li..
    _PyEval_..
    [li..
    [l..
    _..
    _PyFunction_FastCa..
    PyOS_Readl..
    [readline...
    X509_load_cert_crl_file
    A..
    [libpy..
    PyParser_A..
    [_ssl.cpython-37m-x86_64-linux-gnu.so]
    m..
    ASN1_item_d2i
    m..
    P..
    x509_..
    PyParser_P..
    asn..
    _PyEva..
    [libpyt..
    _PyFunction_FastCallKeywords
    _PyEval_Eval..
    _P..
    _P..
    [..
    asn..
    SSL_d..
    a..
    P..
    x509_name_canon
    _Py..
    _PyFun..
    X5..
    _P.. _PyEval_EvalFrameDefault
    _P..
    _Py..
    _..
    [l..
    P..
    _PyEval_Eva..
    _..
    asn..
    _P..
    _P..
    python3
    asn1_template_noexp_d2i
    [..
    X..
    as..
    _PyEval_EvalFrameDefault
    ASN1..
    as..
    asn..
    OPENSS..
    _Py..
    ASN1_item_ex_d2i
    39%

    View Slide

  55. Advanced Analysis
    in Kernel space

    View Slide

  56. Profiling and Tracing, EuroPython 2019, @ChristianHeimes, CC BY-SA 4.0
    A toolkit for creating efficient kernel tracing and manipulation programs.

    Run tracing code in Kernel space

    extended BPF (Berkeley Packet Filters)

    eBPF JIT 2014

    Usable Kernel 4.12 - 4.15, 2017

    C with Python and LUA frontends

    rich set of existing tools
    BCC – BPF Compiler Collection

    View Slide

  57. Profiling and Tracing, EuroPython 2019, @ChristianHeimes, CC BY-SA 4.0

    View Slide

  58. Profiling and Tracing, EuroPython 2019, @ChristianHeimes, CC BY-SA 4.0
    BCC: ext4slow, tcpconnect
    # ./ext4slower 1
    Tracing ext4 operations slower than 1 ms
    TIME COMM PID T BYTES OFF_KB LAT(ms) FILENAME
    18:44:18 bash 4573 R 128 0 6.45 balooctl
    18:44:19 IndexedDB #198 4571 S 0 0 8.90 583651055lp.sqlite-wal
    18:44:21 IndexedDB #198 4571 S 0 0 10.02 583651055lp.sqlite-wal
    18:44:21 IndexedDB #198 4571 S 0 0 3.90 583651055lp.sqlite
    18:44:43 mozStorage #5 4571 W 24 288 6.10 cookies.sqlite-wal
    # ./tcpconnect -u 1000
    PID COMM IP SADDR DADDR DPORT
    4874 Chrome_IOThr 4 192.168.7.168 107.170.8.46 80
    4874 Chrome_IOThr 4 192.168.7.168 107.170.8.46 443
    4874 Chrome_IOThr 4 192.168.7.168 107.170.8.46 443
    4874 Chrome_IOThr 4 192.168.7.168 107.170.8.46 443
    4874 Chrome_IOThr 4 192.168.7.168 107.170.8.46 443
    4874 Chrome_IOThr 4 192.168.7.168 107.170.8.46 443
    Slow ext4fs operations
    TCP connections for user id 1000

    View Slide

  59. Profiling and Tracing, EuroPython 2019, @ChristianHeimes, CC BY-SA 4.0
    BCC: sslsniff
    >>> requests.get("https://ep2019.europython.eu/", headers={'Accept-Encoding': 'identity'})
    >>> requests.get("https://ep2019.europython.eu/", headers={'Accept-Encoding': 'identity'})
    # ./sslsniff -p18888
    FUNC TIME(s) COMM PID LEN
    WRITE/SEND 0.000000000 python3 18888 146
    ----- DATA -----
    GET / HTTP/1.1
    Host: ep2019.europython.eu
    User-Agent: python-requests/2.20.0
    Accept-Encoding: identity
    Accept: */*
    Connection: keep-alive
    ----- END DATA -----
    READ/RECV 0.159023041 python3 18888 8192
    ----- DATA -----
    HTTP/1.1 200 OK
    Server: nginx
    Date: Sun, 07 Jul 2019 19:18:46 GMT
    Content-Type: text/html; charset=utf-8
    Content-Length: 33617
    Connection: keep-alive
    X-Frame-Options: SAMEORIGIN
    ETag: "c35dc4fdb282b799d8d77703a7553424"
    Vary: Accept-Language, Cookie
    Content-Language: en
    Set-Cookie: django_language=en; expires=Mon, 06-Jul-2020 19:18:46 GMT; Max-Age=31536000; Path=/

    View Slide

  60. Profiling and Tracing, EuroPython 2019, @ChristianHeimes, CC BY-SA 4.0
    BPFtrace
    https://github.com/iovisor/bpftrace
    $ sudo bpftrace -e \
    'tracepoint:syscalls:sys_enter_openat { printf("%s(%d) %s\n", comm, pid, str(args->filename)); }'
    irqbalance(1329) /proc/interrupts
    $ sudo bpftrace -e \
    'tracepoint:syscalls:sys_enter_openat { printf("%s(%d) %s\n", comm, pid, str(args->filename)); }'
    irqbalance(1329) /proc/interrupts
    >>> requests.get("https://ep2019.europython.eu/")
    $ sudo bpftrace -e 'uprobe:/lib64/libc.so.6:malloc / comm == "python3" / { @bytes = hist(arg0); }'
    @bytes:
    [1] 171 | |
    [2, 4) 661 |@@@ |
    [4, 8) 356 |@ |
    [8, 16) 1699 |@@@@@@@@ |
    [16, 32) 7929 |@@@@@@@@@@@@@@@@@@@@@@@@@@@@@@@@@@@@@@@ |
    [32, 64) 10513 |@@@@@@@@@@@@@@@@@@@@@@@@@@@@@@@@@@@@@@@@@@@@@@@@@@@@|
    [64, 128) 1574 |@@@@@@@ |
    [128, 256) 609 |@@@ |
    [256, 512) 1006 |@@@@ |
    [512, 1K) 608 |@@@ |
    [1K, 2K) 362 |@ |
    [2K, 4K) 57 | |
    [4K, 8K) 10 | |
    [8K, 16K) 12 | |
    [16K, 32K) 13 | |
    [32K, 64K) 2 | |
    [64K, 128K) 1 | |

    View Slide

  61. Profiling and Tracing, EuroPython 2019, @ChristianHeimes, CC BY-SA 4.0

    Initial release 2005

    stap

    Scripting Language for dynamic instrumentation

    Kernel module

    DynInst

    eBPF (extended Berkeley Packet Filter) programs

    additional features:

    USDT / DTrace probes (Userland Statically Defined Tracing)

    Cross-VM instrumentation

    Prometheus
    SystemTap

    View Slide

  62. Profiling and Tracing, EuroPython 2019, @ChristianHeimes, CC BY-SA 4.0
    USDT (dtrace / systemtap)
    $ stap -l 'process("/usr/lib64/libpython3.7m*").mark("*")'
    process("/usr/lib64/libpython3.7m.so.1.0").mark("function__entry")
    process("/usr/lib64/libpython3.7m.so.1.0").mark("function__return")
    process("/usr/lib64/libpython3.7m.so.1.0").mark("gc__done")
    process("/usr/lib64/libpython3.7m.so.1.0").mark("gc__start")
    process("/usr/lib64/libpython3.7m.so.1.0").mark("import__find__load__done")
    process("/usr/lib64/libpython3.7m.so.1.0").mark("import__find__load__start")
    process("/usr/lib64/libpython3.7m.so.1.0").mark("line")
    $ stap -l 'process("/usr/lib/jvm/java*/jre/lib/amd64/server/libjvm.so").mark("*")' | wc -l
    521
    $ stap -l 'process("/usr/lib/jvm/java*/jre/lib/amd64/server/libjvm.so").mark("*")' | wc -l
    521
    $ stap -l 'process.provider("php").mark("*")' -c /usr/bin/php
    process("/usr/bin/php").provider("php").mark("compile__file__entry")
    process("/usr/bin/php").provider("php").mark("compile__file__return")
    process("/usr/bin/php").provider("php").mark("error")
    process("/usr/bin/php").provider("php").mark("exception__caught")
    process("/usr/bin/php").provider("php").mark("exception__thrown")
    process("/usr/bin/php").provider("php").mark("execute__entry")
    process("/usr/bin/php").provider("php").mark("execute__return")
    process("/usr/bin/php").provider("php").mark("function__entry")
    process("/usr/bin/php").provider("php").mark("function__return")
    process("/usr/bin/php").provider("php").mark("request__shutdown")
    process("/usr/bin/php").provider("php").mark("request__startup")

    View Slide

  63. Profiling and Tracing, EuroPython 2019, @ChristianHeimes, CC BY-SA 4.0
    Tracing with stap
    $ sudo stap python-import.stp -c "python3 -c pass"
    Pass 1: parsed user script and 496 library scripts ...
    Pass 2: analyzed script: 2 probes, 4 functions, 4 embeds, 2 globals ...
    Pass 3: translated to C into "/tmp/stapz4MP9b/stap_d6d27027af93310fa02967b0e5910963_5289_src.c" ...
    Pass 4: compiled C into "stap_d6d27027af93310fa02967b0e5910963_5289.ko" ...
    Pass 5: starting run.
    ERROR: Couldn't insert module '/tmp/stapz4MP9b/stap_d6d27027af93310fa02967b0e5910963_5289.ko': Operation
    not permitted
    $ dmesg
    [335808.816759] Lockdown: staprun: Loading of unsigned module is restricted; see man kernel_lockdown.7
    $ sudo systemctl reboot --firmware-setup
    $ sudo systemctl reboot --firmware-setup

    View Slide

  64. Profiling and Tracing, EuroPython 2019, @ChristianHeimes, CC BY-SA 4.0
    Trace Python imports
    global depths = 0;
    global timing
    probe process("python3").library("libpython3.7m.so.1.0").mark("import__find__load__start") {
    modname = user_string($arg1);
    now = local_clock_ns()
    timing[tid(), depths] = now
    printf("%*s* Importing '%s' ...\n", 2*depths, "", modname);
    depths++;
    }
    probe process("python3").library("libpython3.7m.so.1.0").mark("import__find__load__done") {
    modname = user_string($arg1);
    found = $arg2;
    depths--;
    now = local_clock_ns()
    dur = now - timing[tid(), depths]
    if (found)
    printf("%*s+ Imported '%s' in %ldus\n", 2*depths, "", modname, dur/1000);
    else
    printf("%*s- Failed '%s' in %ldus\n", 2*depths, "", modname, dur/1000);
    }

    View Slide

  65. Profiling and Tracing, EuroPython 2019, @ChristianHeimes, CC BY-SA 4.0
    Trace Python imports
    $ sudo stap python-import.stp -c "python3 -c pass"
    * Importing 'zipimport' ...
    + Imported 'zipimport' in 125us
    ...
    * Importing 'encodings' ...
    * Importing 'codecs' ...
    * Importing '_codecs' ...
    + Imported '_codecs' in 187us
    + Imported 'codecs' in 1273us
    * Importing 'encodings.aliases' ...
    + Imported 'encodings.aliases' in 836us
    + Imported 'encodings' in 3263us
    ...
    * Importing 'site' ...
    ...
    * Importing 'sitecustomize' ...
    - Failed 'sitecustomize' in 149us
    * Importing 'usercustomize' ...
    - Failed 'usercustomize' in 144us
    + Imported 'site' in 28946us

    View Slide

  66. Profiling and Tracing, EuroPython 2019, @ChristianHeimes, CC BY-SA 4.0

    extremely detailed information

    fast, efficient

    apps, system-wide, hardware events

    wide range from pre-build tools to custom code

    extremely detailed information

    learning curve

    turn your 64 core server into a Commodore C64
    Verdict

    View Slide

  67. Summary

    View Slide

  68. Profiling and Tracing, EuroPython 2019, @ChristianHeimes, CC BY-SA 4.0

    strace, bpftrace: Swiss Army Knife for simple tasks

    bcc: pre-build tools

    perf: benchmarking and hot-spot profiling

    SystemTap: dynamic languages (Python)

    ftrace: tracing on old Kernels

    future: eBFP
    In my humble opinion

    View Slide

  69. Profiling and Tracing, EuroPython 2019, @ChristianHeimes, CC BY-SA 4.0

    Brendan Gregg http://www.brendangregg.com/

    eBPF

    IOVisor Project https://www.iovisor.org/

    Sergey Klyaus: “Dynamic Tracing with DTrace & SystemTap”
    https://myaut.github.io/dtrace-stap-book/

    SystemTap beginners guide
    https://sourceware.org/systemtap/SystemTap_Beginners_Guide/

    Eben Freeman, PyBay16: Python Tracing Superpowers
    https://speakerdeck.com/emfree/python-tracing-superpowers-with-systems-tools

    Slides: https://speakerdeck.com/tiran/
    Resources

    View Slide

  70. Questions?
    @ChristianHeimes
    [email protected]
    [email protected]
    https://speakerdeck.com/tiran/

    View Slide

  71. THANK YOU
    plus.google.com/+RedHat
    youtube.com/user/RedHatVideos
    facebook.com/redhatinc
    twitter.com/RedHat
    linkedin.com/company/red-hat

    View Slide