Upgrade to Pro — share decks privately, control downloads, hide ads and more …

Thesis prefinal

Anirudh
May 11, 2014
110

Thesis prefinal

Anirudh

May 11, 2014
Tweet

Transcript

  1. Augmented tools with transparent displays Anirudh Sharma Submitted to the

    Program in Media Arts and Sciences, School of Architecture and Planning in partial fulfillment of the requirements for the degree of Master of Science In Media Arts and Sciences at the MASSACHUSETTS INSTITUTE OF TECHNOLOGY June 2014 © Massachusetts Institute of Technology 2014. All rights reversed. Author _________________ Anirudh Sharma Program in Media, Arts and Sciences Massachusetts Institute of Technology Certified by _________________ Pattie Maes Thesis supervisor Professor, Media, Arts and Sciences Massachusetts Institute of Technology Accepted by _________________ Pattie Maes Associate Academic head Massachusetts Institute of Technology
  2. Reader _________________ V. Michael Bove Principal Research Scientist, MIT Media

    Lab Reader _________________ Mark Billinghurst Professor, Human Interface Technology Lab, New Zealand Reader _________________ Marco Tempest Fellow, Media Lab, Massachusetts Institute of Technology
  3. ACKNOWLEDGEMENTS I am very grateful to be born into a

    family that gave me a basis of education, and made me ask questions. I am also thankful to those innumerable people I have met during my travels who have indirectly given me ideas that I consider important. I would also like to thank my undergraduate friends Rahul, Sudhanshu and everyone at 14/163 with whom I started my DIY journey and learnt how to make the best use of minimum resources amid the deserts of Rajasthan. My readers, thank you for such sustaining support from the start. Your questions and gentle guidance have made these projects, this thesis, those papers and myself as a better researcher than they ever could’ve been without you. I would like to thank Prof. Pattie Maes for accepting me into Fluid Interfaces Group and her guidance throughout the course of my Masters research. Big thanks to Marco Tempest, from whose magic I draw a lot of motivation. I would also like to thank Fluid Interfaces admin Amna Carrero, who’s been helping always and serving good green tea when I felt lazy. I would to thank my magically motivated UROPs Lirong Liu and Meghana Bhat who helped with implementation of Glassified, and spent countless sleepless nights. Other props go to Richard Park and Eric Ruleman, who collaborated with designing optical and architectural use-cases with bigger transparent displays.
  4. Figure 1.1: 1870’s show of pepper’s ghost. Magician fights a

    virtual ghost Figure 1.2: Modern transparent display prototypes by Samsung and Polytron Figure 1.3: Transparent monochrome nanoparticle display Figure 2.1: Transparent display blended within see-through ruler Figure 2.2: System Architecture of DigitalDesk Figure 2.3: a) Free body diagram b) A projectile reacts to strokes on paper Figure 2.4: Augmenting dimensions of the triangle on the ruler Figure 2.5: Glassified Working Figure 2.6: Wacom digitizer tracks the pen strokes on paper Figure 2.7: System Input Figure 2.8: System Output Figure 2.9: RGB capable transparent OLED Figure 2.10: a) Optical magnification of a pear b) Magnification with cell structure overlay and metadata Figure 2.11: A traditional laser cutter setup Figure 2.12: Indirect manipulation on laser-cutters Figure 2.13: Proposed Clearcut system Figure 2.14: LLP on laser cutter panel Figure 2.13: Carpenters using hand fabrication to work on wood piece Figure 2.16: Interaction and actuation layer Figure 2.17: Using Residual projection to fit a circle between the pre-used Material Figure 2.18: a) Drawing on laser cutter and projection on piece b) Tool path aligns to projection on work piece Figure 2.19: (a) Physical laser-cut designs (b) Virtually copied onto workpiece ready for interaction (rescaling
  5. etc.) Figure 2.20: a) User hand-drawing schematic b) Laser cutter

    tool follows the residual projection on actuation layer Figure 2.21: Using a Caliper to measure on top of the CAD Figure 2.22: Collimating lens with projection reducing the light dispersion Figure 2.23: 1. Aquarium 2. Tracking cameras 3. Transparent Display   Figure 2.24: T.- Transparent display + magnification C.- Circuit Figure 3.1: Data Structure and Variables Figure 3.2: Function Dependency For Line Detection Figure 3.3: Conditions for Merging Lines Figure 3.4: Example I for Merging Lines (Simple Quadrilateral) Figure 3.5: Example II for Merging Lines (Complex Quadrilateral)      
  6. 1. Introduction ‘Any sufficiently advanced technology is indistinguishable from magic.’

    -Arthur C. Clarke When we were kids we saw magic in nature’s every activity, in the line of ants crawling up the wall, the airplane flying in the sky, the rainbow. That ability to be surprised and awed slowly fades away as we grow up. Magicians ignite that long lost sense of getting surprised/awed in kids and adults alike. To create their ‘magical surprises’ they learn to exploit technology, optics, and chemistry and disguise it as magic. Glass is such a magical material – it is rigid but it lets you see through as if it didn’t exist. It has properties of a hard solid, and transparency of air, the perfect medium for doing digital augmentation since it is least expected there - hence, magic. The basic idea of this thesis is to augment information on glass.
  7. Figure 1.1: 1870’s show of pepper’s ghost. Magician fights a

    virtual ghost Magicians may have been the first ones to do ‘augmented reality’ by using a Pepper’s ghost technique in which using plate glass [Figure 1.1], plexiglass or plastic film and special lighting techniques, they can make objects seem to appear or disappear, to become transparent, or to make one object morph into another. The Pepper’s Ghost illusion upon which the 3D Telepresence Chair is based was first described by Giambattista della Porta, a 16th Century Neapolitan scientist and natural philosopher. In 1584’s Magia Naturalis (Natural Magic), he describes an illusion entitled “How we may see in a Chamber things that are not.” 3 Nearly 300 years later, in 1862, engineer and inventor Henry Dircks demonstrated a small-scale version of this illusion at a booth in the Royal Polytechnic Institute of London. Dircks was the proprietor of a Phantasmagoria, a stage show featuring fearsome displays of the supernatural created with the optical and special effects of the day. He may have been introduced to the ghost illusion by traveling Italian stage magicians familiar with della Porta’s version, as these performers likely shared the same traveling circuit as the Phantasmagoria and Magic Lantern shows. However, Dircks’ version of the effect was so cumbersome that it would have required the theater to be remodeled or purpose-built to house the effect. After seeing the demonstration, John
  8. Henry Pepper, director and “Professor” of the Royal Polytechnic Institute,

    developed the effect into a practical illusion that could be more easily deployed in preexisting theaters. He has been remembered ever since as the inventor of the effect [21]. There are several types of augmented reality techniques. Firstly, Head-worn displays (HWD)- Users mount this type of display on their heads, providing imagery in front of their eyes. Two types of HWDs exist: optical see-through and video see-through (Figure 2). The latter uses video capture from head-worn video cameras as a background for the AR overlay, shown on an opaque dis- play, whereas the optical see-through method provides the AR overlay through a transparent display. Secondly, Handheld displays- Some AR systems use hand- held, flat-panel LCD displays that use an attached cam- era to provide video see-through-based augmentations. The handheld display acts as a window or a magnifying glass that shows the real objects with an AR overlay. Finally Augemented Reality with projectors In this approach, the desired virtual information is projected directly on the physical objects to be augmented- the intention is for the augmentations to be coplanar with the surface onto which they project and to project them from a single room-mounted projector, with no need for special eyewear. A transparent display is an electronic display that allows the user to see what is shown on the glass screen while still being able to see through it. It is a technology that has been around for a decade or two, but only this year is it being incorporated by companies such as Samsung and Planar Systems into consumer products like handheld devices, televisions, and other technology. These screens can be used for augmented reality, a way of enhancing your view of the world with digital images overlaid onto real ones. Earliest exploration with Optical see through displays include work by Kiyokawa et al. [22] who
  9. novel optics design for OST displays (ELMO-1) that can present

    mutual occlusion of real and virtual environments.                             Figure 1.2: Modern transparent display prototypes by Samsung and Polytron   Figure 1.3: Transparent monochrome nanoparticle display at Photonics and Modern Electro-Magnetics Group, MIT A few research projects [14][15][16][17][18] have utilized transparent displays to augment visual information on real objects behind them or to manipulate GUIs on screen from the back side of the screens. These kinds of utilizations have so far relied on the condition that users face the transparent display from only one side of the display. Heo, Heejeong
  10. et.al [19] propose a double sided interaction using a projected

    transparent display. Transparent displays have two primary properties: they are transparent to a certain degree to allow the transmission of the image of the real environment, and they emit the light of the rendered graphics [1]. For a designer these properties can be translated as: they are see-through preserving the natural perspective. The on-screen data is visible from both the sides. A LCD type transparent display can attain different shades of color and be opaque if need be since they’re subtractive. Figure 1.3b shows an example of LCD based subtractive nature applied on a print graphic. Figure 1.3b: A paper printout of Mona Lisa, modified by transparent display OLED/Pepper’s ghost type of transparent displays are additive in nature. Both these types will have different implications and use-cases. However, while augmenting a 3D scene the user can focus only on one plane at a time, the real object or the display. This limitation of transparent displays is called binocular parallax i.e. the user has to look at objects at different distances from them with transparent displays. In this thesis, I am specifically interested in the use of transparent displays to augment tools. I will discuss my experiments with three handheld tools - Glassified Ruler and Augmented Magnifier, a paper bookmark as well as one larger tool, the Clearcut laser cutter. The first three handheld systems are mixed reality based in which the user
  11. gets feedback based on physical strokes, objects from the real

    world. Three of these are passive feedback tools, where the users receives graphical feedback on their handtool (ruler, bookmark and magnifying glass). The third experiment, the Clearcut lasercutter system, discusses bringing more directness to interact with fabrication tools using a transparent display. Unlike the other two, Clearcut is an active interface that deals with stylus input and two layers of information (interaction and actuation). 2. Augmented Hand-tools 2.1 Glassified: An Augmented Ruler based on a Transparent Display for Real-time Interactions with Paper Computer-based drafting has become increasingly important in the work of architects and designers. However, drawing by hand is still preferred by many for early- stage drawings and is commonly used in education and the arts. A ruler is one of the most basic and useful tools for drawing on paper, especially for architectural and scientific drawings. ‘Traditional ruler + transparent display= Glassified’ Glassified is a modified ruler with a transparent display to supplement physical strokes made on paper with virtual graphics. Because the display is transparent, both the physical Figure 2.4: Transparent display blended within see-through ruler
  12. strokes and the virtual graphics are visible in the same

    plane. A digitizer captures the pen strokes in order to update the graphical overlay, fusing the traditional function of a ruler with the added advantages of a digital, display-based system. We describe use-cases of Glassified in the areas of math and physics and discuss its advantages over traditional systems. The design is such that the transparent display is embedded within the see- through ruler. The Glassified lets the user draw lines, as a traditional ruler would do, after which the ruler itself augments the strokes on paper, to ‘bring the paper to life’.     2.1.1 Related work DigitalDesk[8] uses overhead cameras and projectors whose functions are to read what is being shown on the desk and to project electronic images onto the desk, therefore providing characteristics of an electronic workstation. Figure 2.2 shows the system architecture of DigitalDesk. It is considered a great contribution to Human- Computer Interaction (HCI) or more specifically, Augmented Reality (AR) since it proposed the idea to mix the physical world with the digital information world which was a major achievement at that time. In Wellner’s paper, several useful applications were described such as calculators which are projected on top of the desk and can be used just like real ones. However, a system with a camera and a projector overhead is quite bulky and not portable. Also, using projectors results in a problem of occlusion when something is being drawn under the projector.    
  13. Figure 2.2: System Architecture of DigitalDesk (Wellner, YEAR) 2.1 Augmentation

    of 2D information using transparent displays A ruler has two fundamental functions: 1) to draw straight lines and 2) to measure dimensions. Through our Glassified prototype we aimed at extending those capabilities. Using the Glassified ruler we primarily explored two paper-based scenarios. 2.1.a Drawing Our goal here is to complement rather than replace a typical ruler. In this usecase, we seek inspiration from traditional physics lessons about gravity, projectile motion etc. The student draws a regular free-body-diagram with penstrokes specifying gravity, horizontal velocity and walls. The interaction is such that overlaying the strokes with the ruler starts a physics simulation (Figure 2.3)
  14. Figure 2.3:a) Free body diagram b) A projectile reacts to

    strokes on paper 2.1.b Measurement Measuring the length of lines is one of the primary functions of a traditional ruler. We try to extend that fundamental capability by letting the user measure other attributes such as angles and complex measurements that require computation, such as area of bounded curves. (Figure 2.4) Figure 2.4: Augmenting dimensions of a triangle on the ruler
  15. 2.1.2 Working A digitizer (Figure 2.6) that is placed below

    the paper captures the pen strokes. The strokes are analyzed on the computer, which sends coordinate data for augmentation on the graphical overlay. We use a 2-inch 4D Systems transparent OLED with 80 percent transparency connected to the computer via serial communication. Figure 2.6: Wacom digitizer tracks the pen strokes on paper Figure 2.5: Glassified system architecture
  16. 2.2 Glassified+ The evolved version of Glassified tracks using an

    overhead camera to track pen input. In this new implementation, a camera digitizer takes the place of the Wacom digitizer, which results in a more flexible use. Camera digitizers outperform Wacom digitizers in terms of technology as the Wacom API only provides the most basic functionalities such as returning the pixelvalue of touchinput, we therefore cannot sense the display position even when the display is placed on it. On the contrary, using camera based tracking can easily capture the display position. The data structures used in Glassified+ are explained in the appendix. 2.2.1 System Input To keep track of Glassified on paper, we use computer vision techniques. In the new method, a camera digitizer takes the place of the Wacom digitizer. In this system, the input is a drawing usually done by pen and is limited to straight lines and dots for simplicity. As can be seen in Figure 2.7, there are three sample input images. Figure 2.7a shows one possible input for mathematical measurement use-case, which could be a polygon or lines. Figure 2.7b is a sample input for reflective animation and is composed of one or more polygons, a dot representing a ball and an arrow which indicates the initial velocity of (a)Math Measurement (b) Reflection (c) Projectile Figure 2.7: System Input
  17. the ball. Figure 2.7c is the input for projectile animation.

    Similar to the reflective animation input, it includes a dot and a velocity arrow. Additionally, it has one more arrow, which is the gravity indicator and a number of lines, a generalization of a polygon. 2.2.2 System Output The output of this system will not be generated until strokes are well recognized and the display position is figured out. Figure 2.8a shows the output for mathematical measurement use-case. It can be seen that the exact polygon is regenerated by the overlaying transparent display and the result, which is the area of the polygon, is shown inside the polygon. (a) Math Measurement (b) Reflection (c) Projectile Figure 2.8: System Output Figure 2.8b shows a snapshot of the output of the reflective animation which is not much different from its input, except for a colored ball produced by the transparent display. In the actual animation, the ball is actually moving on the display and it bounces whenever it encounters a line barrier which is specified on the paper underneath the display. It is important to note that during the animation, even if the display position is changed, line barriers beneath it can still affect the ball movement as if the ball on the display can “see” those underlying strokes. Figure 2.8c, similarly to the reflective animation use-case,
  18. is an output snapshot for projected animation. The only difference

    between these two kinds of output animation is that the velocity of the ball is affected by more factors which, besides bouncing effect and initial velocity, include gravity and friction. The property of being adaptable to the change of display position also applies to this usecase. 2.3 Augmented Magnifier- Combination of optical properties of glass and transparent displays ‘Magnifying glass + transparent display = Augmented magnifying glass’ In this project we explore the fusion of magnifying properties of glass and digital augmentation of transparent displays - combining two layers of information: digital and optical. The system preserves both the regular functionality of a magnifying glass and digital capability of transparent displays on the same plane. Metaphorically, we could extend the magnification through the magnifying glass by digitally showing a 1000x magnification overlay and other metadata about the subject. This work could be extended to any lens system- read magnifying glass, telescopes, microscopes to add a layer of digital information without obstructing the optical abilities of the system. 2.3.1 Related Work Magic lenses, inspired by Bier et al. [11], let a person move a plane above the tabletop to see individual, modified views onto the data that are visualized on the table [9] [10]. However, these tools show the augmented information on an opaque, 2-D display, which breaks the directness of the real world. Looser et. al.[12], Rekimoto et. al. [13] describe a magnifying glass based AR interface using a handheld probe. However, both of these again use video-see-through based AR as opposed to our transparent display, that fuses optical and digital magnification in the
  19. same plane. Figure 2.9: a) Optical magnification of a pear

    Figure 2.9 b) Augmented Magnification with cell structure overlay and metadata 2.3.2 Interaction The user sees the normal magnification through the system. The normal magnification is by virtue of the optical property of the glass (lens). The magic happens when the system
  20. also overlays the scientific name, common name, molecular level magnification

    in addition to the regular magnification. 2.3.3 Working Technically the system works by means of a small front facing RGB camera, which runs object detection within openCV, detects the fruit and overlays its common name, scientific name and cell structure magnification onto the optical magnification. A handheld bugfinder magnifying glass is overlayed with same sized 4D systems transparent OLED (Figure 2.10) which shows the graphical feedback.   Figure 2.10: 4D Systems RGB capable transparent OLED used in our experiments 2.4 LittleAR Bookmarks Augmenting Paper Through Tangible Bookmarks   We introduce LittleAR, a transparent-display based bookmark which digitally augments the text and shapes in a printed book. The system brings the printed text/graphics to life
  21. while preserving the visual aesthetics of the printed text. Like

    a magnifying glass, the user can easily move the device around and compare real and augmented images. LittleAR was motivated by the observation of users who have held on to paper, despite powerful incentives to adopt electronic devices such as Kindle, tablets, etc. LittleAR is a 2-inch transparent OLED and a mouse sensor combined in a form similar to a paper bookmark. The design naturally affords translation on paper such that the user can move it along paper similar to a magnifying glass. The advantage of using a thin OLED display is that it allows graphical augmentations to be almost in the same plane as the paper, which creates a seamless fusion of the virtual and real world. This preserves the aesthetics of the printed books while giving the user an option to see the printed text/image augmented with dynamic text and graphics. 2.4.1 Related Work   A few systems have been introduced previously for augmenting paper books. System in [23] requires the user to look at a handheld display to see the book on the screen augmented with digital graphics. The camera on the device looks for markers on the paper and augments them with 3D graphics. Projection-based setups such as [24], [25] require the instrumentation of the environment so as to project graphical augmentations on top of the paper. In contrast, the LittleAR prototype overcomes these limitations by the virtue of its size and form-factor. The system is a tangible paper bookmark with embedded transparent display, requiring no instrumentation of the surroundings.   2.4.2 The Prototype The LittleAR prototype consists of a transparent OLED display combined with an optical mouse sensor into a thin form factor that fits in a book. The display is 2 mm thick and
  22. overlaps the paper [Figure 2.11], which prevents any binocular parallax

    issues that are common with transparent displays. The mouse sensor reports the X, Y coordinates to the computer, which sends the corresponding graphics to the display. The user places LittleAR at the top left of the page in order to set the origin for the mouse coordinates. The system does not perceive the actual contents on the page, but knows which digital augmentation to show for every location and direction on a page.   2.4.3 USE CASES There are several practical use cases for the LittleAR bookmark. Some of them are described below: Figure 2.11: LittleAR prototype: Optical mouse sensor and the transparent display
  23. 2.4.3.1 Augmented Text A first class of use cases relates

    to the augmentation of text on a page. As an example, a user can slide the bookmark over a piece of text to see the definition of the word appear on the display. The user is still able to see the original text through the ‘glass’ of the bookmark while seeing the graphical augmentation overlaid on top [Figure 2.12]. A similar use case would show translation of words into another language. 2.4.3.2 Window into the world A second class of applications involves the use of animation to bring some figures to life. For example, a printed picture of an internal combustion engine could be animated as the user moves LittleAR over the printed image, merging both the digital augmentation and original paper contents.   Figure 2.13: The user moves over a portion of the map to discover country boundaries. Figure 2.12: The user translates by moving over the character.
  24. 2.5 User comments We invited 2 female and 3 male

    participants from another department at the institute. Glassified with pen tracking and augmented magnifier were used. Subjects were given about 10 minutes to play with the system and they were encouraged to speak out their comments aloud. Although we did not collect quantitative data, the users’ comments and difficulties were sufficient to illuminate the need/properties of the systems we tested. Further studies with well-defined user tasks and quantitative measures will be performed to support these results. 2.5.1 Glassified The users took a while to get familiar with the system, due to technical complexity in running the prototype. We asked them to draw certain shapes and asked them to guess the dimensions of sides, area. Most users guessed approximate answers. Overlaying the drawn shape with ruler, they resulted in instant joy. Most of them commented that it would be great if they had it when they were kids. Some users found it awkward to have a physics engine based learning system embedded into a ruler. One user commented that she likes fact that the system is camouflaged into the ruler, and visual augmentations should be on-demand if users want more information about the written strokes. Most users preferred the math-learning app than physics simulations one. 2.5.2 Augmented magnifier We showed users a slice of green apple and a plant leaf and asked them to study it with simple magnifying glass, a common assignment that elementary school children do. Thereafter, we asked them to study the same with Augmented Magnifier with digitally overlayed cell structure and scientific name. Users found that digital overlaying is helpful
  25. for learning more while looking at the real world physical

    sample. Some users commented it would be better to have digital annotations on the object plane ideally. This points to important directions for future research - we need stereoscopic transparent displays with eyetracking, which is a technical roadblock for now. Users reported that they would prefer to have such a little window while dealing with circuits, archaeology samples, as a visual probe into the real world. Two users reported that they find this functionality similar to that of video see-through Augmented Reality. Upon further digging he commented it would make more sense to use a bigger transparent display on a bigger magnifier. 3. Direct manipulation on fabrication tools Clearcut- what you see is what you cut   Figure 2.14: A traditional laser cutter setup The evolving field of personal fabrication holds much potential for the coming decade and laser-cutters allow fast and high quality cutting and engraving of a wide range of materials. However, the method by which users interact with such tools has not evolved
  26. much. The process of drafting a design and executing the

    cut still contains many intermediaries and complications. In this chapter we describe Clearcut, a system for direct manipulation with laser cutters. The system consists of a semi-transparent display and optical tracking interfaced with the laser cutter so that users can draw virtual graphics on top of their workpiece. The system also helps users to make virtual copies of physical artifacts, which can later be cut. Clearcut offers advantages currently only accessible through hand fabrication such as letting users adjust designs quickly and iteratively based on the visual feedback by virtue of stylus, and letting users use ruler and protractor as if they were working on the physical piece directly. A laser-cutter allows fast and high quality cutting and en- graving of a wide range of materials. This machine directs a high-power laser beam on material to be cut or engraved, leaving the edge with a high-quality surface finishes. Common applications include production of artwork or simple utilities for day-to-day use. However, the interaction method to give input to these tools is disconnected from the work-piece. In such interfaces Zellweger suggests that a discrepancy exists between a virtual representation during design and spatial impact in the real world [3]. Changes to any designs must be made away from the piece that will be cut. Our informal survey with 7 users reveals consequent major issues with the present day laser cutters. The users frequently made the following comments:
  27.   Figure 2.15: Indirect manipulation on today’s laser-cutters ‘I haven’t

    quite figured out where the laser cutter is going to cut on the work piece.’ ‘It’d be nice if I could use my hand-tools the way I used to carpenter manually.’ ‘I don’t really know if I can re-use that already semi-cut piece of acrylic, I’d rather take a new one.’ The above questions raise important concerns about the interface, affordance and efficiency of the present laser cutters. First, to work with laser cutters the users must acquaint themselves with WIMP-based CAD software, a platform with disconnected perception of the main work-piece [Figure 2.15]. In a usual laser-cutting job, the user creates and manipulates the drawing on one computer, sends the file to the computer connected to the laser cutter, opens it on the relevant program, adjusts the settings for the laser cutting, and then finally ‘prints’ it out onto the workpiece. Hence, the novice user finds it difficult to imagine how the laser-cut result will look while working with the CAD software. Present-day laser-cutting systems
  28. are fast and precise, but not as intuitive as hand-tools,

    which require almost no training. Moreover, present day laser cutter interfaces make it hard to engrave on real-world objects because the target position of the engraving is not always corner or center based, and the resulting size is not easy to imagine and visualize on the CAD tool [7]. Running tests to see how the designs look on the work piece takes up both time and material. This can be very frustrating and lead to material wastage. In contrast, when we use hand-tools, we can easily point and locate specific areas on work-piece to engrave/cut where we want. Thus, users face a choice between precision and accuracy when deciding whether to use laser cutters or hand tools. Figure 2.16 shows how the accuracy of placement of engravings is compromised in current laser cutter interfaces. Our system proposes a technique by which the users can directly manipulate their CAD drawings on top of the laser cutter and visualize the cut work-piece before committing to printing; it combines projection on top of the laser cutter panel and the stylus/touch in addition to the ‘residual’ projection on the work piece. Thus, an interactive user interface is realized that enables the programmer to edit the processing coordinates for the laser tool directly on work-piece surfaces. The intermediary of the computer screen is essentially eliminated as digital handling is overlaid onto the material to be cut. This interface, therefore, gives just-in-time visual feedback about the tool-path trajectory. A key motivation is to allow users to get immediate and constant awareness of what they will be cutting to bypass the need of tedious test cuts [Fig. 2.16]. A traditional laser cutter set-up only gives that output after the end of the cutting process.
  29.   Figure 2.16: Proposed Clearcut system   Personal fabrication tools

    such as laser-cutters and milling machines have changed the way people create shapes and precise objects. However, the means to operate a laser cutter is very similar to using a ‘printer’. The user has to use the computer to sketch a path for the laser tool on a WIMP based UI on a traditional computer. The primary idea behind WYSIWYC is to enable direct manipulation on the work piece: 1. The user puts the piece inside the laser cutter and loads his .AI / Vector file which is projected right onto the piece. 2. The user uses touch/stylus input to manipulate schematics onto the panel 3. The leaked projection from the screen falls onto the work-piece, showing the exact path where the laser tool would cut.
  30. 3.1 Implementation The laser cutter panel is covered with a

    transparent diffuser/projection screen from above, the material retains about 60% of the projected light. The panel is made into an interactive screen by using a LLP technique (Figure 2.17). The touch points are tracked and sent to a custom INKScape plugin that maps controls to the laser cutter. 3.1.1 Calibration In our set up, the projection on the actuation layer is ~5% bigger than the projection on the interaction layer. To calibrate we need to manually set the material thickness, the system then compensates for it and calculates the toolpath, such that the residual projection and toolpath coincide. These variables depend on the distance of the projector to the laser cutter and the physical distance between the actuation and interaction layers. In our setup the projector is 1 meter above the interaction layer of the laser cutter. The distance between the interaction layer and actuation layer (without workpiece) is .3m. Figure 2.17: LLP on laser cutter panel
  31. 3.2 Related Work Clearcut builds upon other research in the

    area of augmented design tools. The closest relative to our system is the Visicut project [7], which employs a camera in a laser cutter for WYSIWYG preview and positioning of graphics on objects. However, in Visicut the graphical feedback is shown on the computer monitor rather than the workpiece. In a similar vein, Pictionaire has allowed designers to collaborate and annotate across both physical and digital objects [5]. However Pictionaire doesn’t deal with physical fabrication. Olwal et. al. [1] have also tried to augment CNC machines, however this is only for machining not for CAD design and is focused on industrial machines, not machines for novice users. Another close relative to Clearcut is Constructables proposed by Muller S. et. al [3]. The system lets users use laser pointers to draw and specify the toolpath. However, the system doesn’t offer graphical feedback that would let users visualize the result in real time. The CopyCAD System, introduced by [4] allows extracting shapes of physical objects by scanning a picture, interactive editing of the shapes directly on the object and reproducing an object with the manipulated shapes on a milling machine. Interactions in CopyCAD happen on the same layer as the toolpath. Clearcut addresses to the most subtractive fabrication tools such as laser cutters that have a glass panel for safety purposes. In a usual laser cutting job, the user creates and manipulates the drawing on one computer, then sends the file to the computer connected to the laser cutter, opens it using the relevant application, adjusts the settings for the laser cutting, and then finally ‘prints’ it onto the workpiece. Hence, users find it difficult to imagine how the laser-cut result will
  32. look while working with the CAD software. Present-day laser cutting

    systems are fast and precise, but not as intuitive as hand tools, which require almost no training. Figure 2.18: Carpenters using hand fabrication to work on wood piece   Moreover, present day laser cutter interfaces make it hard to engrave on real-world objects because the target position of the engraving is not always corner or center based, and the resulting size is not easy to imagine and visualize on the CAD tool [1]. Running tests to see how the design looks on the work piece take up both time and material. This can be very frustrating and lead to material wastage. In contrast, when we use hand-tools, we can easily point and locate specific areas on the work piece to engrave/cut where we want. Thus, users face a choice between precision and legibility when deciding whether to use laser cutters or hand tools. 3.3 Advantages of the Clearcut interface Our system proposes a technique by which the users can directly manipulate their CAD drawings on top of the laser cutter and visualize the tool-path trajectory before committing to the actual cutting.
  33. It combines projection on top of the laser cutter glass

    panel and a stylus/touch, in addition to the ‘residual’ projection on the work piece. The intermediary of the computer screen is essentially eliminated as digital manipulation is overlaid onto the material to be cut. A key motivation is to give users constant awareness of what they will be cutting so as to avoid the need for tedious test cuts [Fig. 2.16]. A traditional laser cutter setup only gives that same output at the end of the cutting process. The interface is divided into two layers: an interaction layer and an actuation layer. The interaction layer is where the user uses the stylus and gestures to manipulate his drawings. This layer is the top flat, glass panel of the laser cutter. The second layer is the actuation layer, where the user sees the graphical overlay of the tool path in the form of the residual projection leaked onto the workpiece from the top panel (Fig. 2.19). Tasks Figure 2.19: Interaction and actuation layer
  34. such as modifying an already cut shape are extremely time

    consuming to achieve on a regular laser cutter interface, but become straightforward on the Clearcut system. The following example illustrates how Clearcut can help a user achieve a specific design, which is difficult to accomplish in a traditional setting: We refer to this interaction as WYSIWYC or What You See Is What You Cut. In contrast, in a regular setup the user would have to measure the piece of wood to create a model by measuring dimensions of the square piece of wood, then draw rounded corners, and then cut it on the machine. The latter is a time consuming process, as the user has to go from physical workpiece to virtual WIMP based CAD and then back to workpiece. Reuse/material wastage In addition to its ease of use, a second important advantage of Clearcut is that it prevents material wastage. In current systems users have no initial idea (or inadequate feedback) about the relative mapping of their CAD drawing onto the work piece.   Task: Convert a square piece of wood to rounded corners. 1. Put the square piece of wood on the bed of the cutter to form the actuation layer, 2. On the interaction layer, draw the rounded corners as desired, 3. Check if the projection onto the actuation layer is as intended i.e. the rounded corners are projected onto the work piece as desired (Fig 5b) 4. Execute the cut. Result: The Square is modified to rounded edges
  35.                   Partially

    cut wood pieces are often trashed when the user cannot accurately visualize whether the desired shape will fit in the free space of the wood. For example, Figure 2.20 shows a lot leftover from the cut and it has potential for re-use but placement of the new cut may be difficult. Clearcut’s system, through the residual projection on the work piece, allows users to make more efficient use of material. By also increasing the ability to visualize cut placement, it reduces or even eliminates the need for numerous test cuts as well. 3.4 Interactions The user draws and aligns the shape to be cut on the top panel and sees the ‘result’ through the secondary projection on the base workpiece (wood/acrylic, etc). The ratios of calibration are set such that the tool path aligns to the secondary projection on the workpiece. Figure 2.20: Using residual projection to fit a circle between the pre-used material Figure 2.21: a) Drawing on laser cutter and projection on piece b) Toolpath aligns to projection on workpiece
  36. 3.4.1 Cloning 2D artifacts a) Copy physical designs We propose

    interactions that will allow users to design by example by showing the computer an object or shape they want to borrow from the real world and where to put it in their current design. By shortening the loop, users can quickly base designs off of real world objects, bring in other parts, and edit them. This type of ‘remixing’ has generally existed for only temporal media such as video or audio; we seek to expand it to physical objects for fabrication. (Figure 2.22) b) Etching The precision of the scan is one of the major concerns in this case, but by using Kalman- filtering algorithms we can approximate the edges. The copied model is vector based, hence refined changes could be made to it before cutting. A picture put on top of the surface can be instantly traced as a raster and used for etching. This significantly reduces time and effort while ‘copying’ real world objects for the laser cutter (Figure 2.23). Figure 2.22: (a) Physical laser-cut designs (b) Virtually copied onto workpiece ready for interaction (rescaling etc.) Figure 2.23 Scanning a physical drawing and extracting it. Then projection of the extracted raster is etched  
  37. 3.4.2 WYSIWYC - What You See Is What You Cut

    The basic idea of the system is to reduce the gap between the tool-path and the virtual CAD design. This system fuses the two together so that, in fact, what you see (on the screen) is what you cut (on the work-piece) (Figure 2.24). The goal is achieved through the residual projection (onto the actuation layer) of the screen onto the work piece, which is calibrated to accurately reflect the path of the laser. As discussed earlier, this direct visualization results in more efficient use of both time and material. 3.4.3 Hand tools Hand tools are one of the major differentiators in manual fabrication and laser cutters. The Clearcut system supports the use of hand tools with the laser cutter so that the user may access the flexibility and dexterity of these tools while laser-cutting the work-piece. For example, the user may choose to use the stylus to draw a shape to be cut, or as shown in Figure 2.21, use measuring tools to correct proportions. Figure 2.24: a) User hand-drawing schematic b) Laser cutter tool follows the residual projection on actuation layer
  38. Figure 2.21: Using a Calliper to measure on top of

    the CAD 3.4.4 Glass panel affordance Though we initially perceived the laser cutter’s glass cover as a design problem, it became one of the key elements in creating the design of our system. By allowing users to rest their body weight on the glass, it permits users to get closer to the work-piece   without interfering with the laser cutter. Furthermore, the ability to use hand tools on the glass while drawing adds substantial stability to the drawing process, making the interaction more precise.    
  39. 3.4.5 Limitations and future work Figure 2.22: Collimating lens with

    projection reducing the light dispersion One major improvement that we want to make with Clearcut is to have interaction and actuation layer projections the same size. This is achievable by introducing a Fresnel optical lens in front of the projector. This would lead to having projections on actuation and interaction layers of the same size. Another technical limitation is that projections on interaction layer and actuation layer will never line up due to parallax. However, this limitation doesn’t affect the user- experience. Our system can be extended to any CNC based fabrication process with slight modification e.g. Shopbot, PCB milling machines etc. are fabrication machines with a need for more efficient and direct user interface. 4.1 Proposed side projects
  40. In my side/future work I plan to conduct several experiments

    exploring other use-cases across disciplines for transparent displays. 4.1.1 Augmented Fish Tank/Collaboration with CityScience lab We’re working on designing a fish-tank whose front panel is transparent display rather than regular glass. Such a system will preserve the normal functioning and aesthetics of the aquarium and also augment graphics based on the motion of fish. Figure 2.23: 1. Aquarium 2. Tracking cameras 3. Transparent Display One camera looks at the flow of the fish in the tank, and other looks at user’s head position [Figure 2.23]. Accordingly the user would see graphical trails on the display, merging the real world with virtual. The see-through LCD panel will be backlit from a fluorescent panel that’s behind the aquarium body, illuminating the tank and the display at the same time. 4.1.2 Electronics bench A traditional electronics bench just magnifies the circuit the user is looking at. What if it could also serve as just-in-time reference for the person working on a circuit (Figure 2.24). Live schematics of the parts are augmented in real-time on the magnifying glass, giving a virtual layer of information about the work-piece, such as circuit/PCB in this case. I
  41. would collaborate with Boardlab team from Responsive Environments group [20]

    for this use-case.    This could also be used to give live diagnostics – putting oscilloscope traces over components. Figure 2.24: T.- Transparent display + magnification C.- Circuit 4 Discussion and Lessons learnt Unlike regular opaque displays, transparent displays allow a better merger of real world and digital information. Most experiments that we discussed above are ideal for 2-D interfaces and can be utilized by UX designers. Researchers are steadily moving forward by proposing new use-case scenarios of spatial augmented reality using transparent displays, Primary challenge in designing transparent interfaces for augmentation of the real world is having transparent displays to be able to overcome the problem of binocular parallax i.e. For transparent screens, the screen itself (and therefore the image) can never take up exactly the same space within the environment due to parallax. Research needs to be done able to design active stereoscoping transparent displays that can augmented information based on the depth of the real object. Figure 2.25 shows a real tree which
  42. needs to be augmented with a virtual human on transparent

    display. However, human eye can focus on one plane at one time. In future we would have transparent displays that have stereo capabilities so that digitally augmented graphics could free themselves from the bound of transparent screens. Figure 2.25: Binocular displarity with transparent displays   Another major design consideration with transparent displays in a spatial 3D environment is that they require to be head and eye tracked for correct augmentation on the scene. This limits present day transparent displays to being single-user interfaces because a display can augment the scene for one eye position at one time. Solution to this problem requires full-parallax light field displays utilizing an array of micro projectors, each of which acts as a single pixel. Full 3D parallax at a resolution of 640x480, however, would require 300,000 projectors; a resolution of 1920x1080 would require 3 million of them. This is only possible in complex research settings and will take a while to be industrialized. With Joel Jurik, Debevec has created a theoretical prototype for such setup.
  43. Figure 2.26: Binocular displarity with transparent displays display utilizing an

    array of micro projectors, each of which acts as a single pixel [Jurik et al.]. Each of the discussed systems have shown that the addition of a small amount of computation, and replacing glass with transparent displays in the right area can help us create richer and less intrusive user interfaces, revealing more about the magical secrets of the real world around us.
  44. References 1. Olwal A, Gustafsson J, Lindfors C. Spatial augmented

    reality on industrial CNC-machines. In: The Engineer-ing Reality of Virtual Reality 2008. San Jose, CA, USA. 2. Zhang J, Ong SK, Nee AY. Development of an AR sys- tem achieving in situ machining simulation on a 3-axis CNC machine. In: CAVW.Vol 21.; 2010:103-115. A 3. Mueller, S., Lopes, P., and Baudisch, P. Interactive construction: Interactive fabrication of functional mechanical devices. Proc. UIST 2012. 2012, 599–606. 4. Follmer, Sean, et al. "CopyCAD: remixing physical objects with copy and paste from the real world." UIST. ACM, 2010. 5. Hartmann, Björn, et al. "Pictionaire: supporting collaborative design work by integrating physical and digital artifacts." Proceedings of the 2010 ACM conference on CSCW. ACM, 2010. 6. Capturing and interacting with design history. In Proc. CHI 2002, ACM Press (2002), 7. Oster, Thomas. "Visicut: An application genre for lasercutting in personal fabrication." RWTH Aachen Univ (2011). 8. Elliott, Ame, and Marti A. Hearst. "A comparison of the affordances of a digital desk and tablet for architectural image tasks." International Journal of Human- Computer Studies 56.2 (2002): 173-197.
  45. 9. Spindler, Martin, and Raimund Dachselt. "PaperLens: advanced magic lens

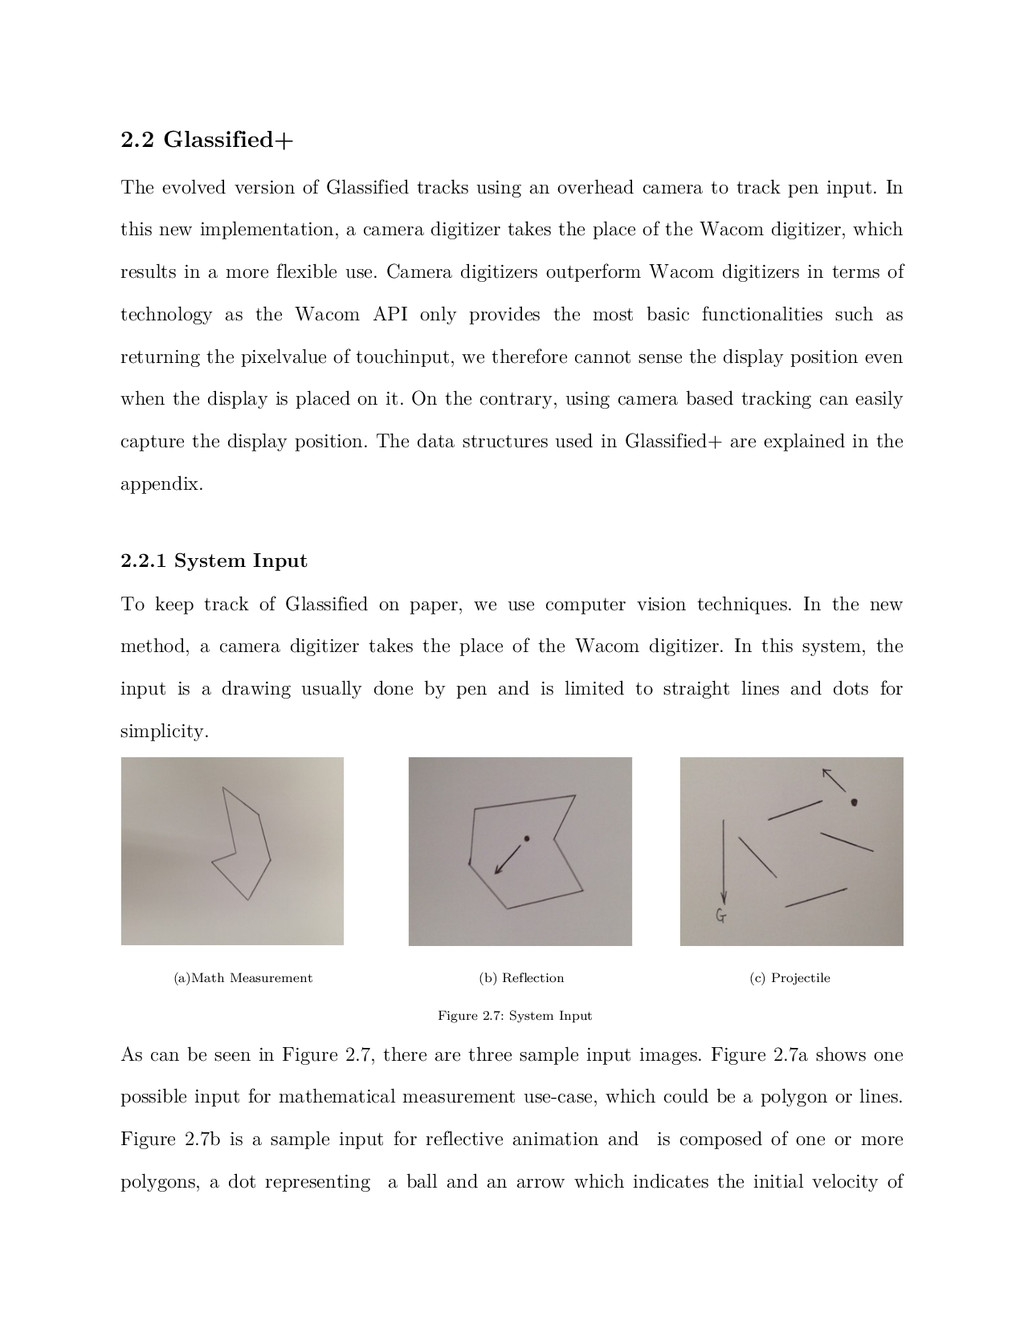
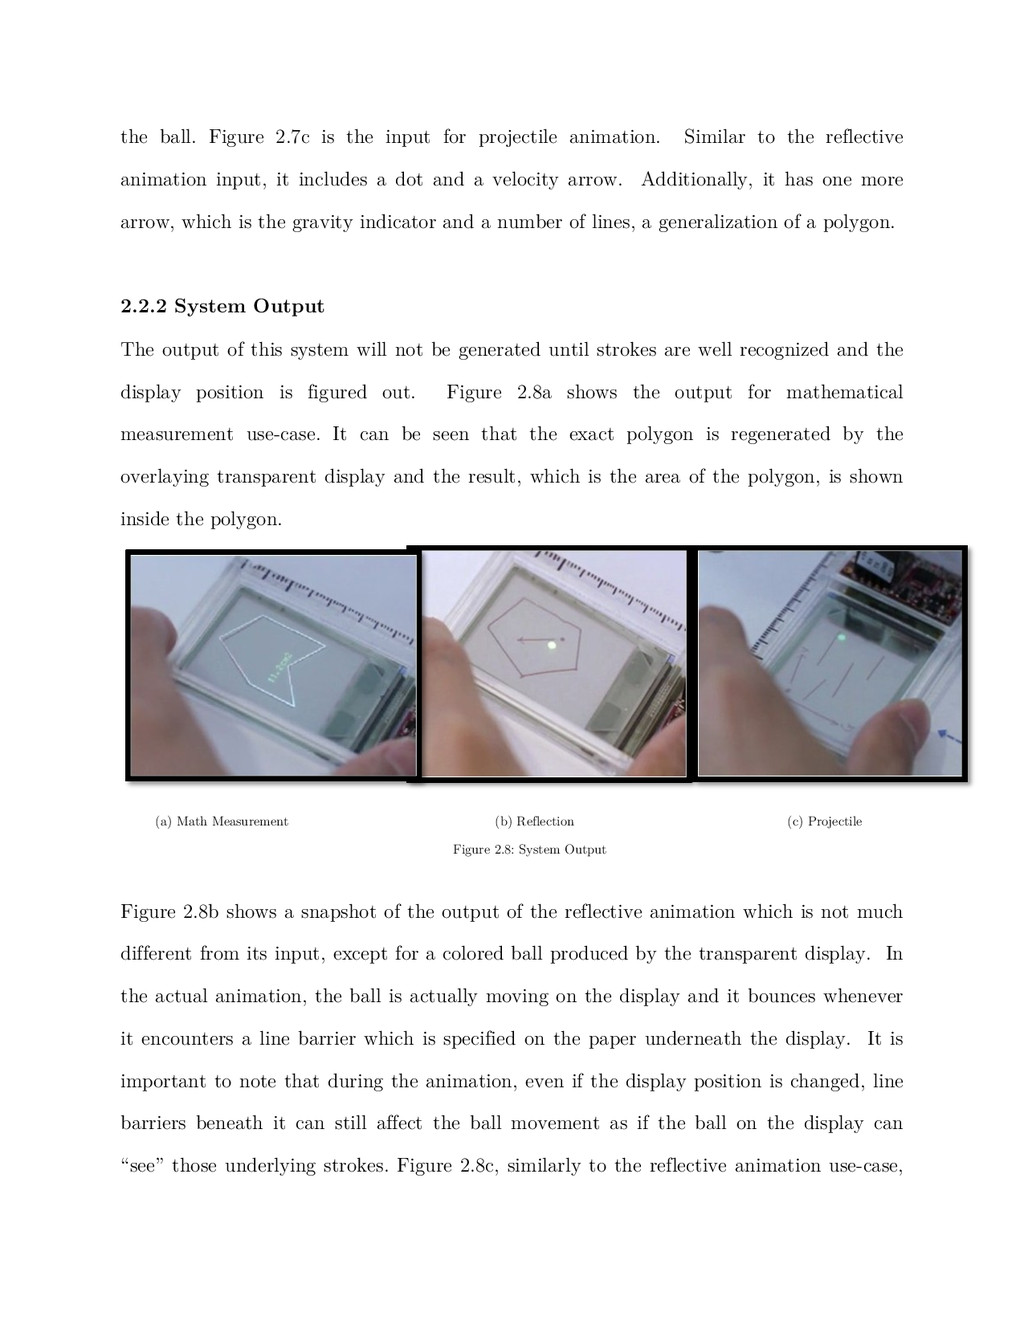
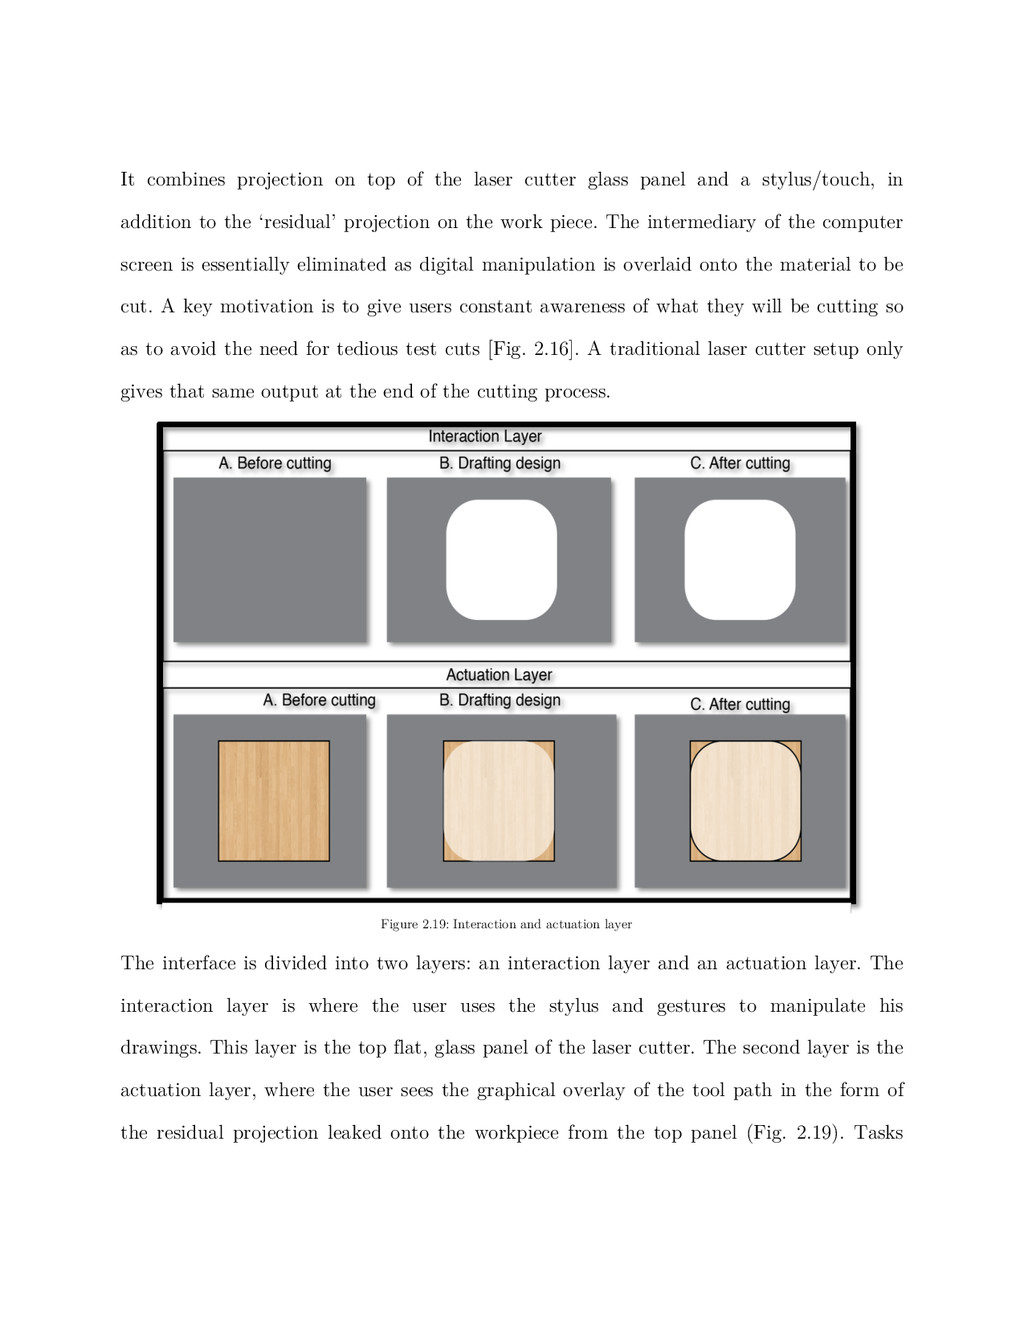
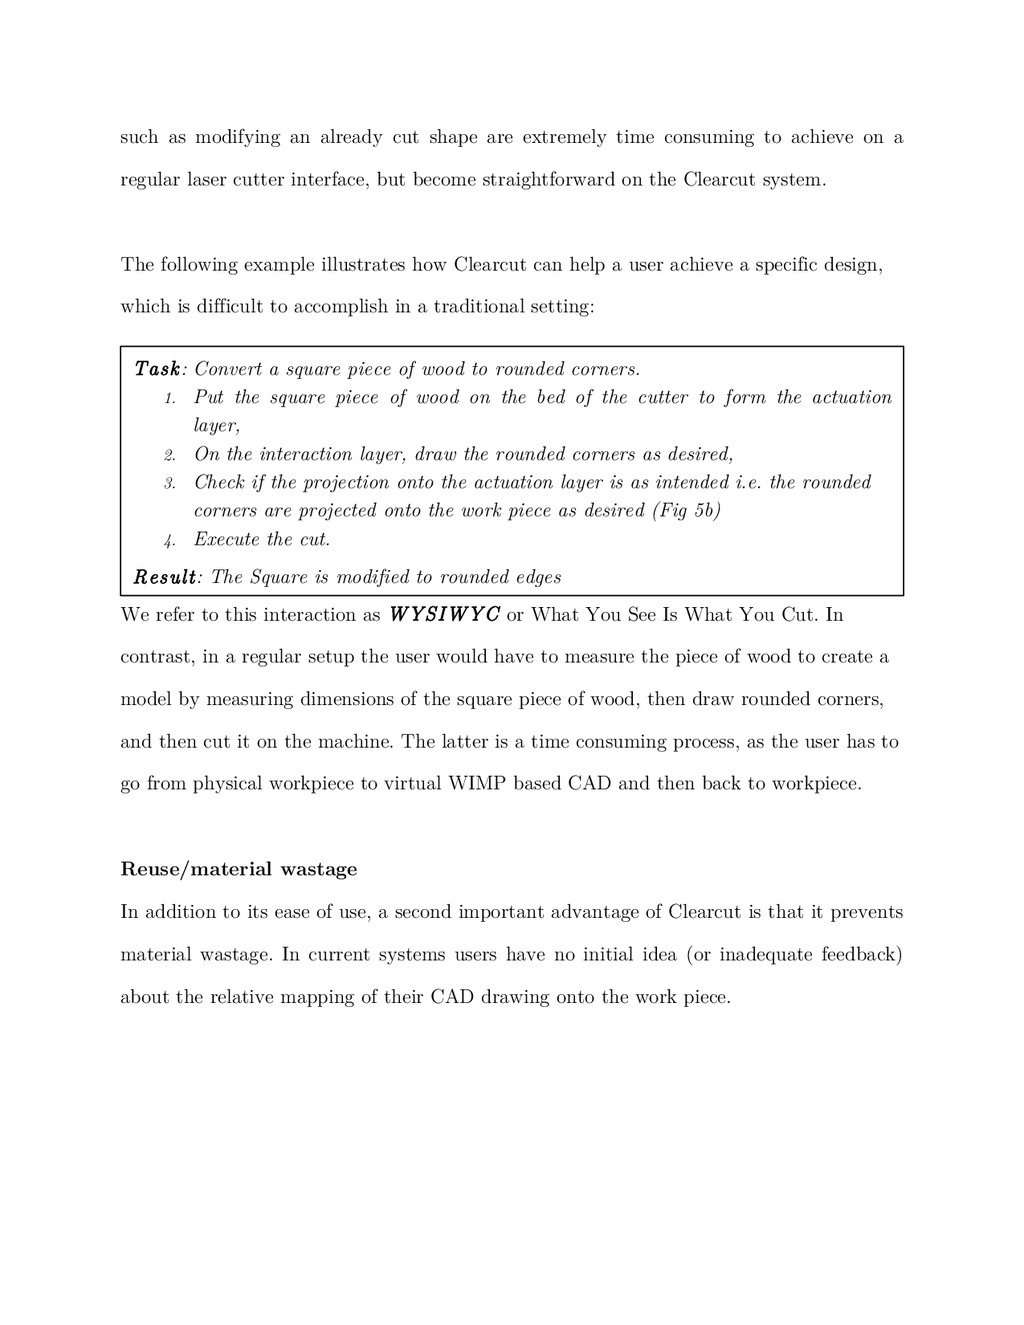
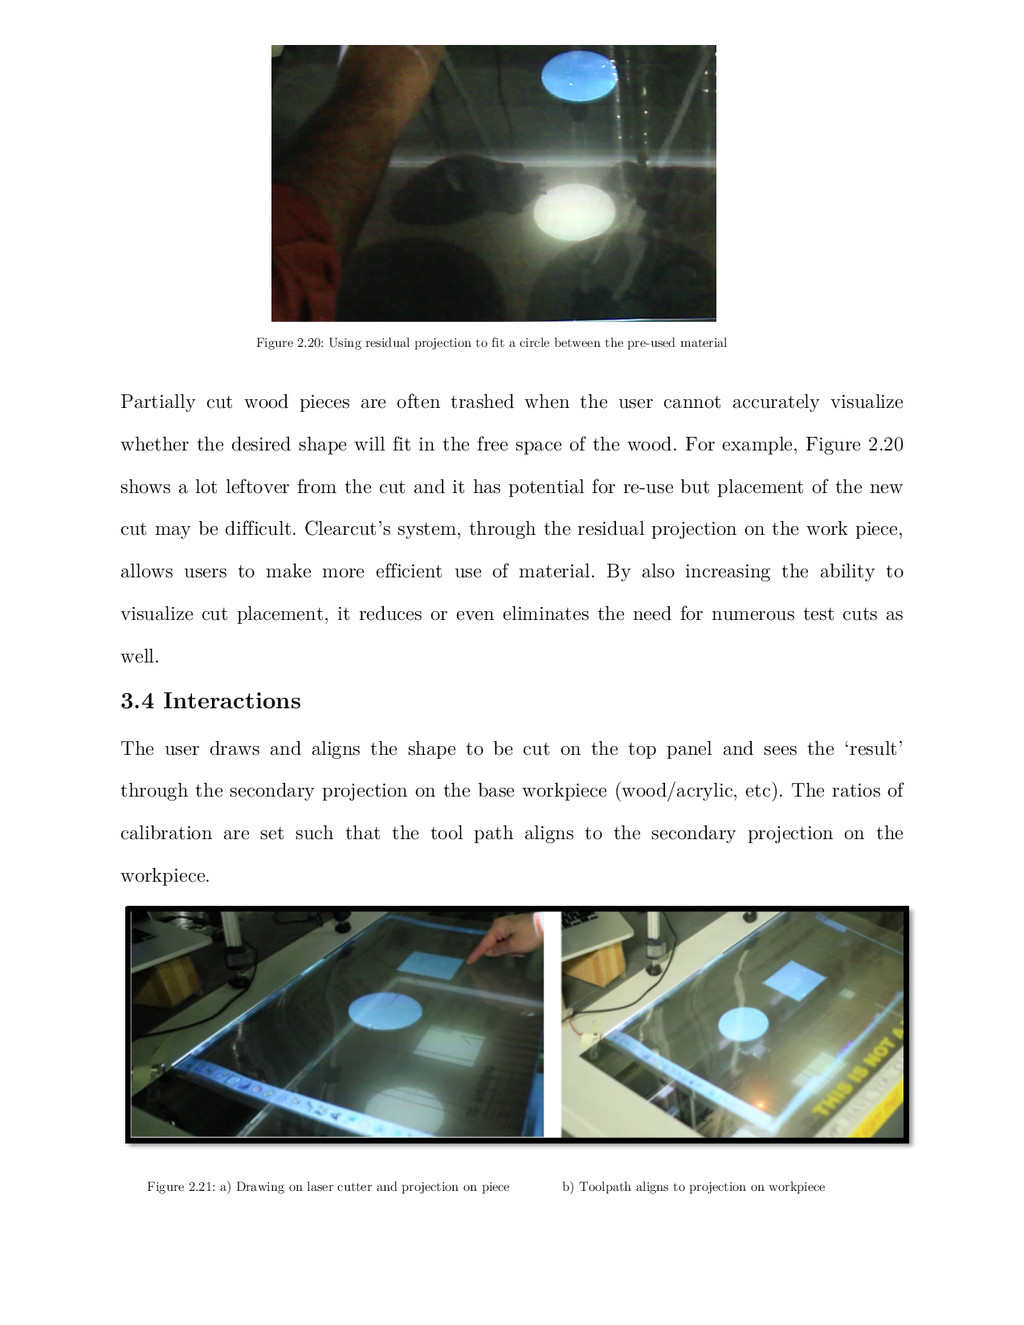
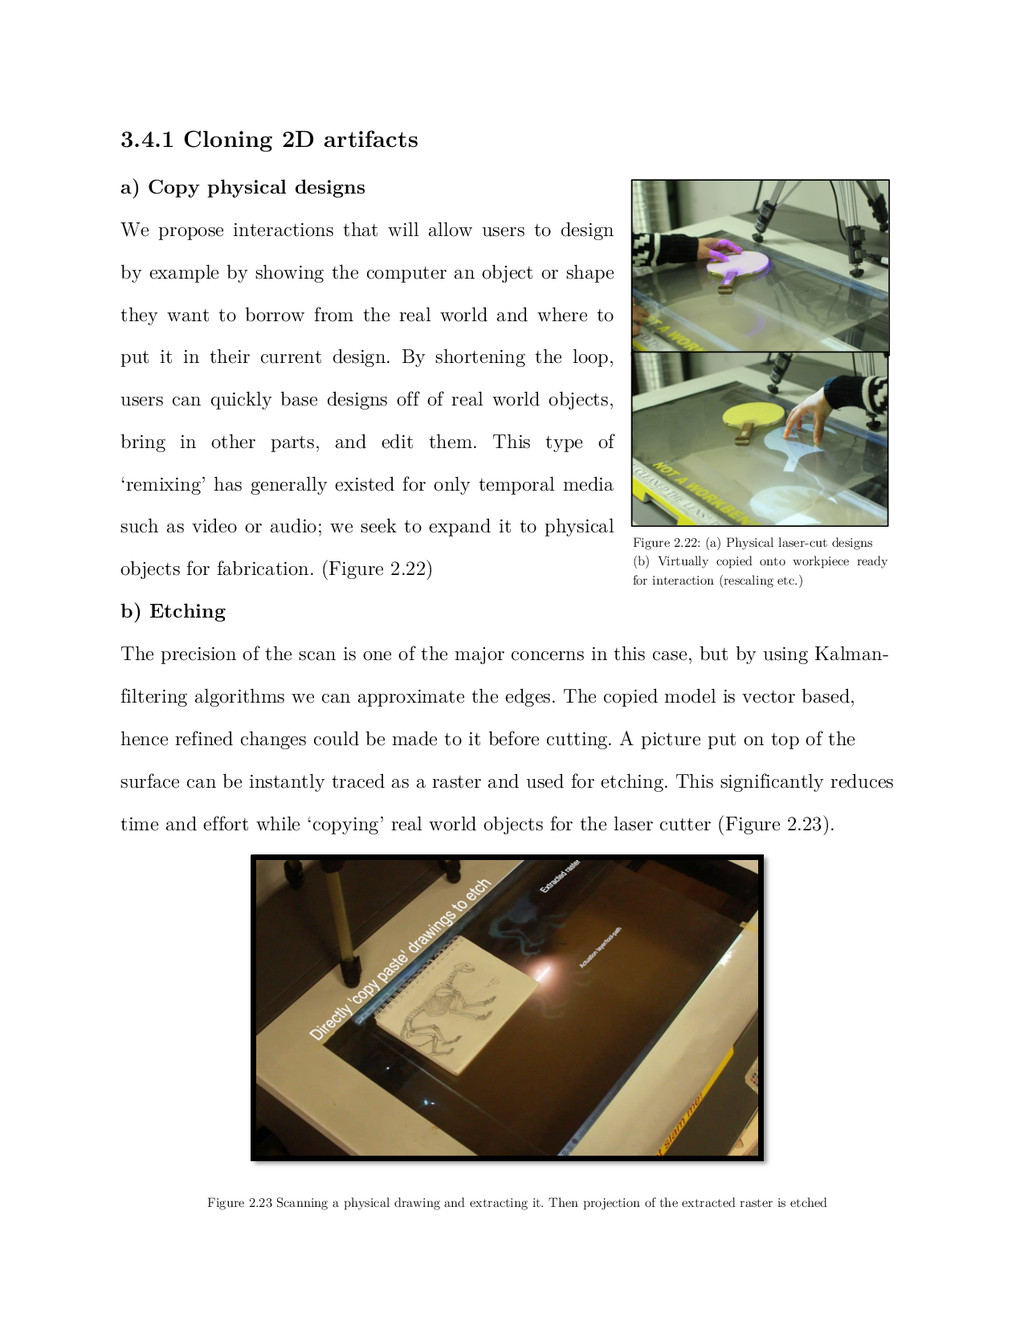
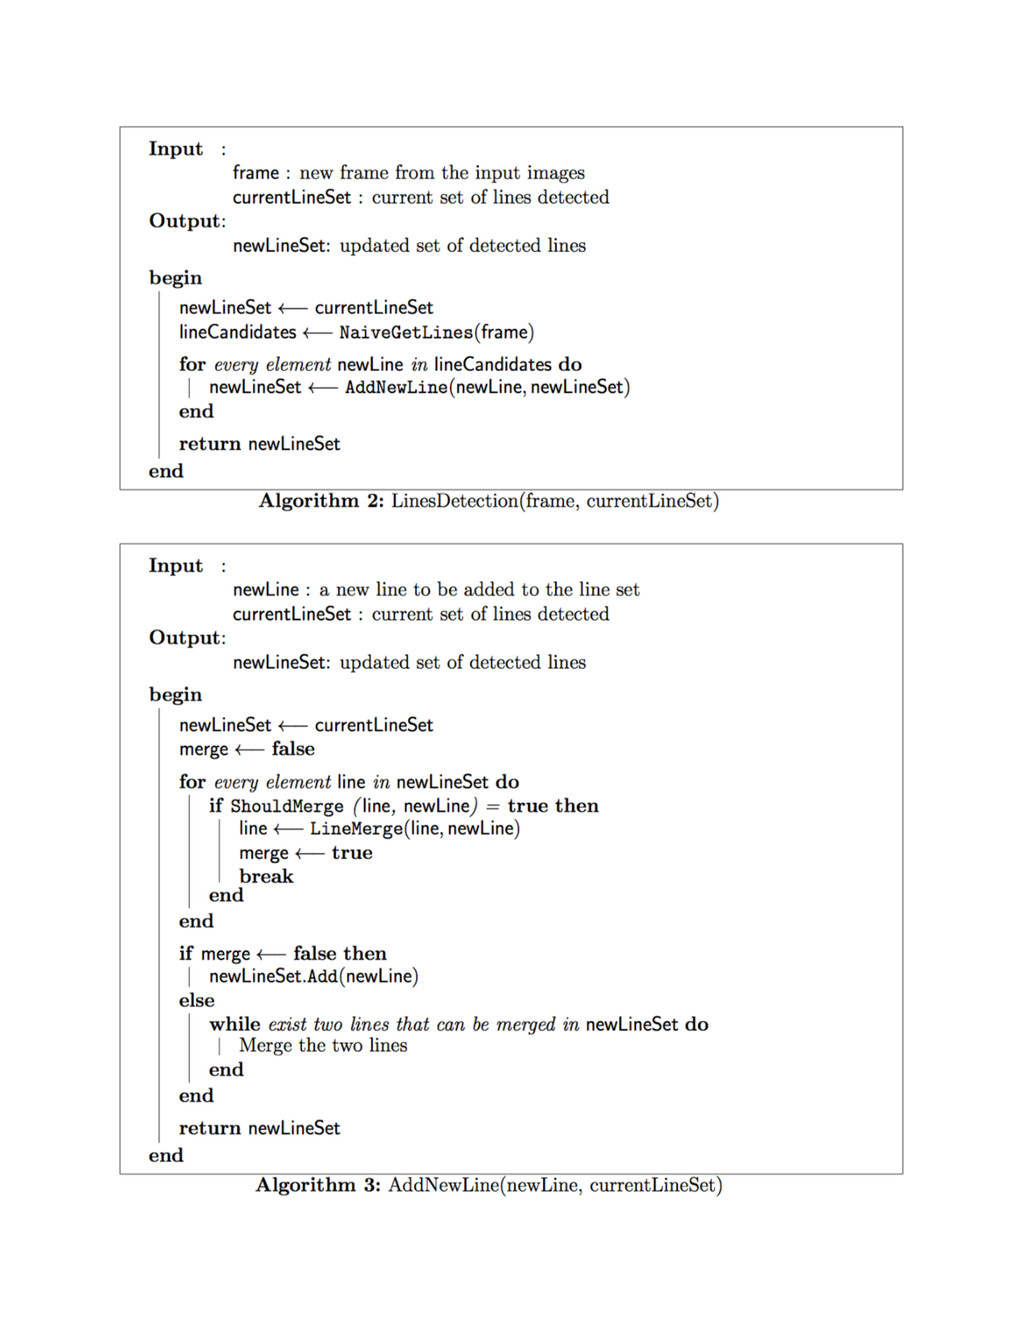
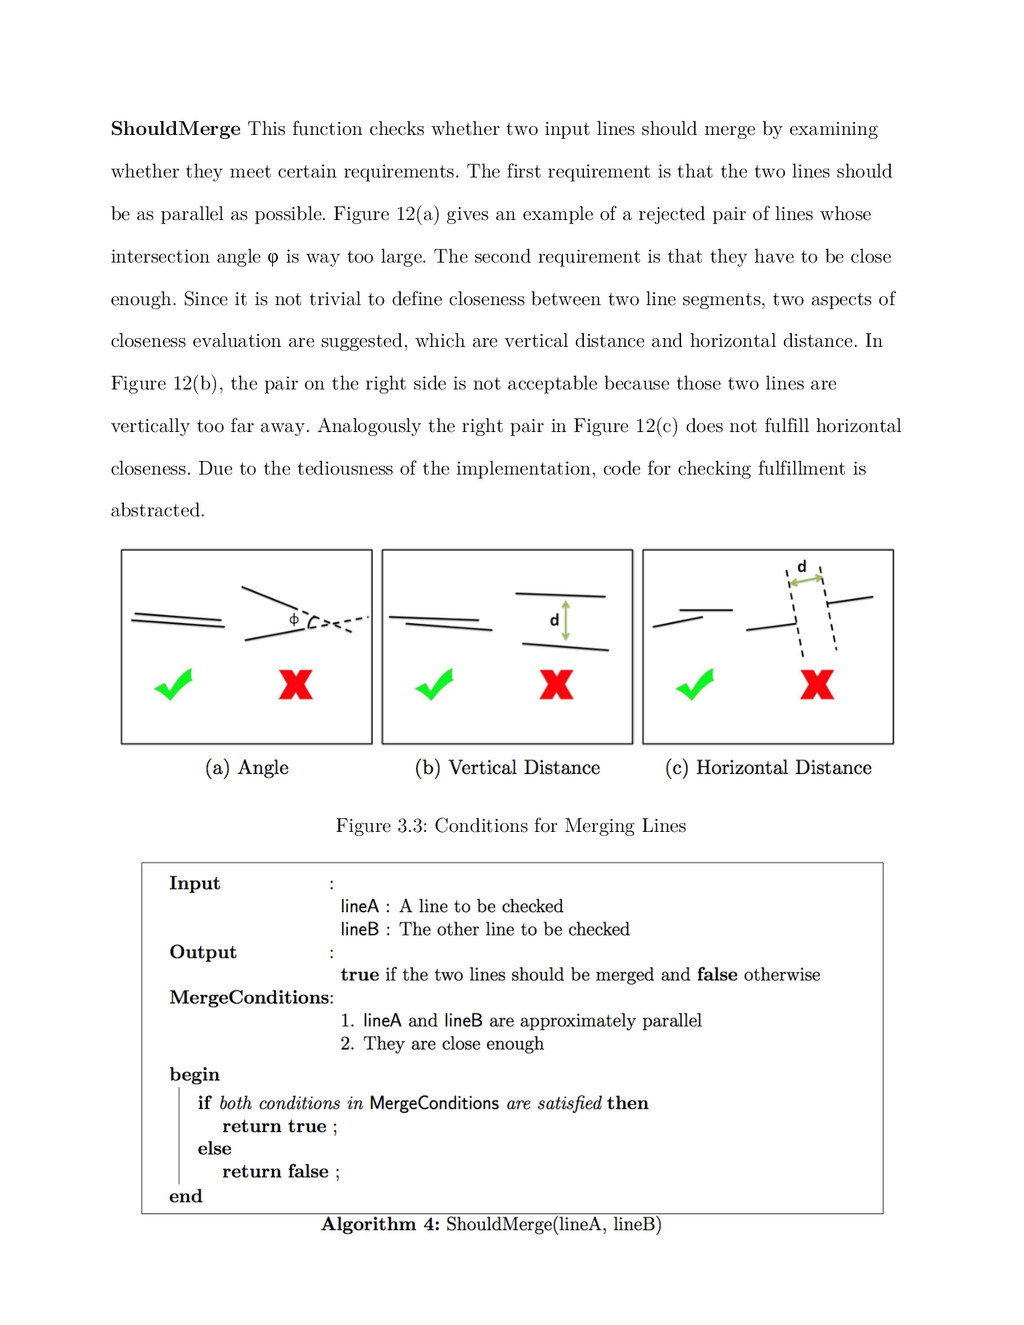
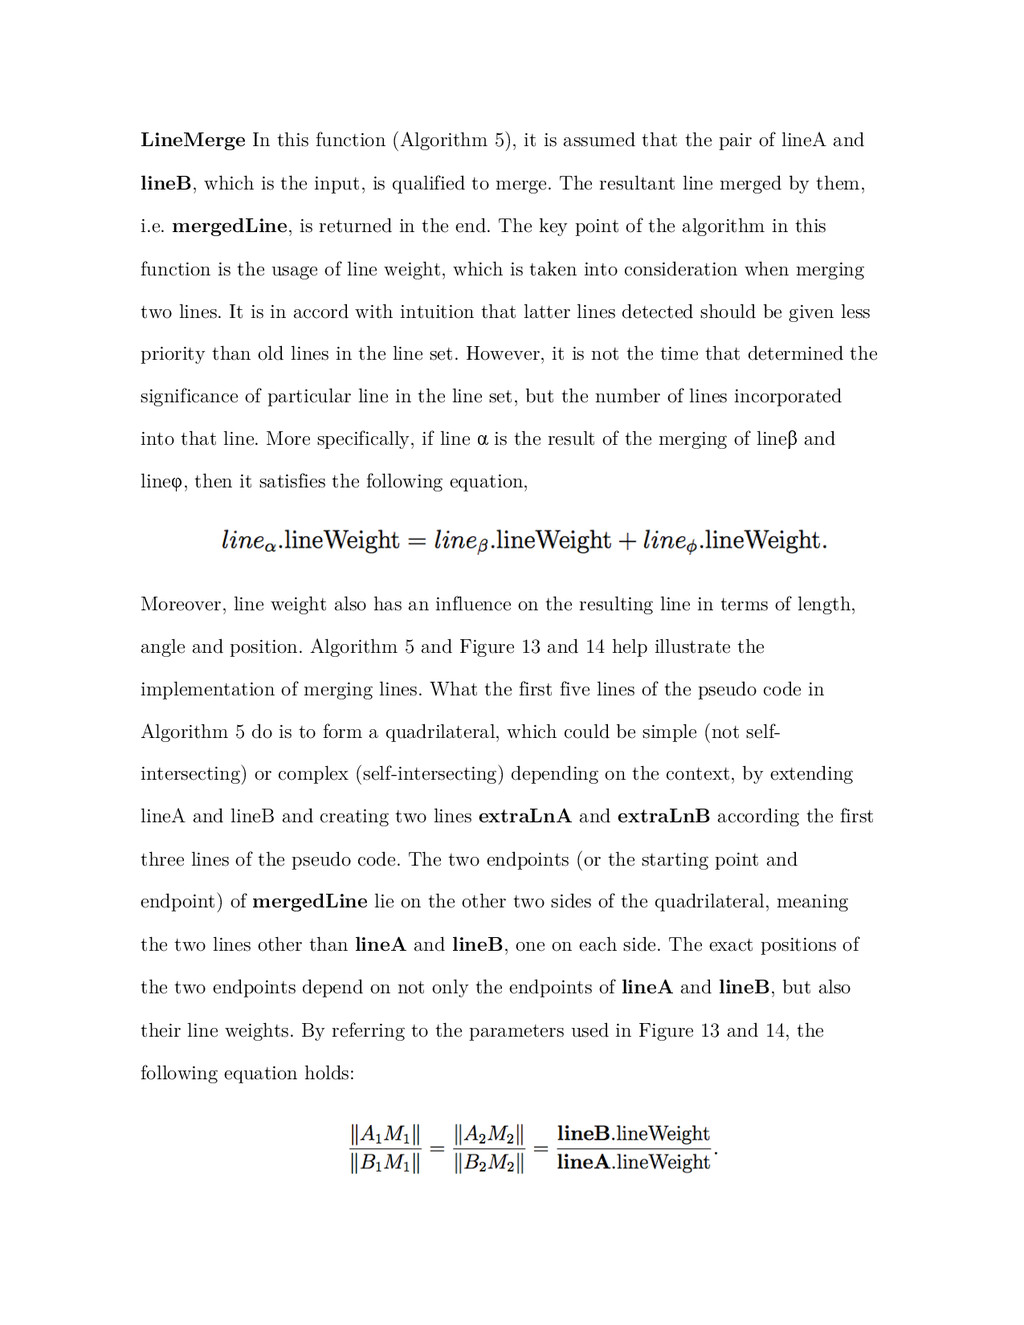
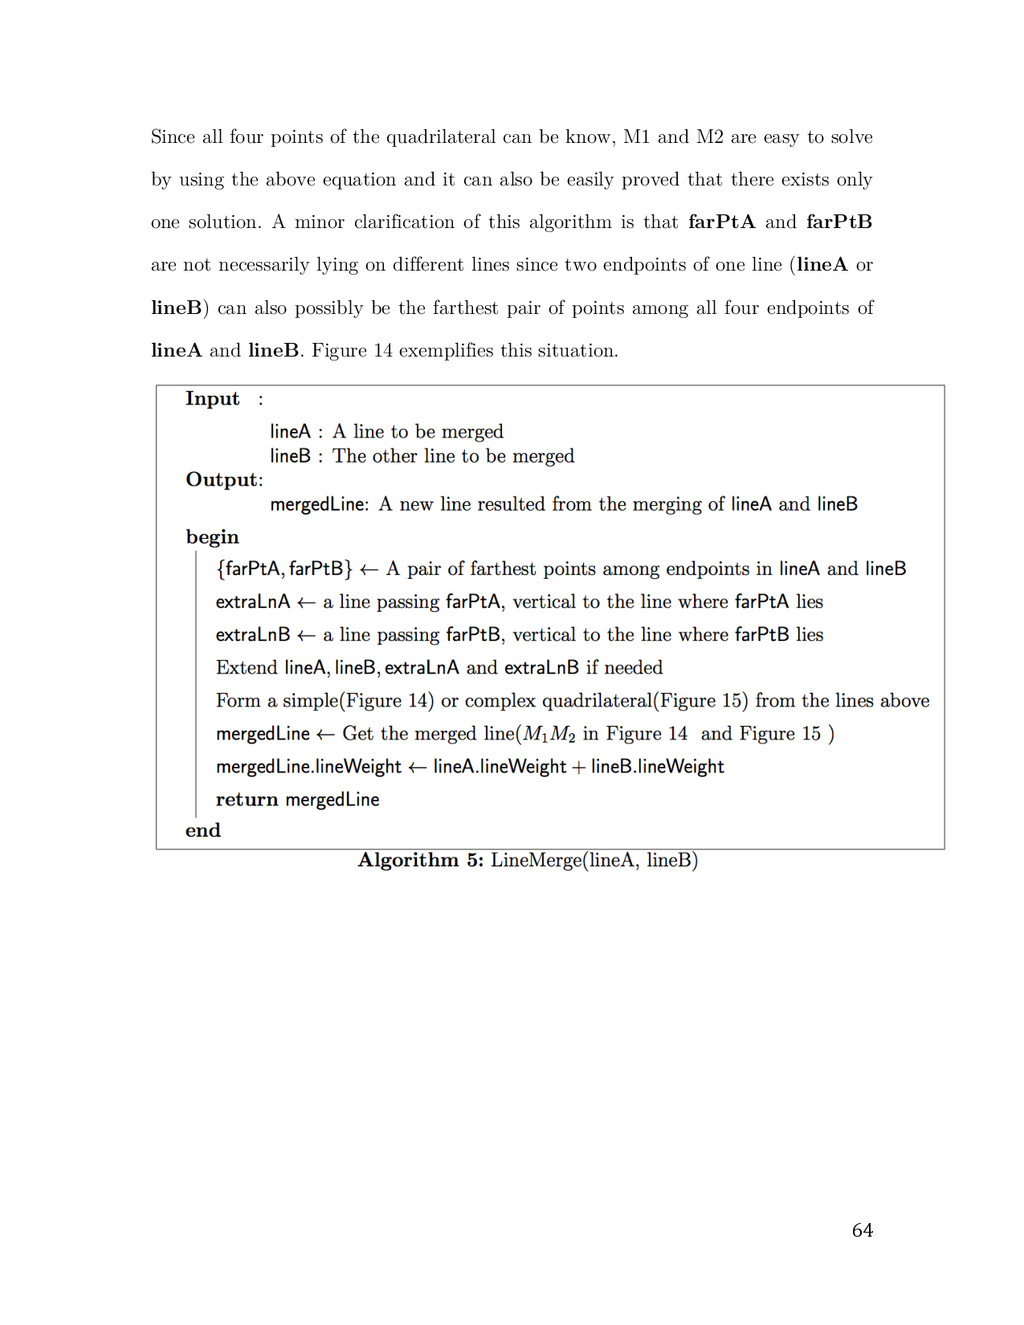
    interaction above the tabletop." Proceedings of the ACM International Conference on Interactive Tabletops and Surfaces. ACM, 2009. 10. Izadi, S., Hodges, S., Taylor, S., et al.: Going beyond the display: a surface technology with an electronically switchable diffuser. In: Proc. of UIST 2008, pp. 269–278. ACM, New York (2008) 11. Bier, E.A., Stone, M.C., Pier, K., Buxton, W., DeRose, T.D.: Toolglass and magic lenses: the see-through interface. In: Proc. of SIGGRAPH 1993, pp. 73–80. ACM, New York (1993) 12. Looser, Julian, Mark Billinghurst, and Andy Cockburn. "Through the looking glass: the use of lenses as an interface tool for Augmented Reality interfaces." Proceedings of the 2nd international conference on Computer graphics and interactive techniques in Australasia and South East Asia. ACM, 2004. 13. Rekimoto, Jun. "A Magnifying Glass Approach to Augmented Reality Systems." Presence 6.4 (1997): 399-412. 14. Andrew, D.W. TouchLight: an imaging touch screen and display for gesture-based interaction. Proc.ICMI2004, ACM Press (2004), 69-76. 15. Lee, J., Olwal, A., Ishii, H. and Boulanger, C. SpaceTop: Integrating 2D and Spatial 3D Interactions in a See-through Desktop Environment. Proc.CHI2013, ACM Press(2013),189-192 16. NTT Docomo, Transparent double-sided touchscreen display, Wireless Japan 2012. 17. Samsung, Transparent OLED Display, CES2010 18. Sanden Vending System Corporation, Transparent vending machine. http://www.sanden.co.jp/
  46. 19. Heo, Heejeong, et al. "Transwall: a transparent double-sided touch

    display facilitating co-located face-to-face interactions." CHI'14 Extended Abstracts on Human Factors in Computing Systems. ACM, 2014. 20. Goyal, Pragun, et al. "BoardLab: PCB as an interface to EDA software."Proceedings of the adjunct publication of the 26th annual ACM symposium on User interface software and technology. ACM, 2013. 21. Novy, Daniel E. (Daniel Edward) Computational immersive displays / by Daniel E. Novy. c2013. Institute Archives - Noncirculating Collection 3 | Thesis MediaA&S 2013 S.M. 22. Kiyokawa, Kiyoshi, Yoshinori Kurata, and Hiroyuki Ohno. "An optical see-through display for mutual occlusion of real and virtual environments." Augmented Reality, 2000.(ISAR 2000). Proceedings. IEEE and ACM International Symposium on. IEEE, 2000. APA 23. K. Kiyokawa et al., “Collaborative Immersive Workspace through a Shared Augmented Environment,” Proc. Int’l Soc. for Optical Eng. (SPIE 98). 24. Linder, Natan, and Pattie Maes. "LuminAR: portable robotic augmented reality interface design and prototype." Adjunct proceedings of the 23nd annual ACM symposium on User interface software and technology. ACM, 2010. 25. Wellner, Pierre. "Interacting with paper on the DigitalDesk." Communications of the ACM 36.7 (1993): 87-96. 26. Back, Maribeth, et al. "Listen reader: an electronically augmented paper-based book." Proceedings of the SIGCHI conference on Human factors in computing systems. ACM, 2001
  47. Appendix Data Structures and Variables for Glassified+ Before we dig

    into the code, it is appropriate to introduce the most fundamental elements for the code, data structures and variables. Data Structure: LINE The only data structure that should draw the attention is the structure to store lines. Apart from the starting point and end point of the line, one more variable, which is lineWeight (initialized to be 1 at the beginning), is kept as is shown in Figure 10. The reason behind it will be explained in later subsection. Note that all line variables used in this section are based on LINE structure. The major variables used include environmentInfo, lineSet, displayPosition, ballPositionInCam and ballPositionOnDisplay. environmentInfo It is a collection of parameters related the environment where the ball is moving. It contains lineBarriers, which can be thought of as what can make the moving ball bounce back. Users can specify line barriers on their own when drawing input. ballVelocity is the velocity of the moving ball, which is updated at every frame. Note that the initial velocity is specified by drawing an arrow whose tail is
  48. pointing to the ball. gravity indicates the gravity vector that

    can affect the motion of the ball all through the animation process. lineSet: All three parameters in environmentInfo are determined by lineSet that stores all the straight lines in the input image no matter they are arrows (indicators for initial velocity and gravity) or pure lines. Obtaining the accurate line set is one of the most crucial part of the whole system. Variables for Display and Ball Positions The remaining three variables are all related to positions. displayPosition can be understood as an array of four line elements which correspond to four sides of the effective displaying area of the transparent display. It is necessary to take the display position into account in order to keep the animation aligned with the input. In addition, the ball position is also a primary element and there are two variables related to it. ballPositionInCam stores the position of the ball in head camera’s view while ballPositionOnDisplay is the corresponding ball position on the transparent display.
  49. 3.2.2 Overview of the Code FOR WHICH SYSTEM? Algorithm 1

    reveals the skeleton pseudo code for the system. Without doubt, it is consistent with the system architecture covered in previous section. Note that by convention, names starting with capital letters are function names while names that begin with lowercase letters are variable names. GetNewFrame This function grabs the data of a new frame in camera. No further explanation is needed for it because OPENCV library provides various kinds of functions of do it. DetectBallPosition At the very beginning of the pseudocode, ball position is detected right after getting a new frame from the camera. One simple way to achieve ball position detection is to firstly design a sliding window, for example with size 5 by 5, then center the window over every pixel on the input image calculating the sum of pixel values inside the window and finally find the minimum. The window that generates the minimum sum is likely to have been placed where the ball is located because pixels near the ball position tend to be darker than others thus giving a smaller sum. LinesDetection This function extracts lines from the input image with great robust- ness. However, it is hard to explain in one or two sentence. Thus, it is discussed in later subsection. GetInitialEnvironmentInfo It is a function that can retrieve the environment parameters out from lineSet. Given that line set is perfectly produced, it is trivial to gather environment information. For this reason, this function is not explained in detail in this report.
  50. GetDisplayPosition What follows next is the animation/rendering stage as shown

    in Figure 7, where display and ball positions are updated at each iteration of the loop. Note that the function GetDisplayPosition is realized by exploiting the features of the transparent display such as clear display edges and almost perfect rectangular shape. UpdateBallPosition At every frame of the animation, ballPositionInCam is up- dated through the function, UpdateBallPosition, which takes ballPositionInCam itself and environmentInfo as the arguments. In this function, if the ball does not encounter any line barrier, it just simulates projectile motion in physics in accord with Newton’s Second Law of Motion. On the other hand, when the ball is about to hit a line barrier, just update the velocity following rules of reflection with damped energy if specified beforehand. PixelMapping After the ball position in camera view is obtained, it is also necessary to map it to the position on the transparent display, i.e. ballPositionOnDisplay. There- fore PixelMapping is implemented to do the task. It is intuitive that two parameters, displayPosition and ballPositionInCam, are needed to get ballPositionOnDisplay. Some rules of perspective are applied to solve this problem and more detail is explained in later subsection. SendDataToDisplay Finally, it is ready to send the data needed for displaying graph- ics, in this case it is ballPositionOnDisplay, to the transparent display via serial communication. The function, SendDataToDisplay, is an abstraction of triggering the communication between C++ program and the transparent display.
  51. More detail of some key functions is explicated in the

    following subsections. 3.2.3 A more Robust Line Detection Algorithm In this subsection, a more robust algorithm for detecting lines is dissected. This algorithm is designed upon already existing functions in OPENCV library. Function Dependency First of all, there exist function dependency inside the implementation of this algorithm and it is outlined in Figure 11. All four components are explicated later in this subsection. It is important to note that component A points to component B if B is functionally dependent on A. Figure 3.2: Function Dependency For Line Detection
  52. LinesDetection Algorithm 2 reveals the pseudocode of the outer structure

    of this algorithm. It takes a frame of the input image and the current line set as input and outputs an updated set of detected lines. Note that NaiveGetLines basically gets lines using OPENCV built-in functions such as CvCanny and CvHoughLines2, which has proven to be unreliable. But anyway, it does return a set of lines which are collected in lineCandidates for further refinement. As for the forloop, it takes out every element in lineCandidates, then passes it to AddNewLine. After the loop, a new line set is returned. AddNewLine As is illustrated in Algorithm 3, the input of this function consists of a new line to be added to the set and the current line set. What it outputs is an updated set of lines, similar to linesDetection. Roughly speaking, inside this function, the new line is firstly checked whether it can be merged to any line in currentLineSet. If it can, merge them. Add it directly to currentLineSet otherwise. Some conditions, which are specified in following paragraphs, have to be satisfied for merging the new line with some already existing line in the set. Note that there is a while loop in the end, whose function is to merge the line pair inside newLineSet.  
  53. ShouldMerge This function checks whether two input lines should merge

    by examining whether they meet certain requirements. The first requirement is that the two lines should be as parallel as possible. Figure 12(a) gives an example of a rejected pair of lines whose intersection angle φ is way too large. The second requirement is that they have to be close enough. Since it is not trivial to define closeness between two line segments, two aspects of closeness evaluation are suggested, which are vertical distance and horizontal distance. In Figure 12(b), the pair on the right side is not acceptable because those two lines are vertically too far away. Analogously the right pair in Figure 12(c) does not fulfill horizontal closeness. Due to the tediousness of the implementation, code for checking fulfillment is abstracted. Figure 3.3: Conditions for Merging Lines
  54. LineMerge In this function (Algorithm 5), it is assumed that

    the pair of lineA and lineB, which is the input, is qualified to merge. The resultant line merged by them, i.e. mergedLine, is returned in the end. The key point of the algorithm in this function is the usage of line weight, which is taken into consideration when merging two lines. It is in accord with intuition that latter lines detected should be given less priority than old lines in the line set. However, it is not the time that determined the significance of particular line in the line set, but the number of lines incorporated into that line. More specifically, if line α is the result of the merging of lineβ and lineφ, then it satisfies the following equation, Moreover, line weight also has an influence on the resulting line in terms of length, angle and position. Algorithm 5 and Figure 13 and 14 help illustrate the implementation of merging lines. What the first five lines of the pseudo code in Algorithm 5 do is to form a quadrilateral, which could be simple (not self- intersecting) or complex (self-intersecting) depending on the context, by extending lineA and lineB and creating two lines extraLnA and extraLnB according the first three lines of the pseudo code. The two endpoints (or the starting point and endpoint) of mergedLine lie on the other two sides of the quadrilateral, meaning the two lines other than lineA and lineB, one on each side. The exact positions of the two endpoints depend on not only the endpoints of lineA and lineB, but also their line weights. By referring to the parameters used in Figure 13 and 14, the following equation holds:
  55.     64   Since all four points of the

    quadrilateral can be know, M1 and M2 are easy to solve by using the above equation and it can also be easily proved that there exists only one solution. A minor clarification of this algorithm is that farPtA and farPtB are not necessarily lying on different lines since two endpoints of one line (lineA or lineB) can also possibly be the farthest pair of points among all four endpoints of lineA and lineB. Figure 14 exemplifies this situation.
  56.     65   Figure 3.4: Example I for Merging

    Lines (Simple Quadrilateral) Figure 3.5: Example II for Merging Lines (Complex Quadrilateral)
  57.     66   3.5.1 Dissection in PixelMapping In this

    subsection, the implementation of the function PixelMapping is explained with the help of the pseudo code(Algorithm 6) and Figure 15, in which the green area represents the transparent display and the red dot denotes the ball. PixelMapping takes two arguments as the input, ballPositionInCam(red dot in Fig- ure 15) and displayPosition, which represent the positions of the transparent display and the ball respectively in camera view. The output of this function is the ball position on the transparent display, knowing which makes it possible for the ball to be shown correctly on the display.
  58.     67   As is shown in the first

    line of the pseudo code, the parameter displayPosition consists of four lines lineA, lineB, lineC and lineD, where lineA and lineC are opposite sides and the same goes for lineB and lineD. Note that for simplicity, it is assumed that the length of the line segment AB or CD in Figure 15 represents the width of the display. Also, it is taken for granted that neither of the two pairs of opposite sides are parallel to each other in camera view. It is not hard to realize that the solution for obtaining the corresponding ball position on the display is easier if any pair two opposite sides are perfectly parallel. For example referring to Figure 15, if lineA and lineC are parallel, to figure out the projection of ballPositionInCam on
  59.     68   lineB, the only step needed to

    take is to create a line L passing the ball position and parallel to both lineA and lineC. Then the crossing point of L and lineB is X in Figure 15, the point indicating the x-coordinate of the ball on the transparent display. The same goes for figuring out Y if lineB and lineD are parallel to each other. Therefore, the pseudo code in Algorithm 6 is designed only for solving the general case. Figure 3.6:   Although Algorithm 6 omits the situation that opposite sides are parallel, it uses the similar method that is to firstly figure out lineX (indicated in Figure 15) which is parallel to both lineA and lineC in real 3D world, not the 2D image of projective projection, and then find out X. As is known to all, the mechanism of cameras is perspective projection from objects in real 3D world to 2D images. Therefore it follows rules of perspective, applying which can simplify the task of
  60.     69   finding out the corresponding x and

    y coordinates of the ball on the display. According to the rules of perspective,3 within a specified plane, every vanishing point on the horizontal line defined by the plane’s orientation corresponds to one set of all parallel(in 3D world) lines on that plane. In Algorithm 6, we can observe that crossPtX is actually the vanishing point for the set of all lines that are parallel to both lineA and lineC on the transparent display. Obviously, that set also includes lineX. Since two points on a certain line can be used to solve for that line, lineX is found by just solving for the line passing both crossPtX and ballPositionInCam. Due to the fact that the transparent display is perfectly rectangular, X, which is defined by the crossing point of lineB and lineX, is the projection of ballPositionInCam on the x-coordinate on the transparent display. Finally, the exactly x value of the ball’s coordinate on the display can be obtained by multiplying W, the width of the transparent display, by the ratio of ||AX|| to the length of lineB as is specified in the last step of the pseudo code. Analogously, the y value of the ball’s display coordinate can be figured out following the similar steps stated in the previous paragraph. lineY can be found by generating a line passing ballPositionInCam and crossPtY, the vanishing point for another set of parallel lines containing lineB, lineD and lineY. Then Y is known by solving for the crossing point of lineA and lineY. At last, y value is found. A Minor Clarification the usage of PixelMapping is much more general than just mapping the ball position from camera view to the transparent display. In use- cases other than projectile animation such as mathematical measurement, where
  61.     70   the overlaid strokes on the paper

    are “copied” to the display on top, the display has to be informed of the corresponding strokes/lines positions so as to show the aligned graphics. Therefore, this function performs general mapping of pixels from camera view to the transparent display, which also makes the naming of this function sound more appropriate.