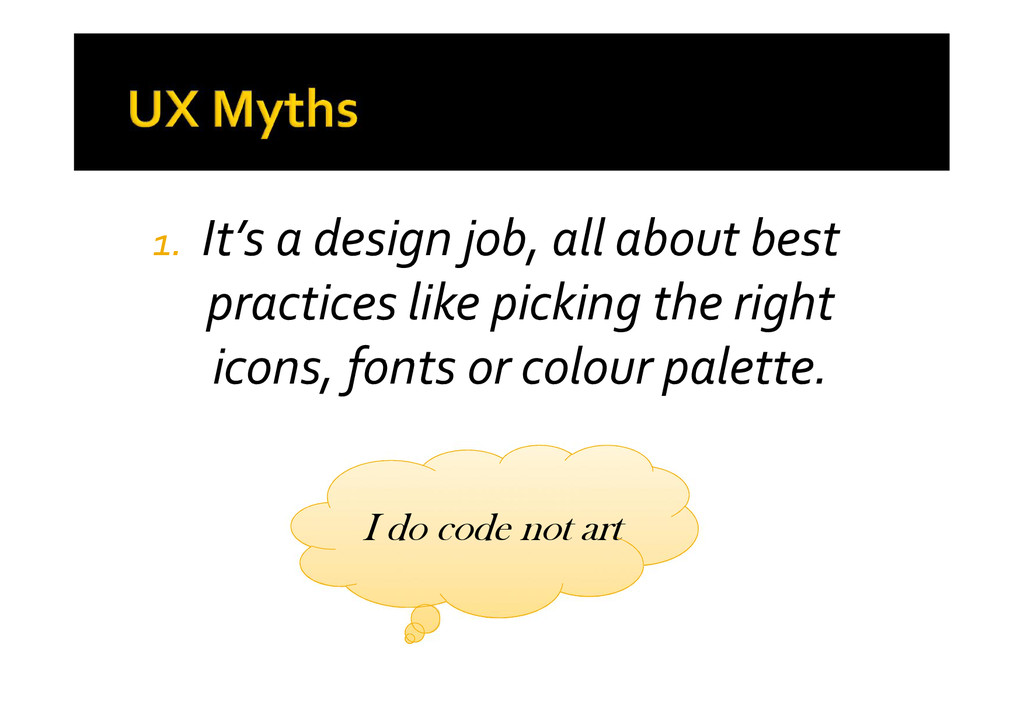
picking the right icons, fonts or colour palette. 1. It’s a design job, all about best practices like picking the right icons, fonts or colour palette. I do code not art
a short space of time for complex software toolflows. Existing Software Tool A 7-step technique to get the most worthwhile optimizations in a short space of time for complex software toolflows. New features Limited Resources
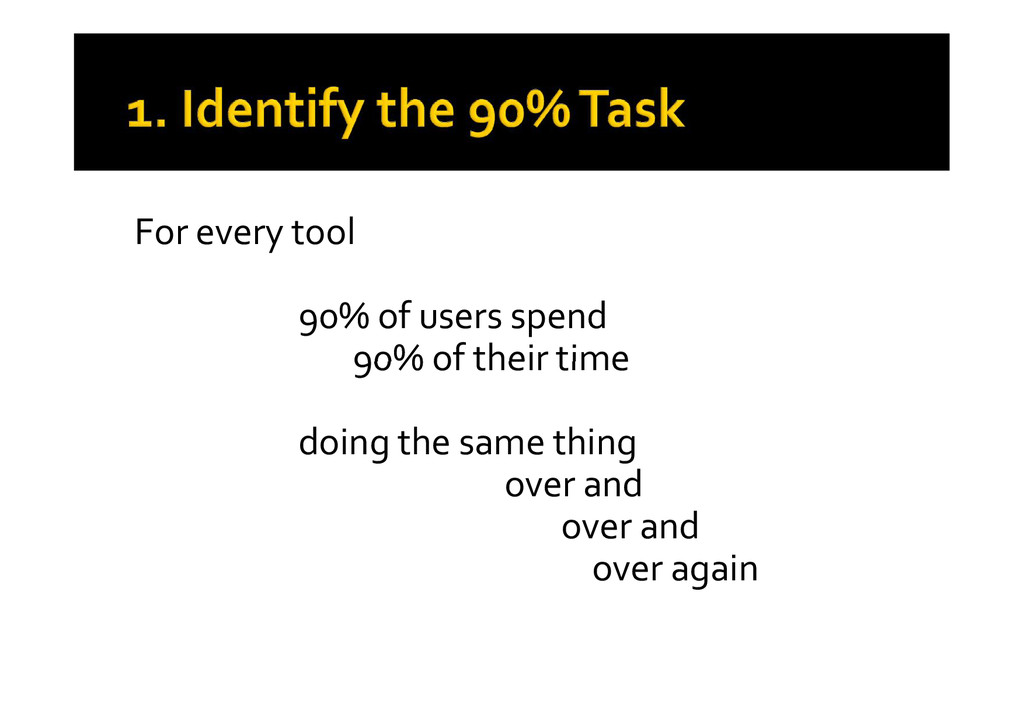
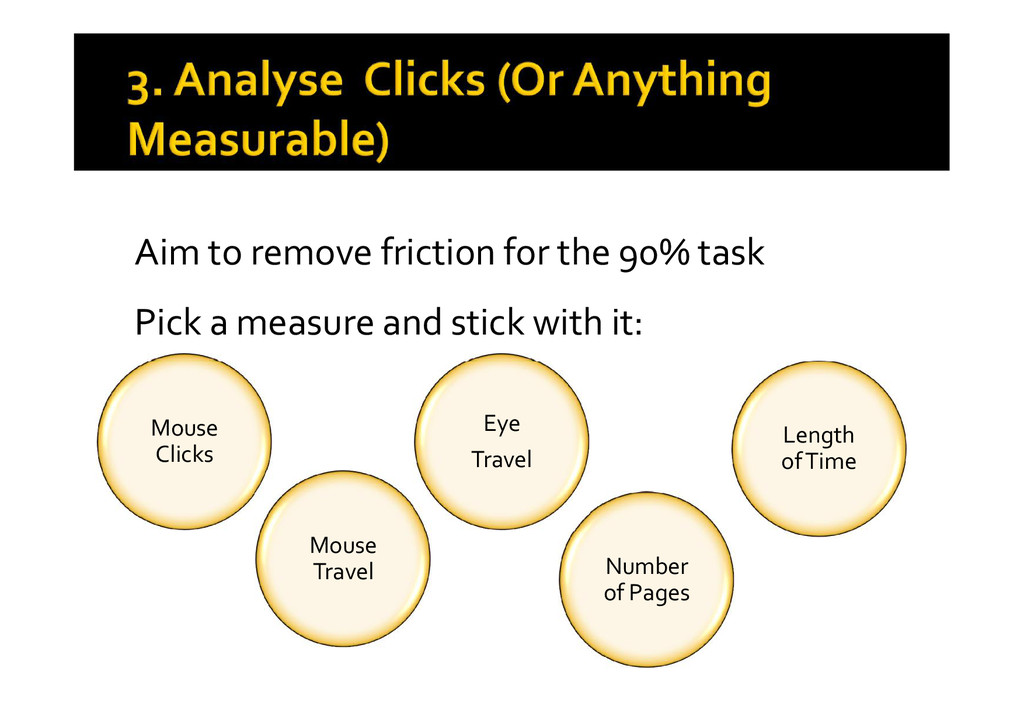
time doing the same thing over and over and over again For every tool 90% of users spend 90% of their time doing the same thing over and over and over again
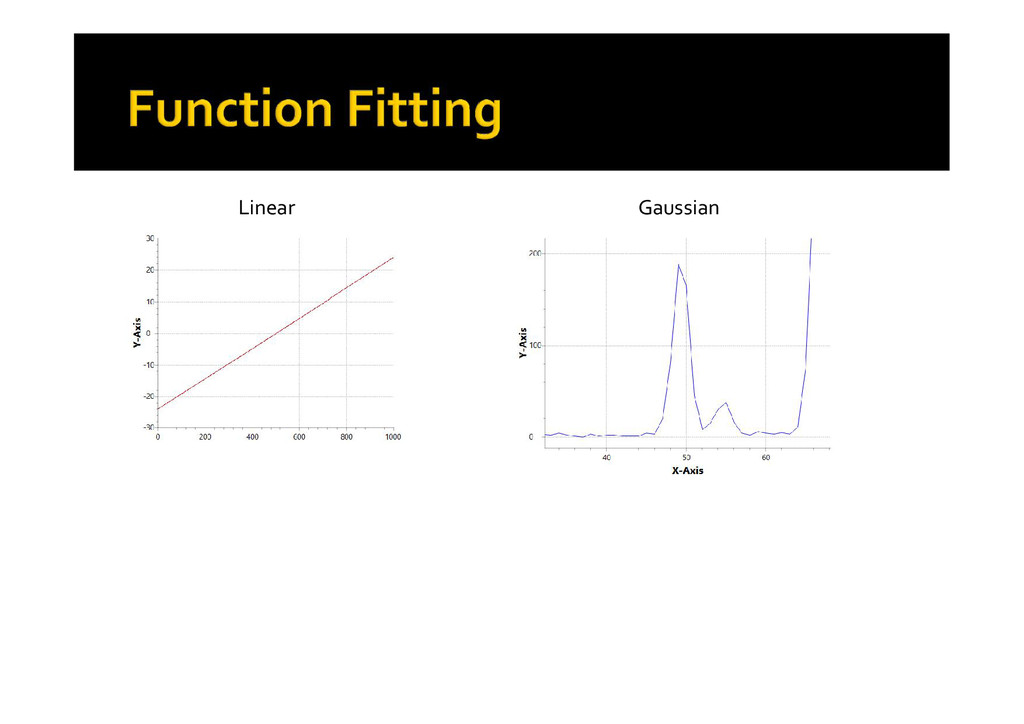
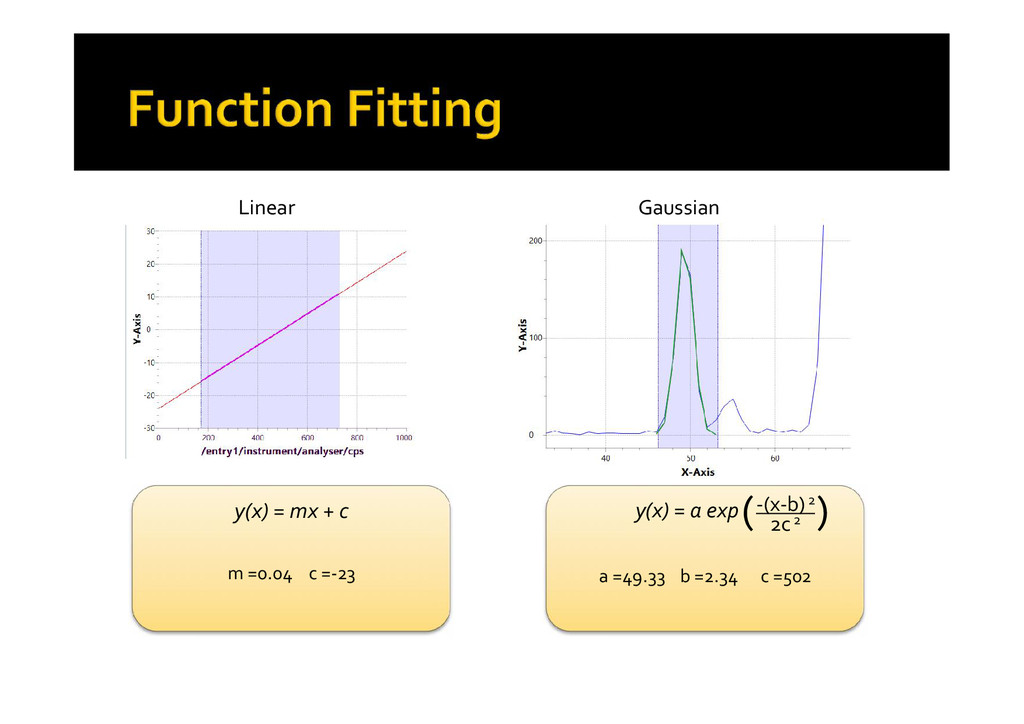
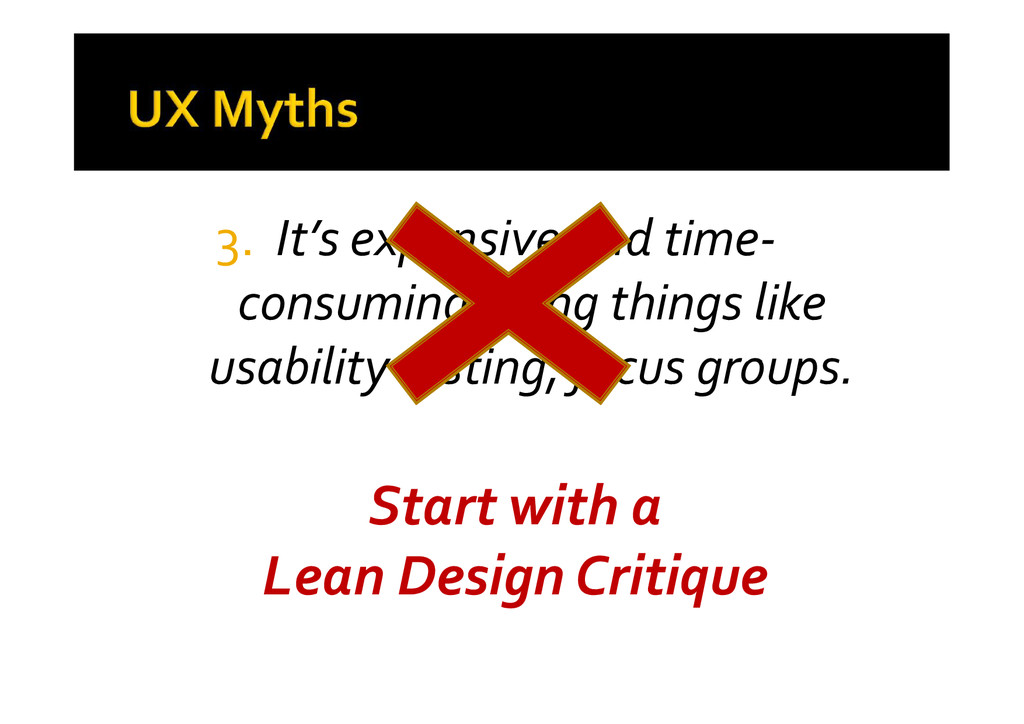
www.nngroup.com/articles/why-you-only-need-to-test-with-5-users/ What is your tool used for 90% of the time? Function Fitting What is it used for the rest of the time? Importing and exporting fitting data Changing fitting algorithms or accuracy Adding in new fitting functions Handling error conditions Input from product manager and one key user www.nngroup.com/articles/why-you-only-need-to-test-with-5-users/ What is your tool used for 90% of the time? Function Fitting What is it used for the rest of the time? Importing and exporting fitting data Changing fitting algorithms or accuracy Adding in new fitting functions Handling error conditions
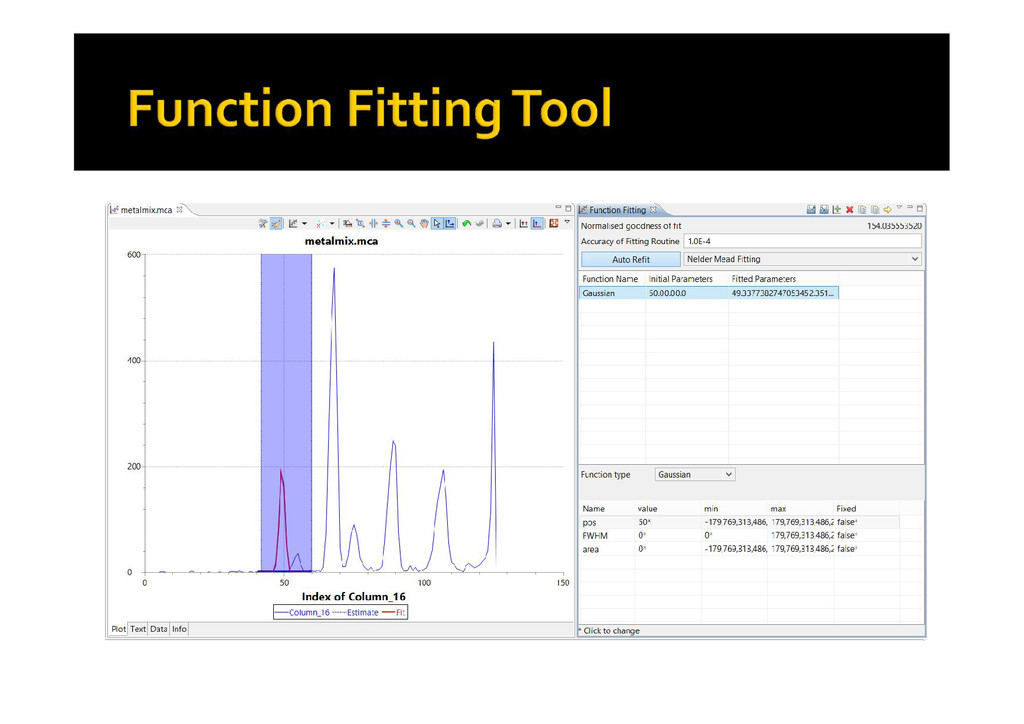
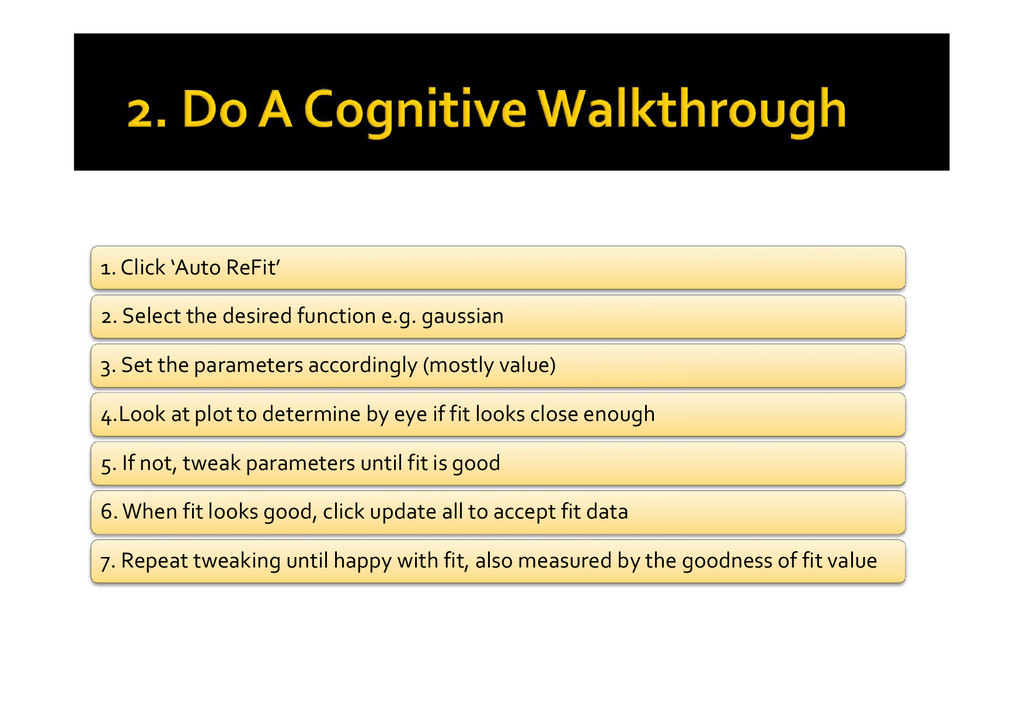
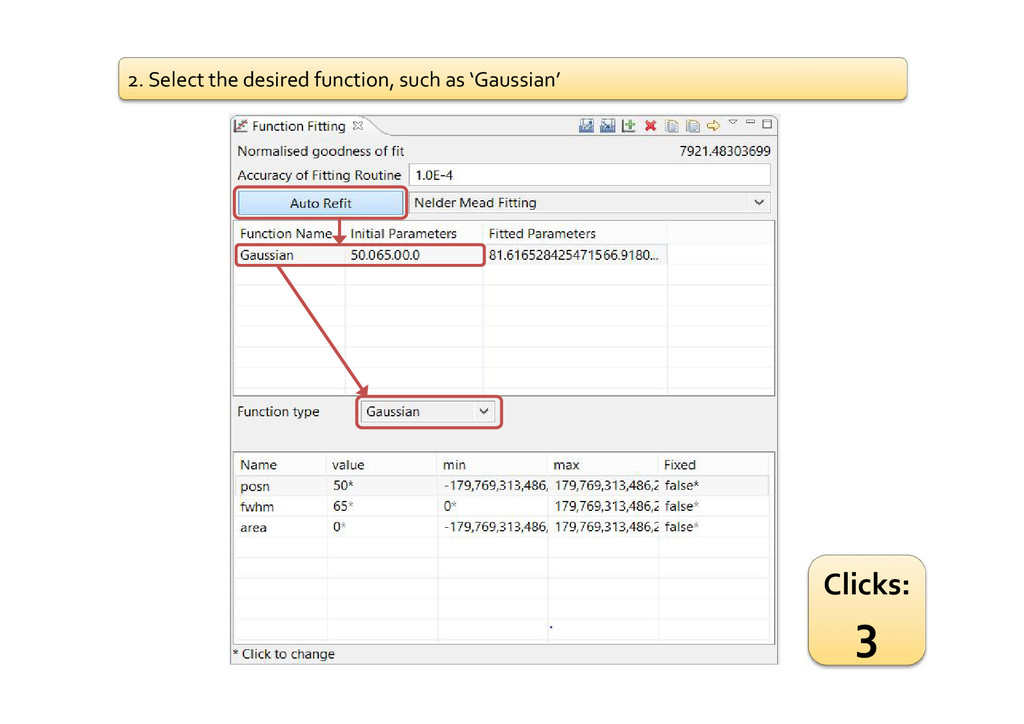
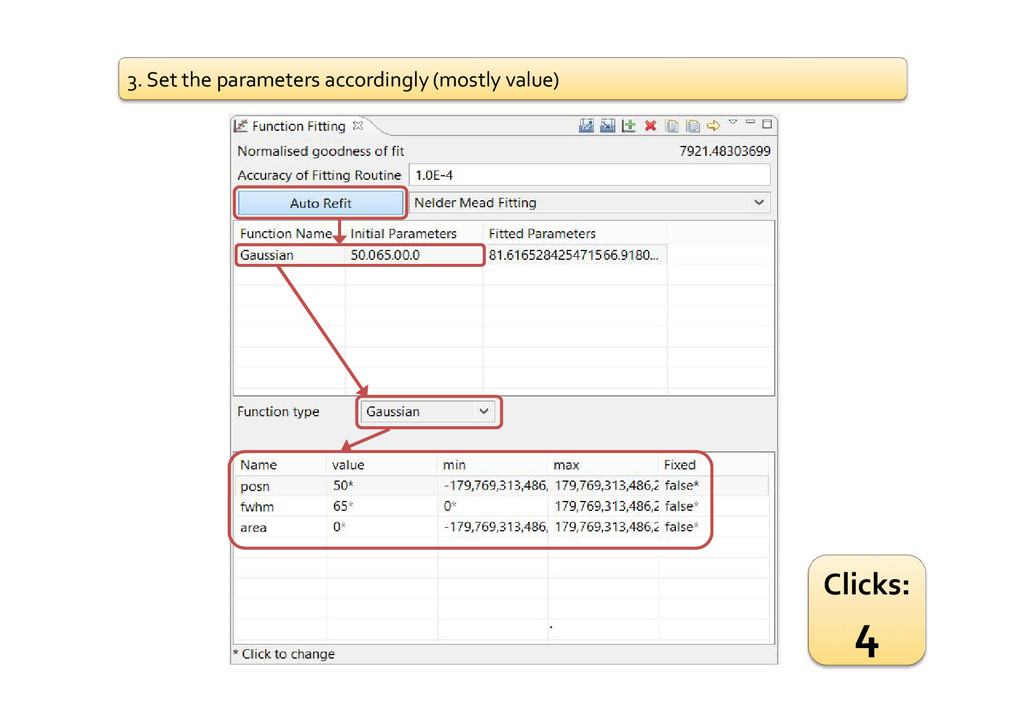
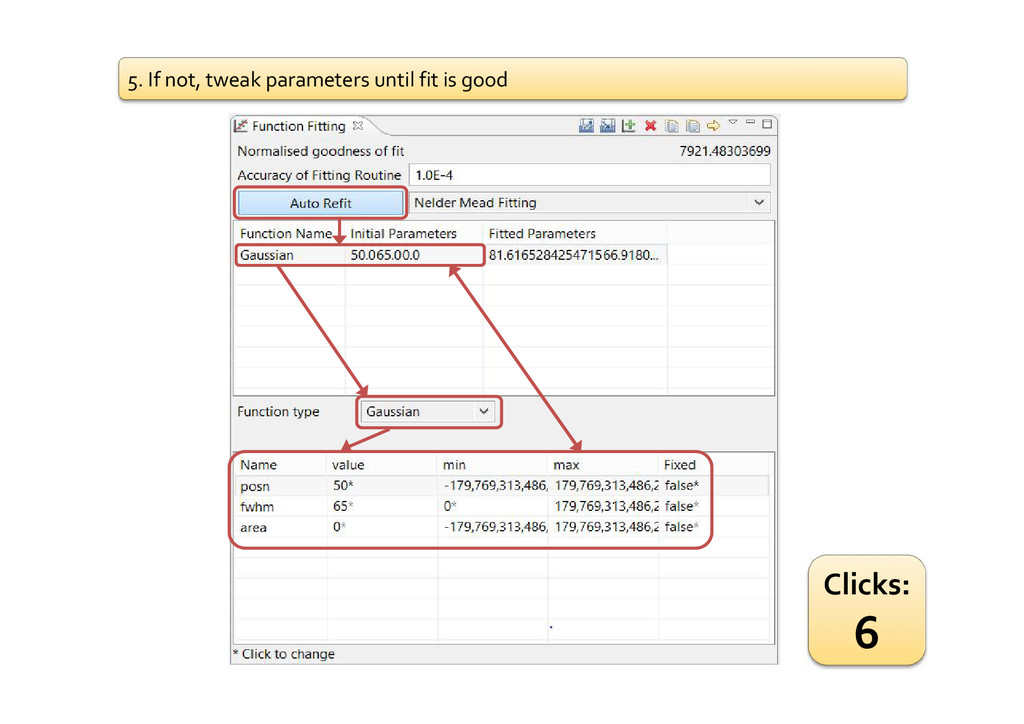
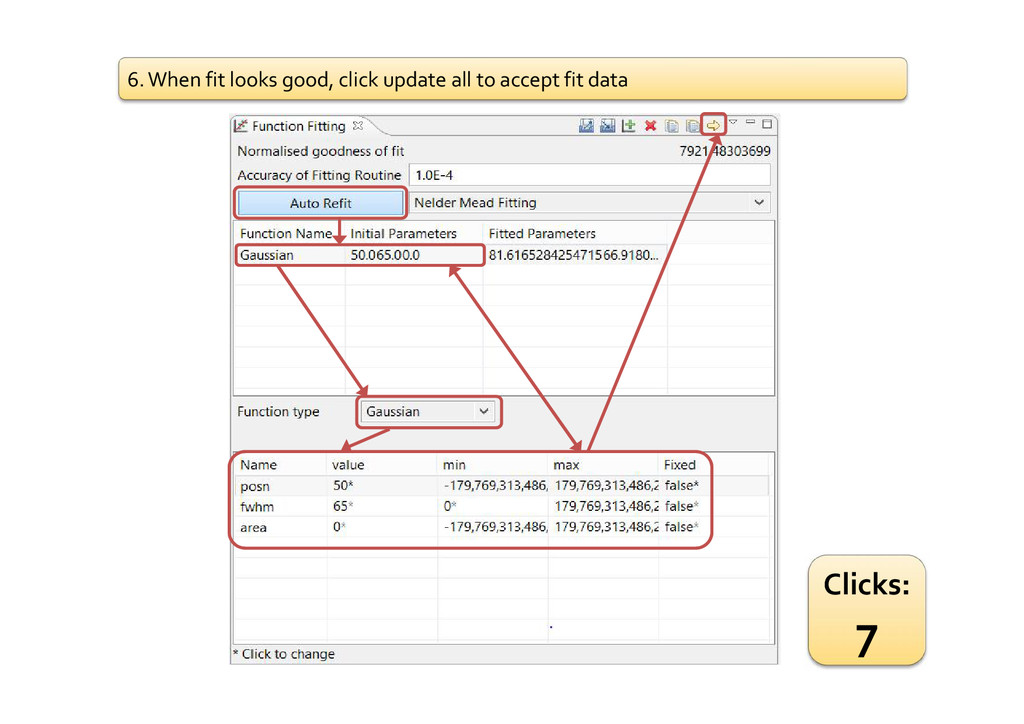
gaussian 3. Set the parameters accordingly (mostly value) 3. Set the parameters accordingly (mostly value) 4.Look at plot to determine by eye if fit looks close enough 5. If not, tweak parameters until fit is good 6. When fit looks good, click update all to accept fit data 7. Repeat tweaking until happy with fit, also measured by the goodness of fit value
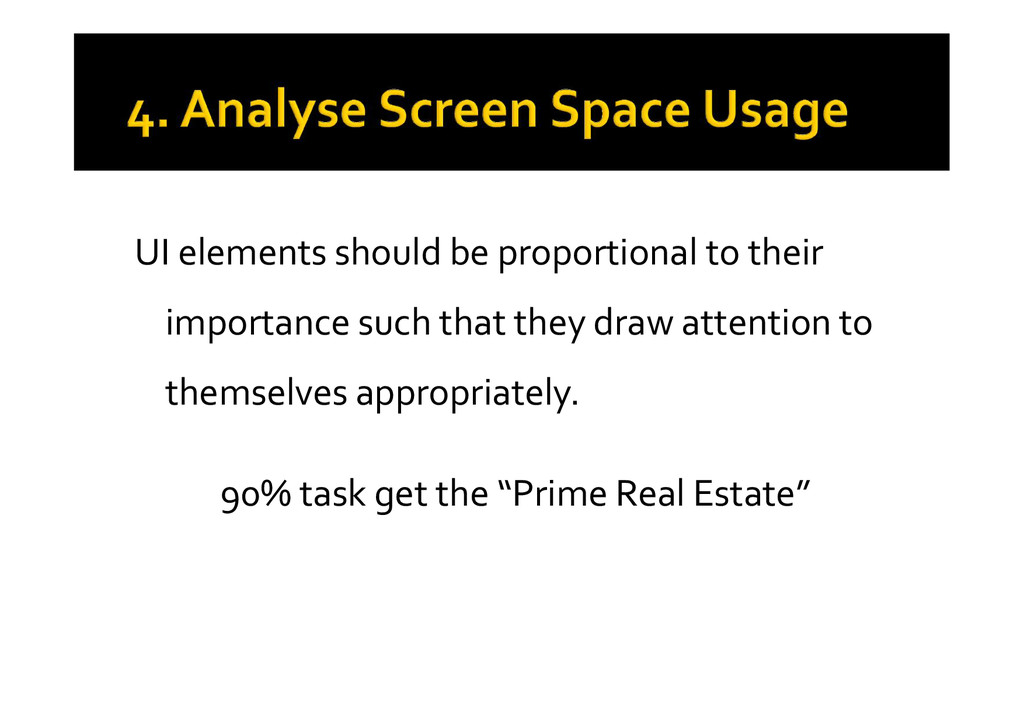
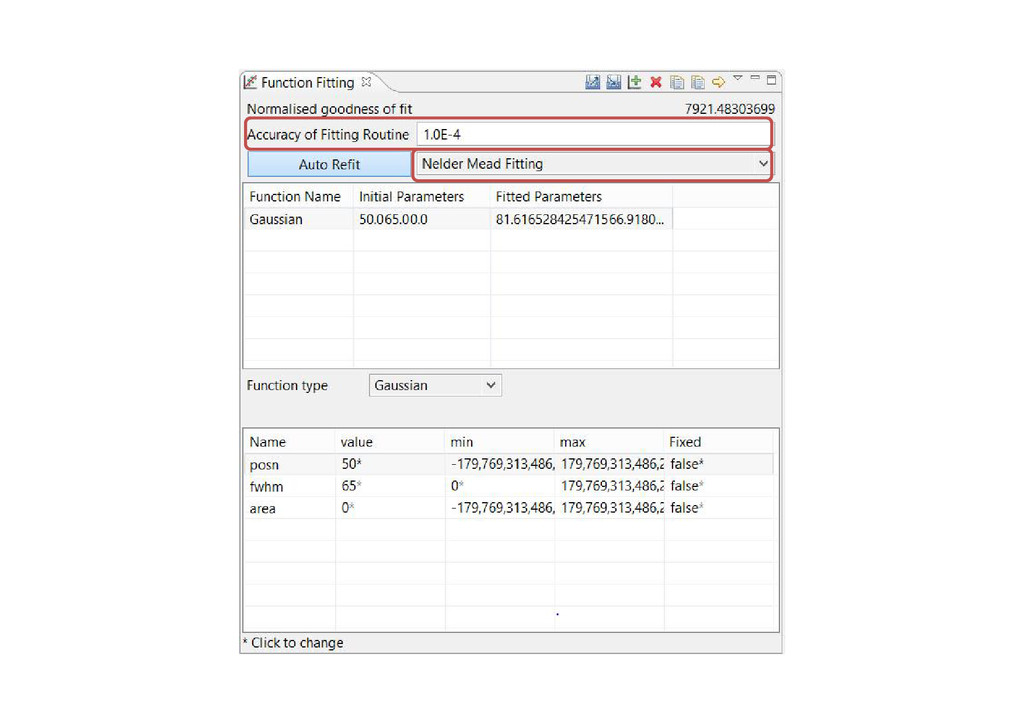
they draw attention to themselves appropriately. 90% task get the “Prime Real Estate” UI elements should be proportional to their importance such that they draw attention to themselves appropriately. 90% task get the “Prime Real Estate”
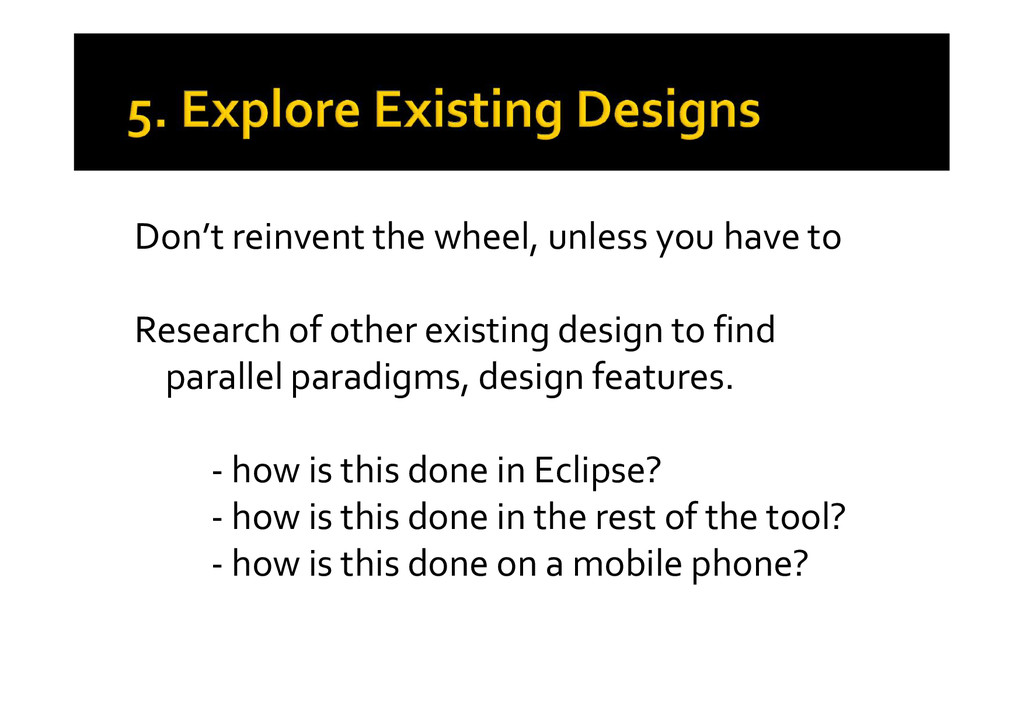
other existing design to find parallel paradigms, design features. - how is this done in Eclipse? - how is this done in the rest of the tool? - how is this done on a mobile phone? Don’t reinvent the wheel, unless you have to Research of other existing design to find parallel paradigms, design features. - how is this done in Eclipse? - how is this done in the rest of the tool? - how is this done on a mobile phone?
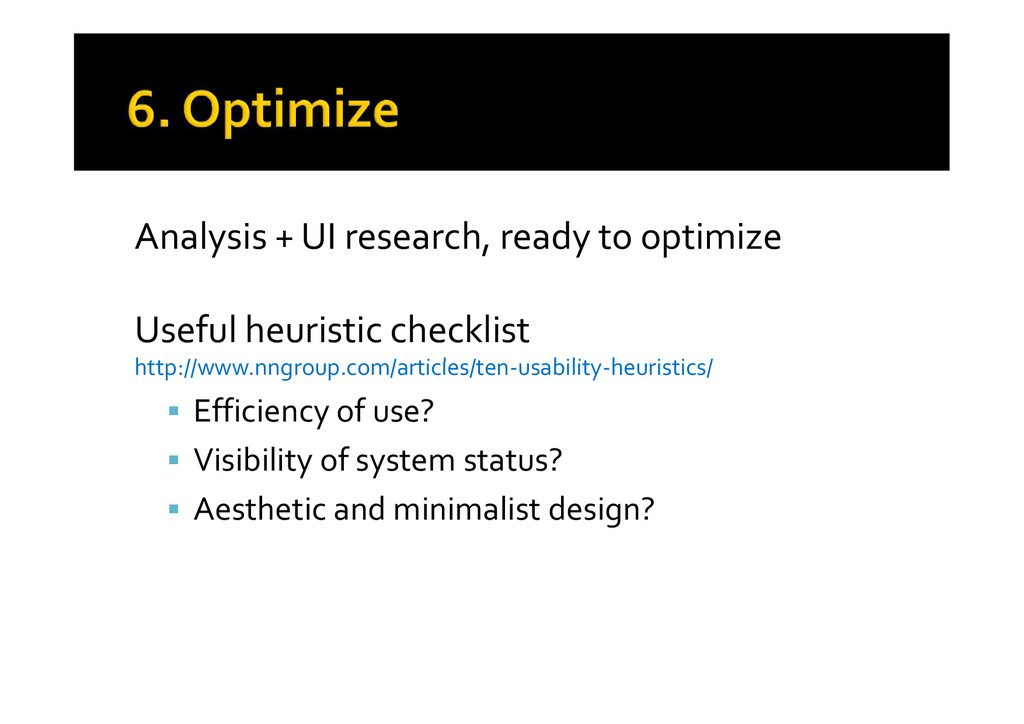
http://www.nngroup.com/articles/ten-usability-heuristics/ Efficiency of use? Visibility of system status? Aesthetic and minimalist design? Analysis + UI research, ready to optimize Useful heuristic checklist http://www.nngroup.com/articles/ten-usability-heuristics/ Efficiency of use? Visibility of system status? Aesthetic and minimalist design?
picking the right icons, fonts or colour palette. 1. It’s a design job, all about best practices like picking the right icons, fonts or colour palette. I do code not art
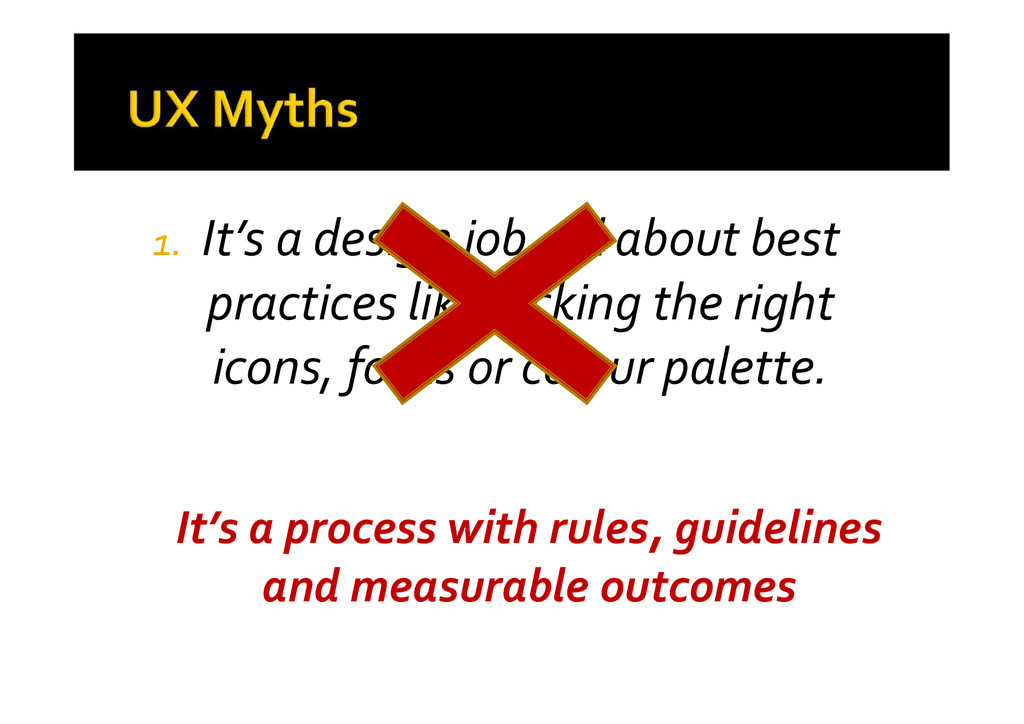
picking the right icons, fonts or colour palette. 1. It’s a design job, all about best practices like picking the right icons, fonts or colour palette. It’s a process with rules, guidelines and measurable outcomes
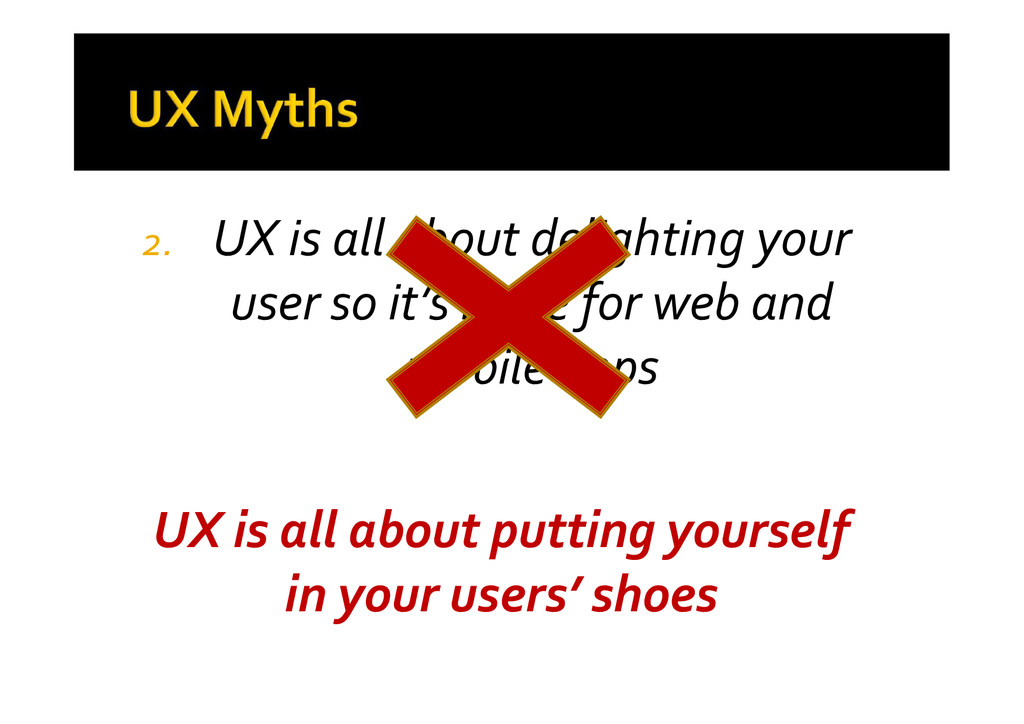
more for web and mobile apps 2. UX is all about delighting your user so it’s more for web and mobile apps UX is all about putting yourself in your users’ shoes
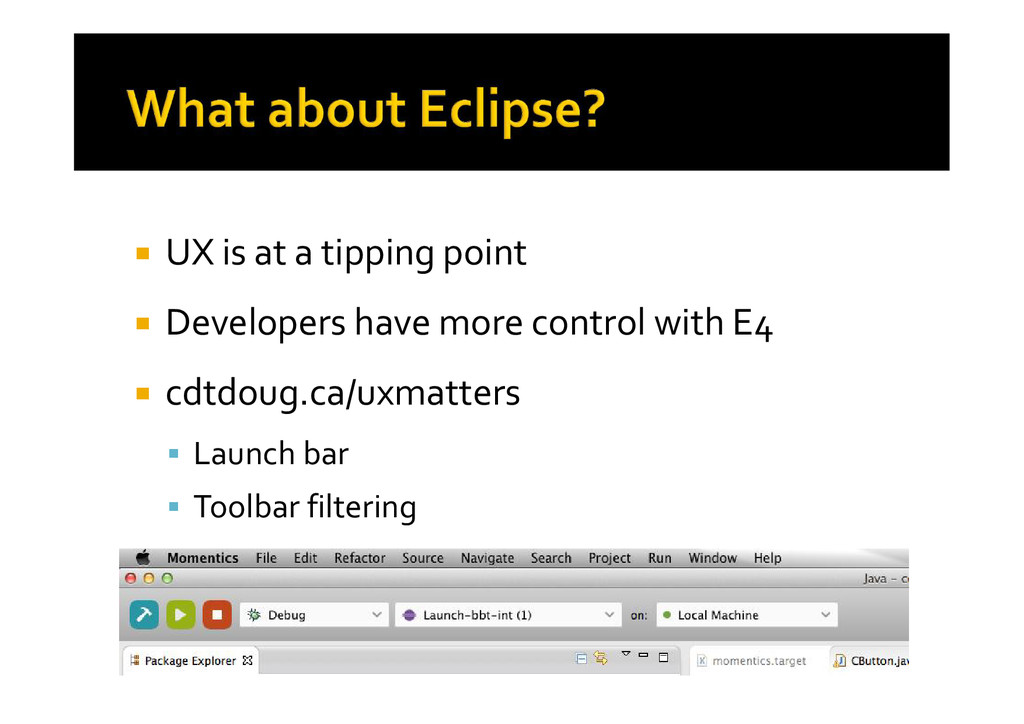
more control with E4 cdtdoug.ca/uxmatters Launch bar Toolbar filtering UX is at a tipping point Developers have more control with E4 cdtdoug.ca/uxmatters Launch bar Toolbar filtering