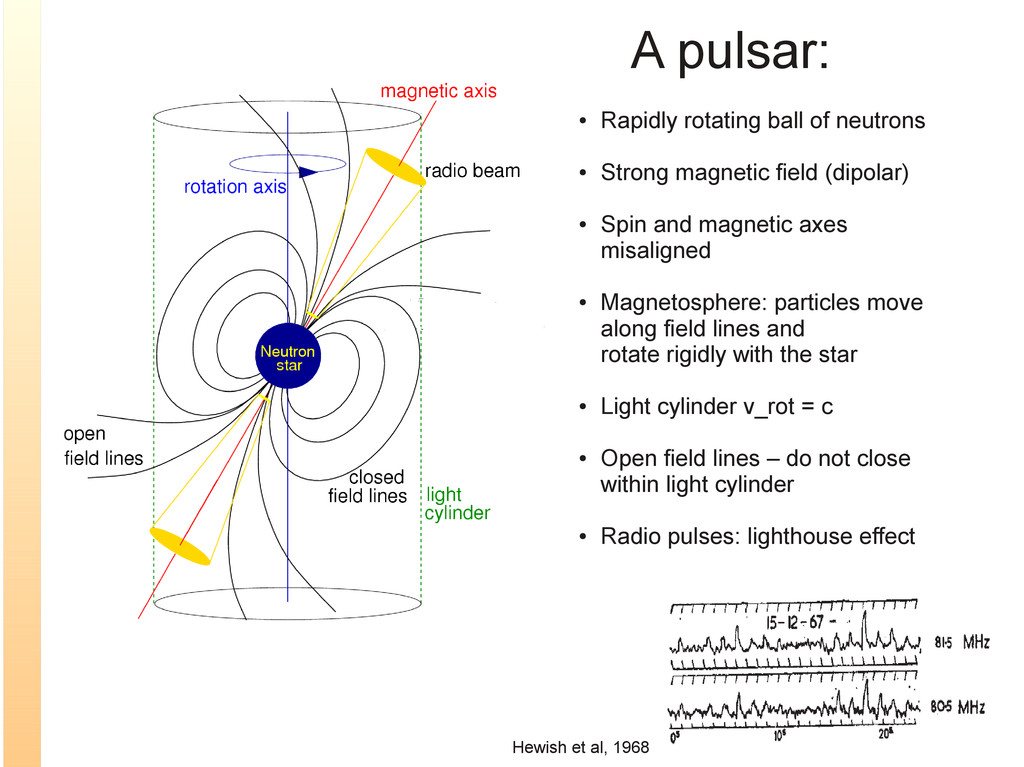
magnetic field (dipolar) • Spin and magnetic axes misaligned • Magnetosphere: particles move along field lines and rotate rigidly with the star • Light cylinder v_rot = c • Open field lines – do not close within light cylinder • Radio pulses: lighthouse effect Hewish et al, 1968
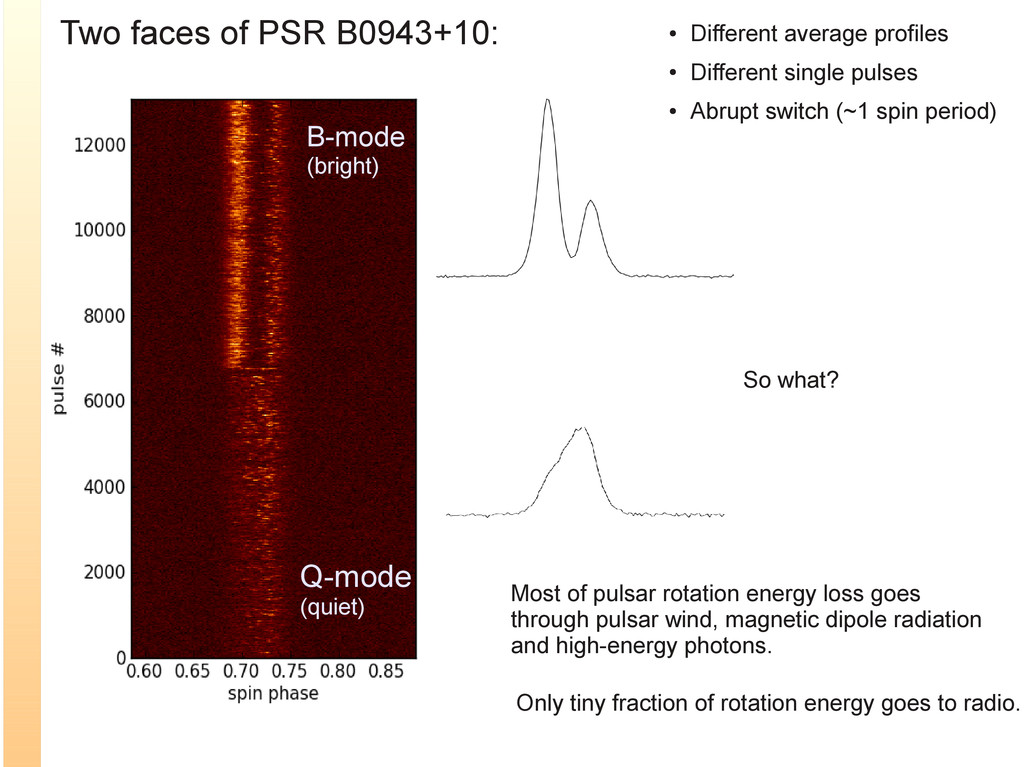
Different average profiles • Different single pulses • Abrupt switch (~1 spin period) Most of pulsar rotation energy loss goes through pulsar wind, magnetic dipole radiation and high-energy photons. Only tiny fraction of rotation energy goes to radio. So what?
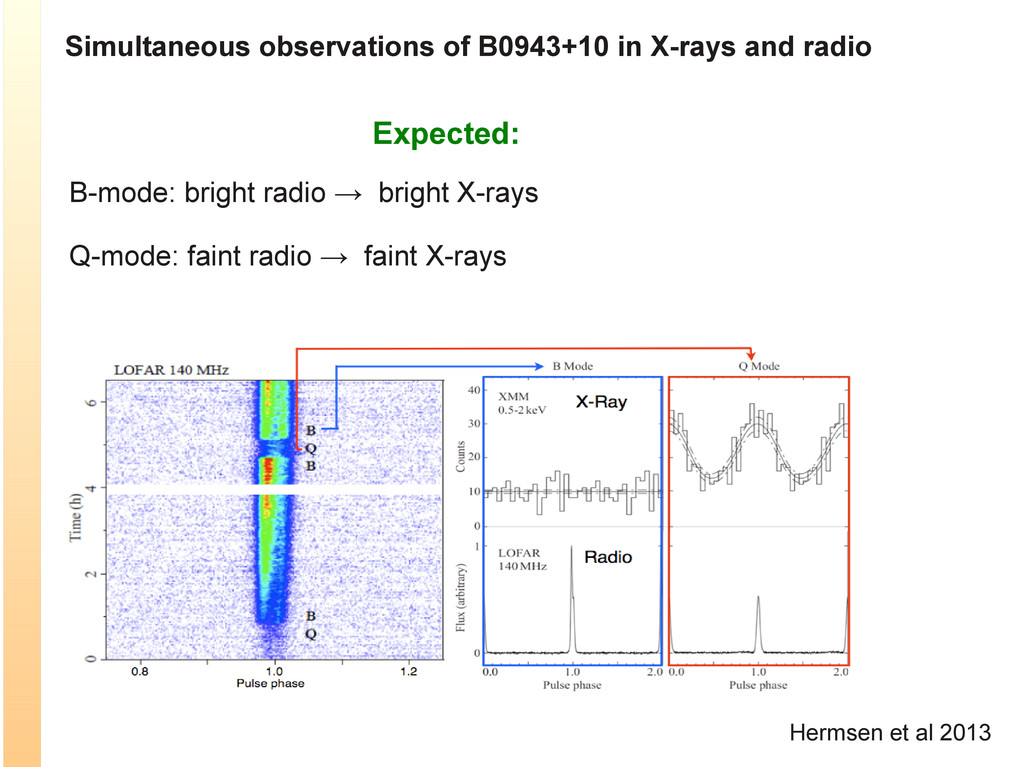
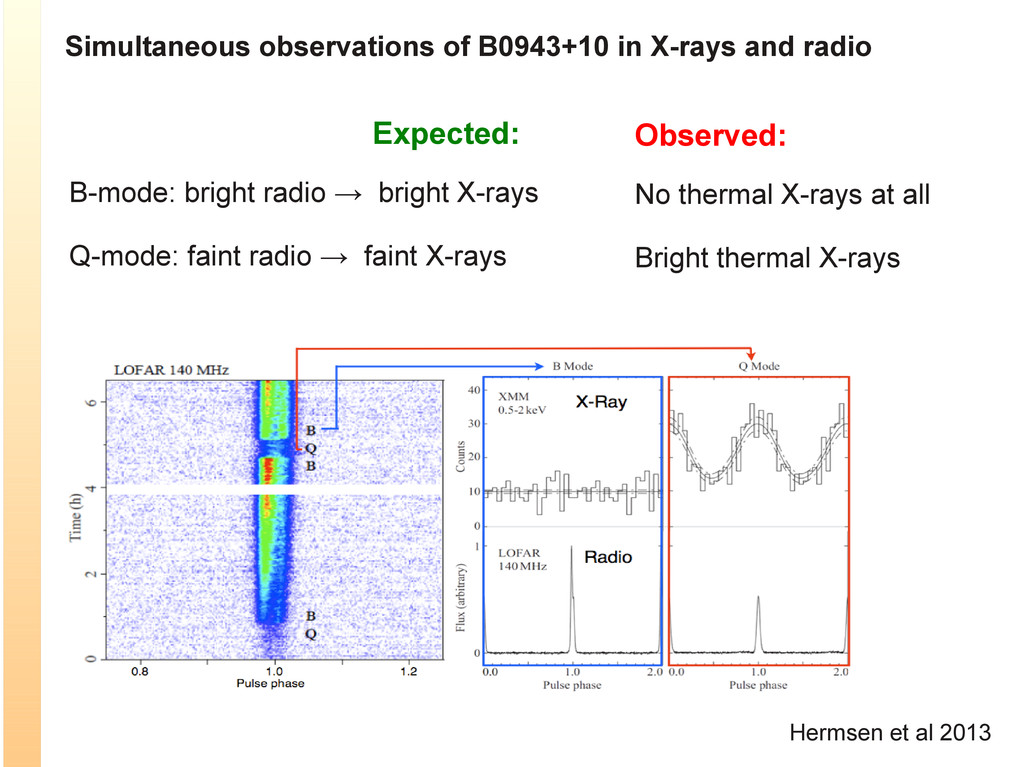
X-rays Q-mode: faint radio → faint X-rays Observed: No thermal X-rays at all Bright thermal X-rays Simultaneous observations of B0943+10 in X-rays and radio
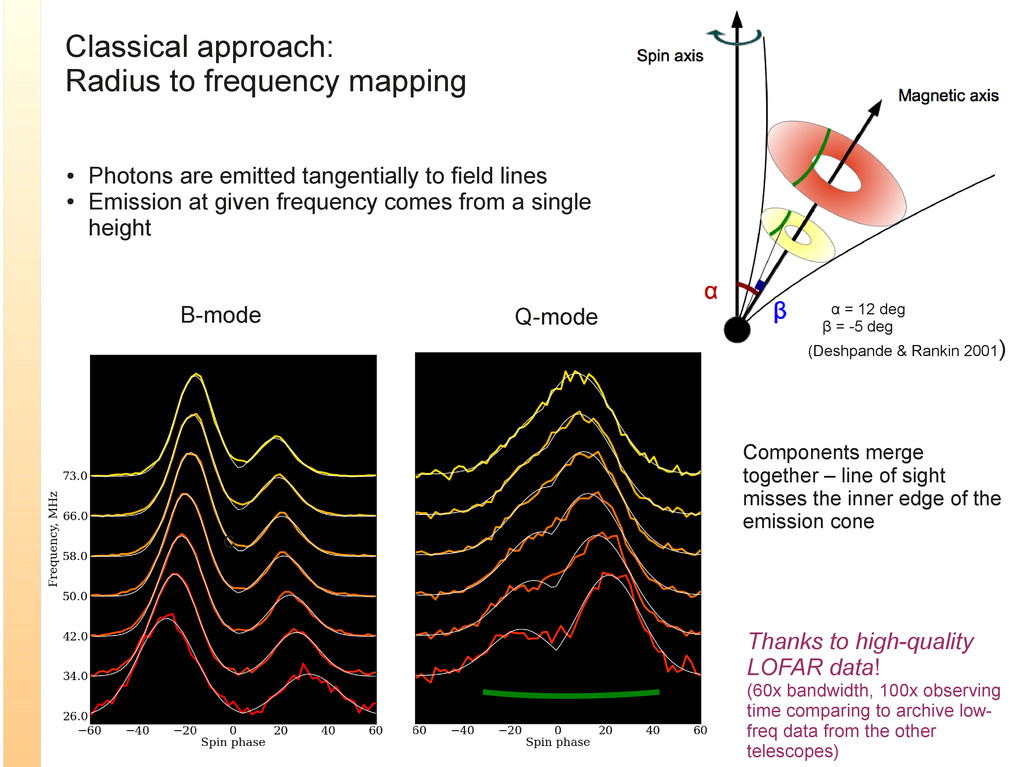
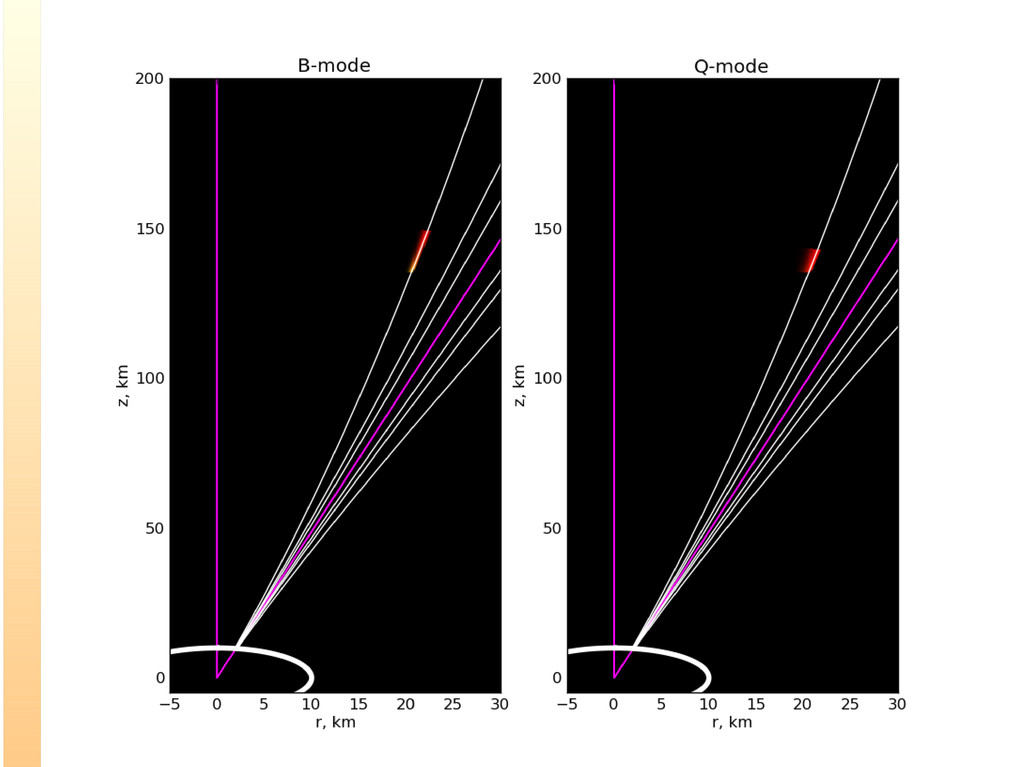
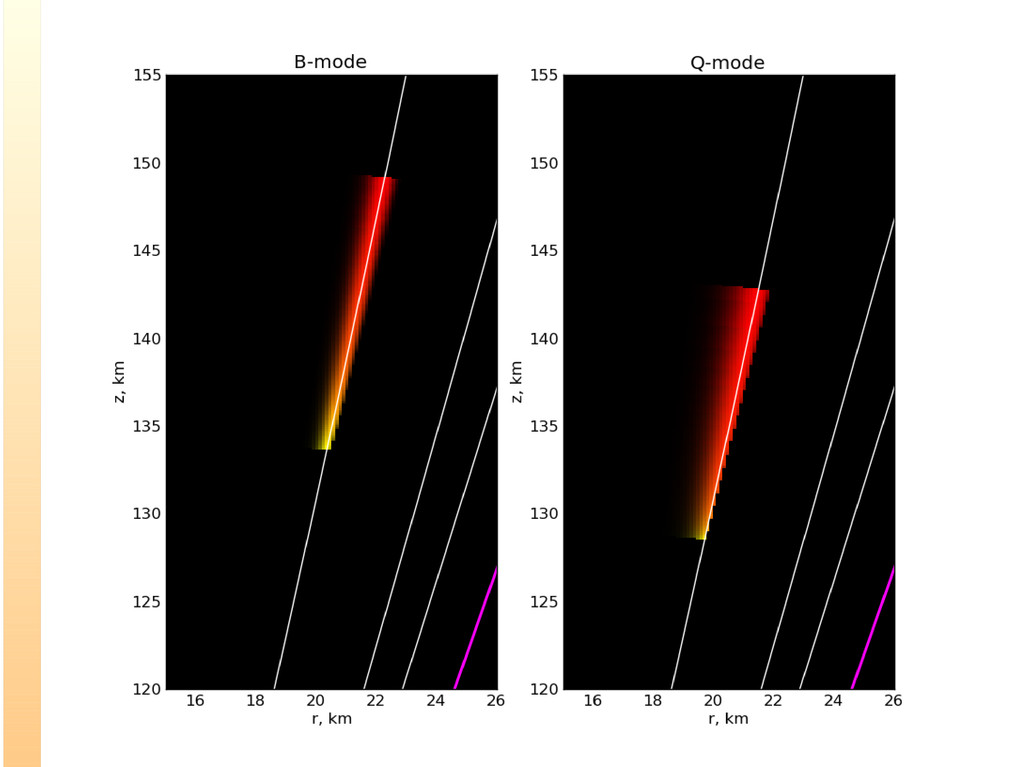
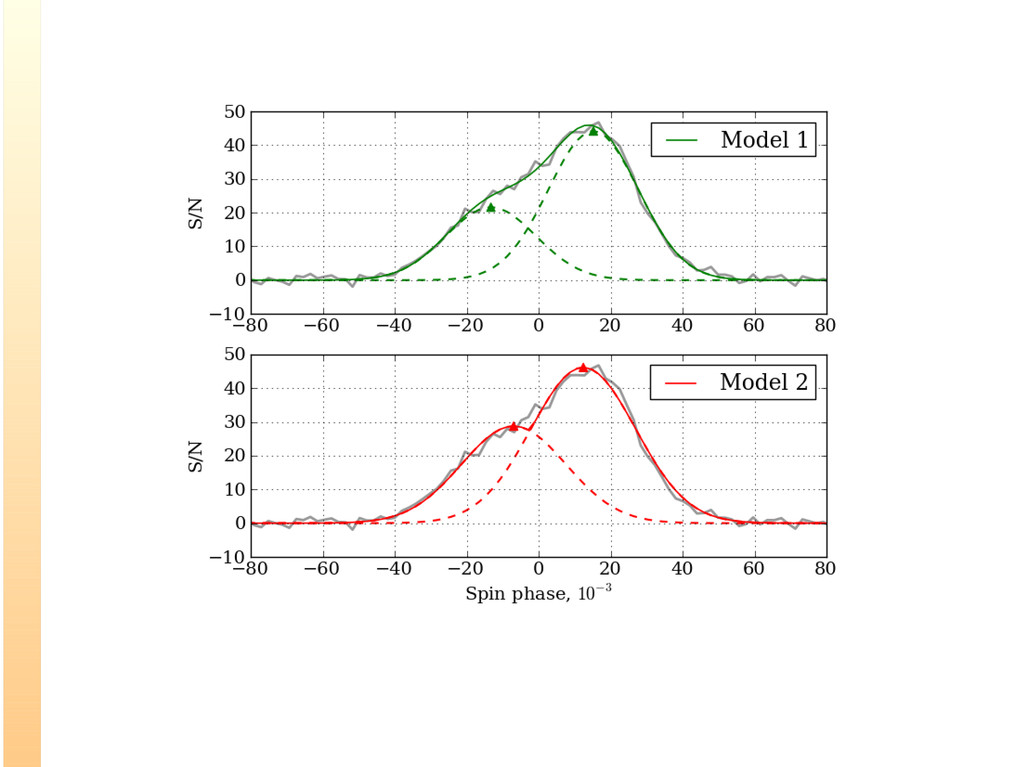
tangentially to field lines • Emission at given frequency comes from a single height Thanks to high-quality LOFAR data! (60x bandwidth, 100x observing time comparing to archive low- freq data from the other telescopes) Components merge together – line of sight misses the inner edge of the emission cone c B-mode Q-mode Αα = 12 deg B β = -5 deg (Deshpande & Rankin 2001)
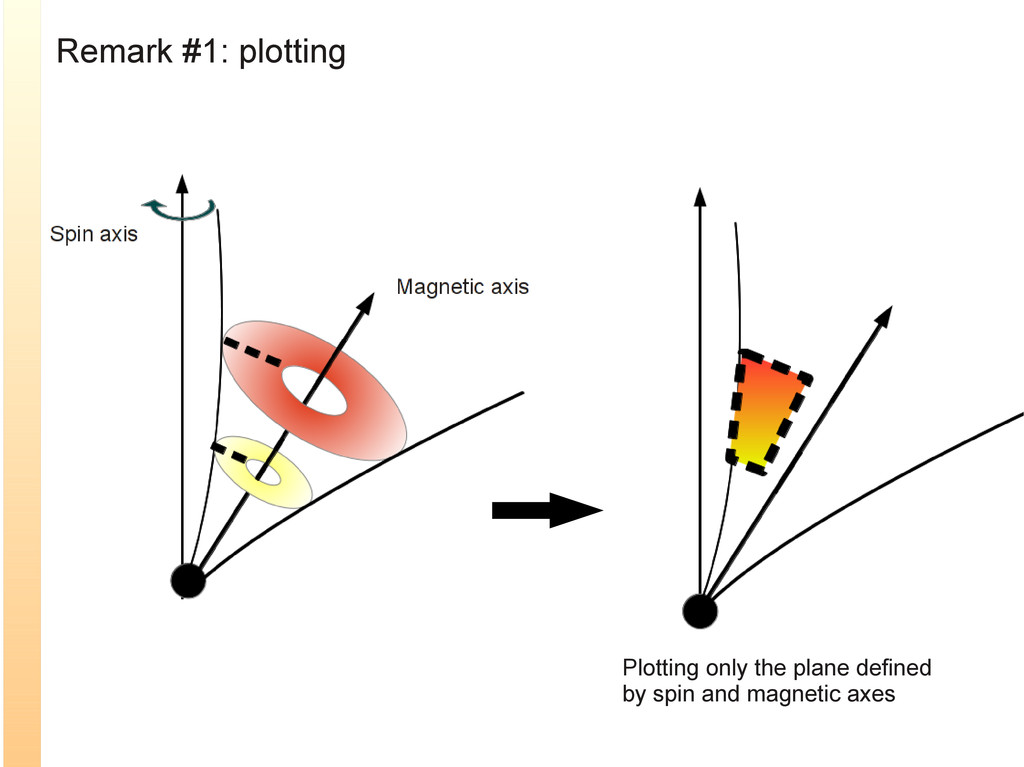
height (same radius for multiple lines starting at different magnetic latitude ϑ 0 ) r sin-2ϑ = R NS sin-2ϑ 0 ϑ 0 <0.013 rad (last open field line, ϑ p ) ϑ 0 >0.004 rad (absence of light travel time delay, aberration, magnetic line sweepback) Remark #2: which field line? On the next slides location of emission region is given for last open field line starting at ϑ p . For rest of lines coordinates scale as 1 < (ϑ p /ϑ 0 )2 < 10
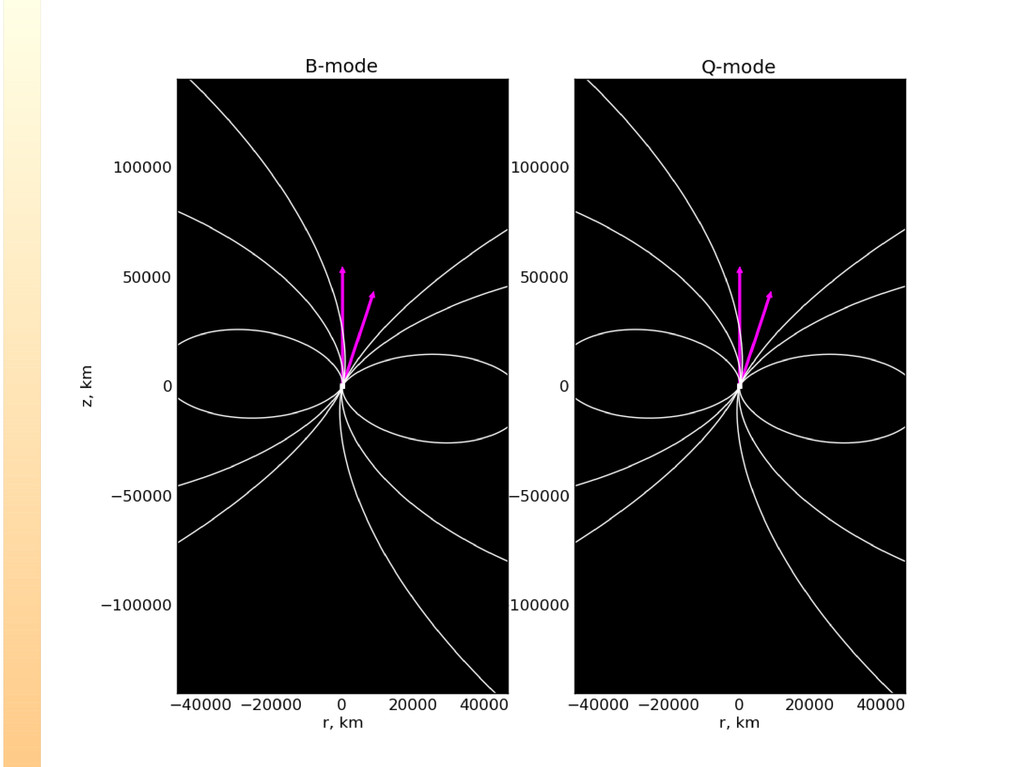
< ϑ p /ϑ 0 < 3.5 Radius of light cylinder : 52000 km Radius of the star: 10 km The difference in average profiles in B and Q modes at 25-80 MHz can be explained by shifting emitting region by few km along the field line.
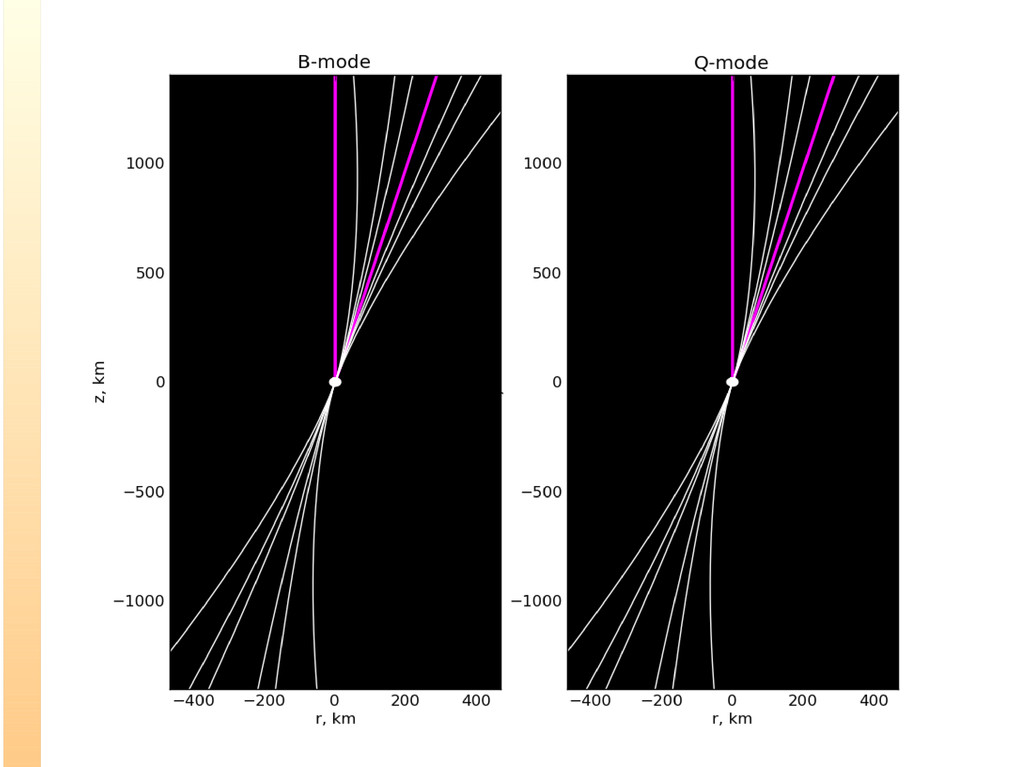
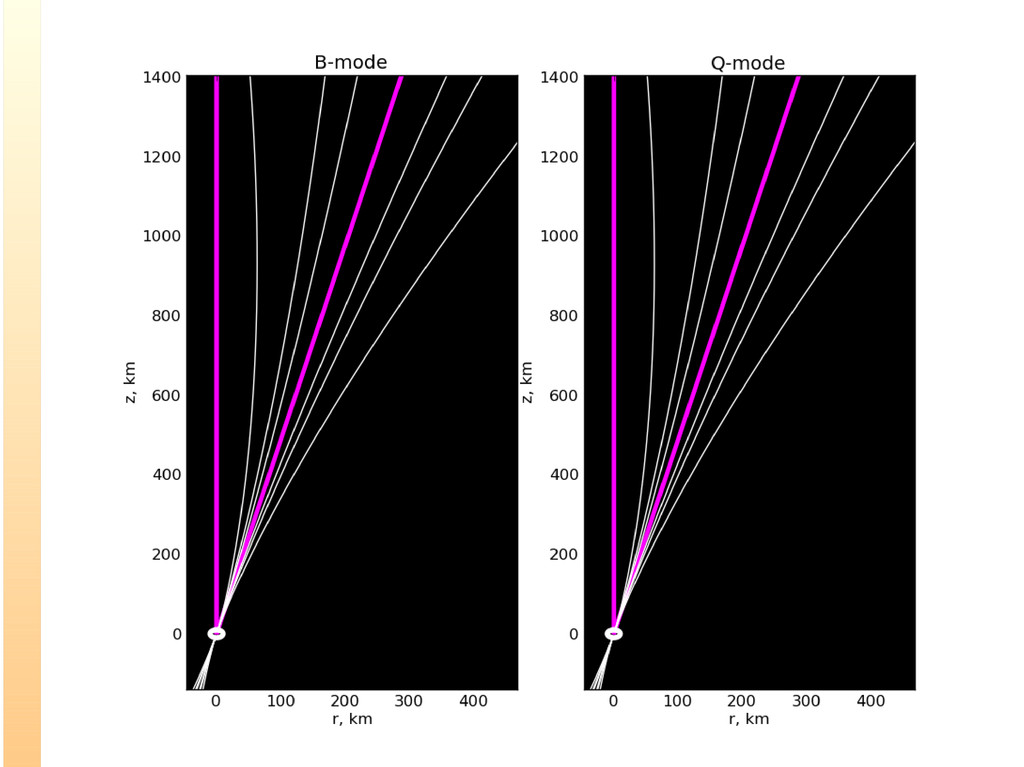
the location of radio emitting regions in B and Q mode. • Radio emission comes from narrow range of heights. This heights are not very different between the modes.
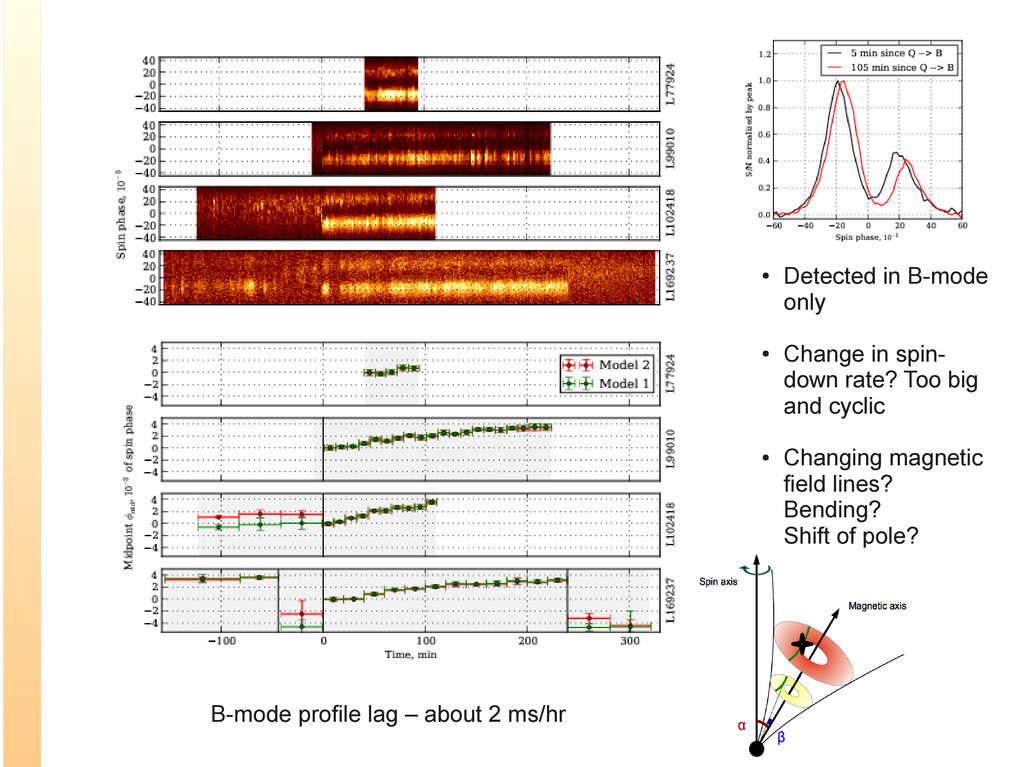
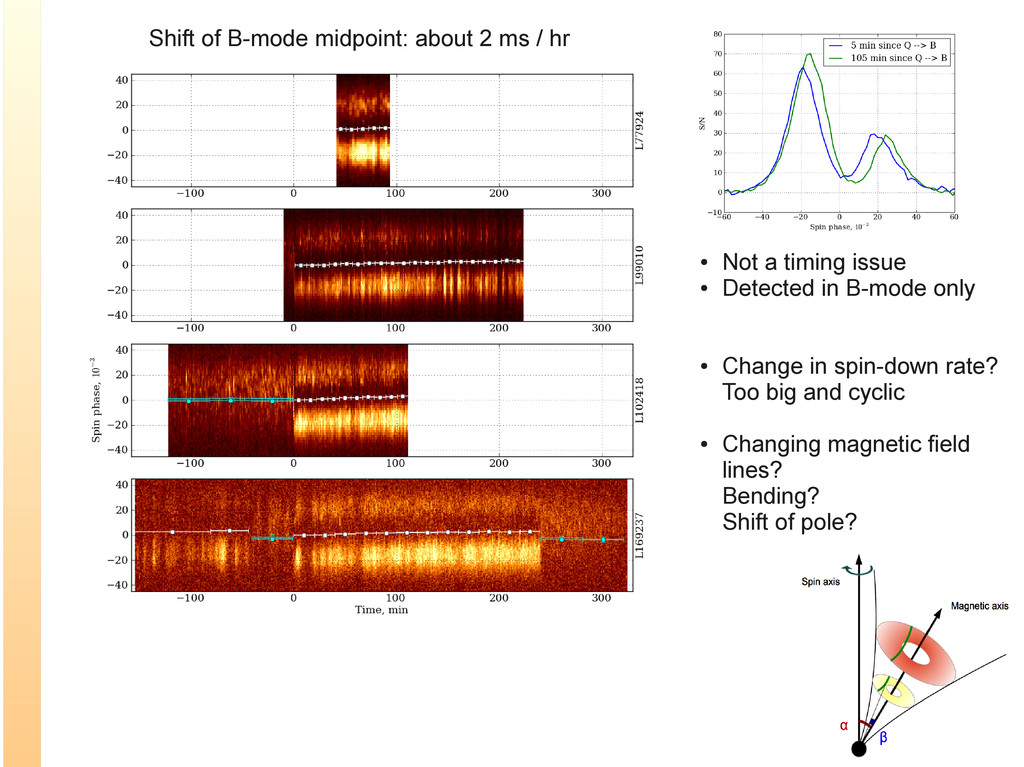
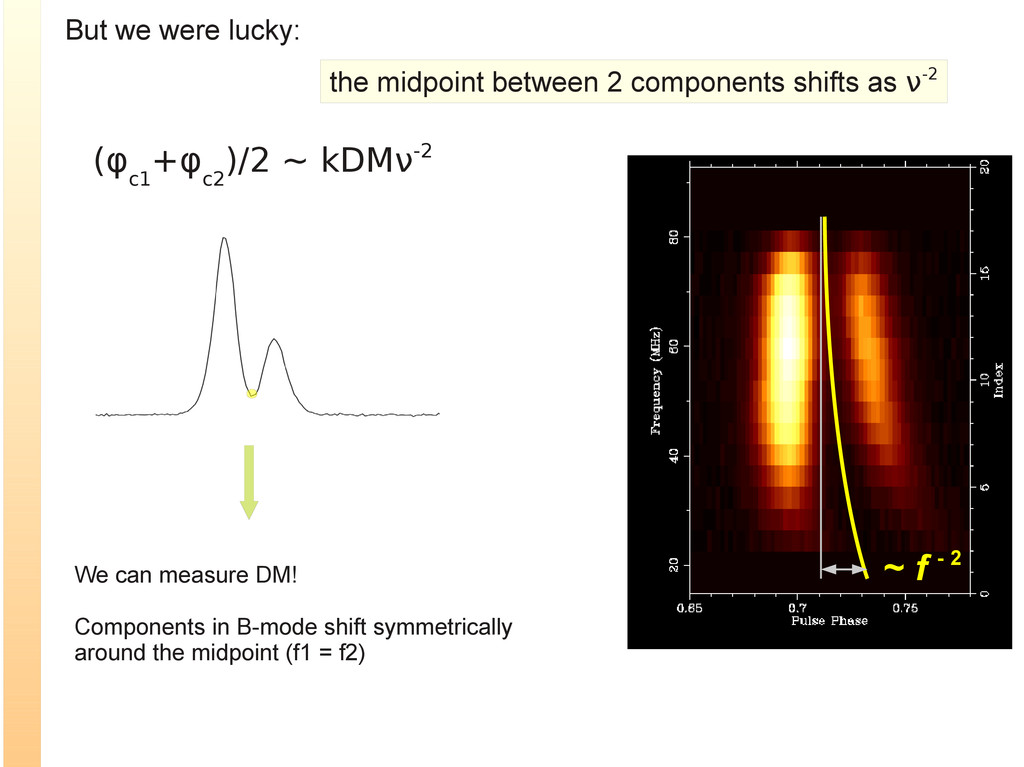
Q modes at 25-80 MHz can be explained by shifting emitting region by few km along the field line. If something dramatic happens to radio, it must be at much lower/higher frequencies or very close to the magnetic pole. • The midpoint between the components in B-mode drifts by about 2 ms/hr. The midpoint in Q-mode does not change within these limits. Why?
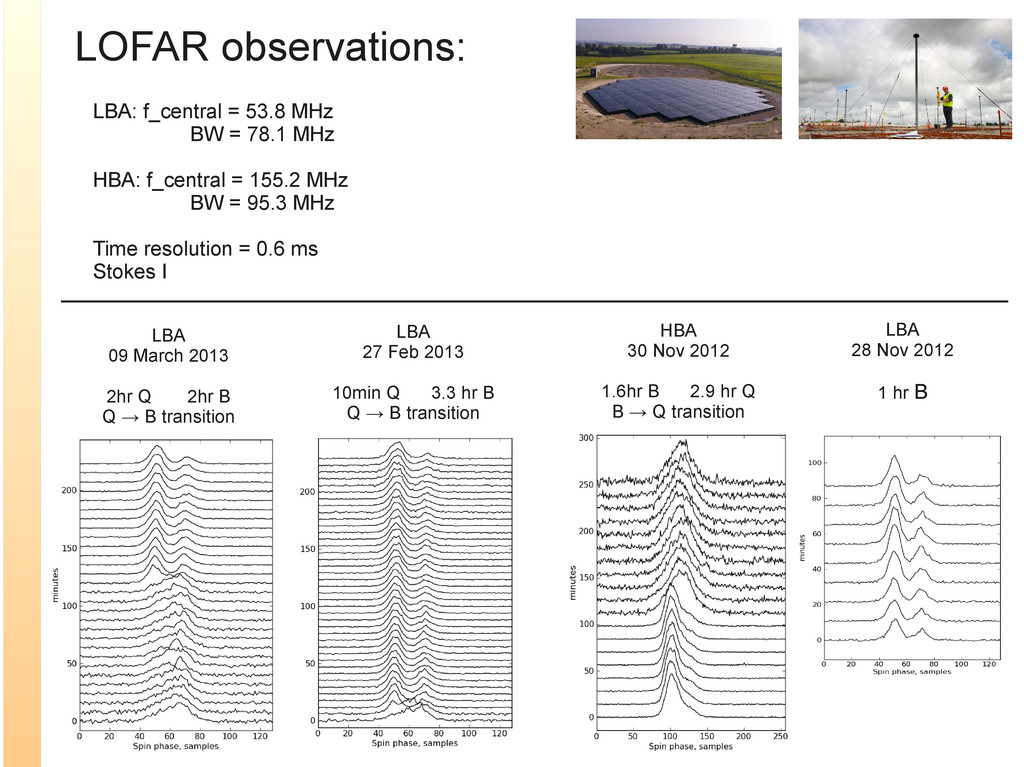
MHz HBA: f_central = 155.2 MHz BW = 95.3 MHz Time resolution = 0.6 ms Stokes I LBA 09 March 2013 2hr Q 2hr B Q → B transition LBA 27 Feb 2013 10min Q 3.3 hr B Q → B transition HBA 30 Nov 2012 1.6hr B 2.9 hr Q B → Q transition LBA 28 Nov 2012 1 hr B
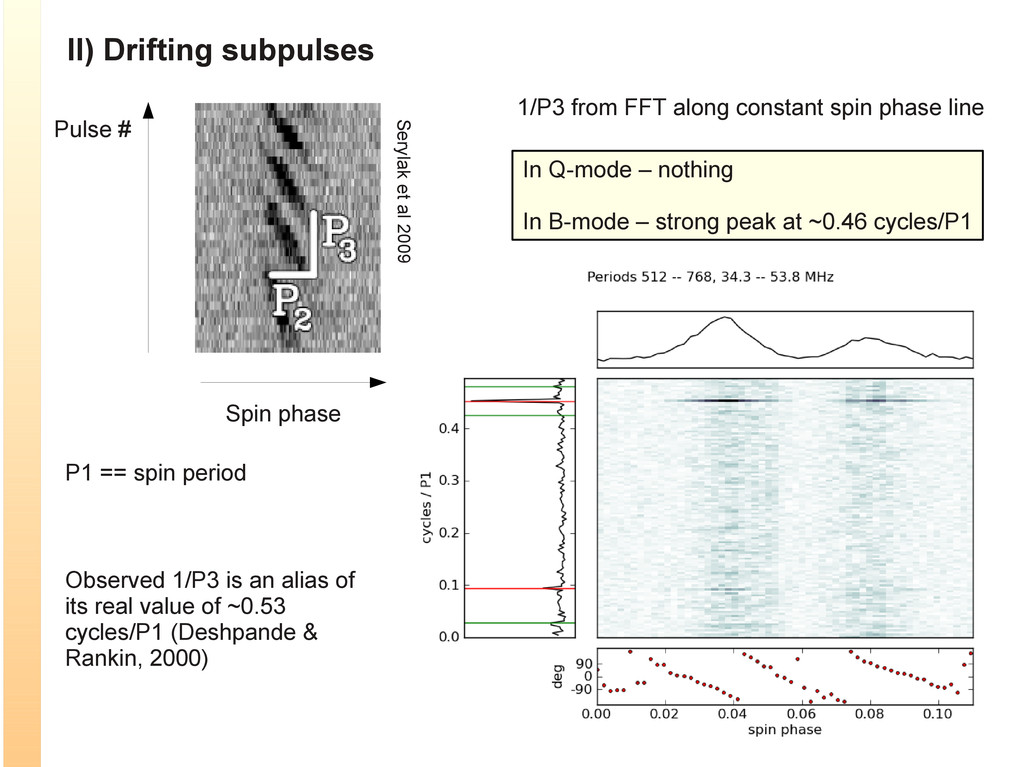
along constant spin phase line P1 == spin period In Q-mode – nothing In B-mode – strong peak at ~0.46 cycles/P1 Observed 1/P3 is an alias of its real value of ~0.53 cycles/P1 (Deshpande & Rankin, 2000) Serylak et al 2009
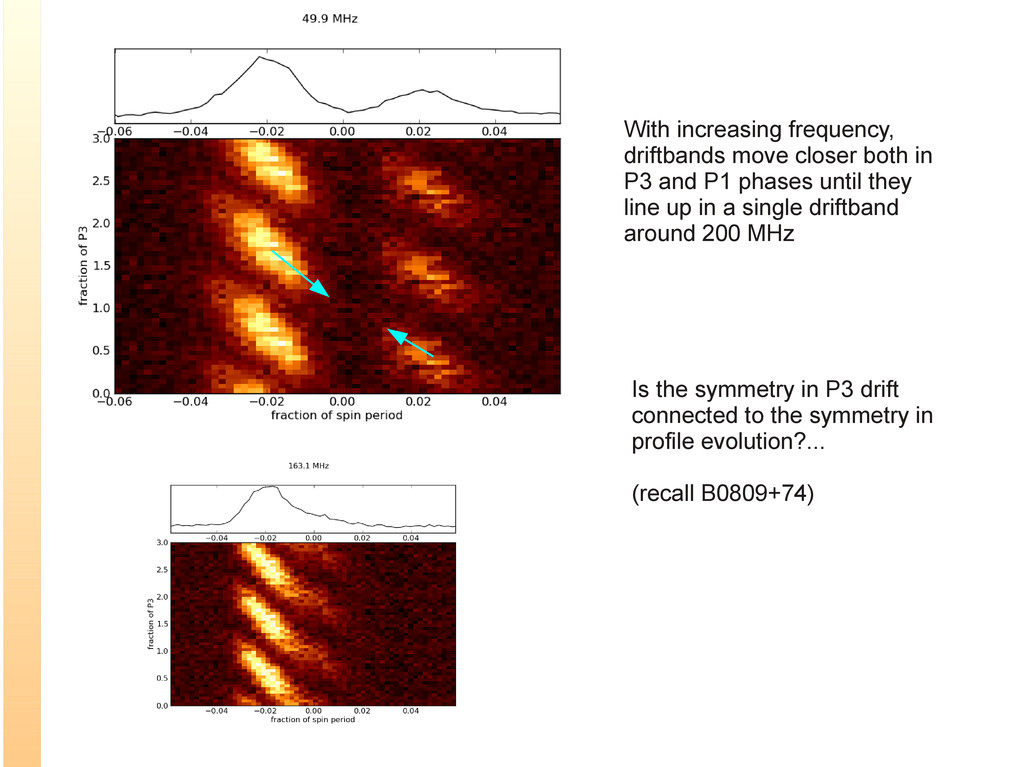
P1 phases until they line up in a single driftband around 200 MHz Is the symmetry in P3 drift connected to the symmetry in profile evolution?... (recall B0809+74)
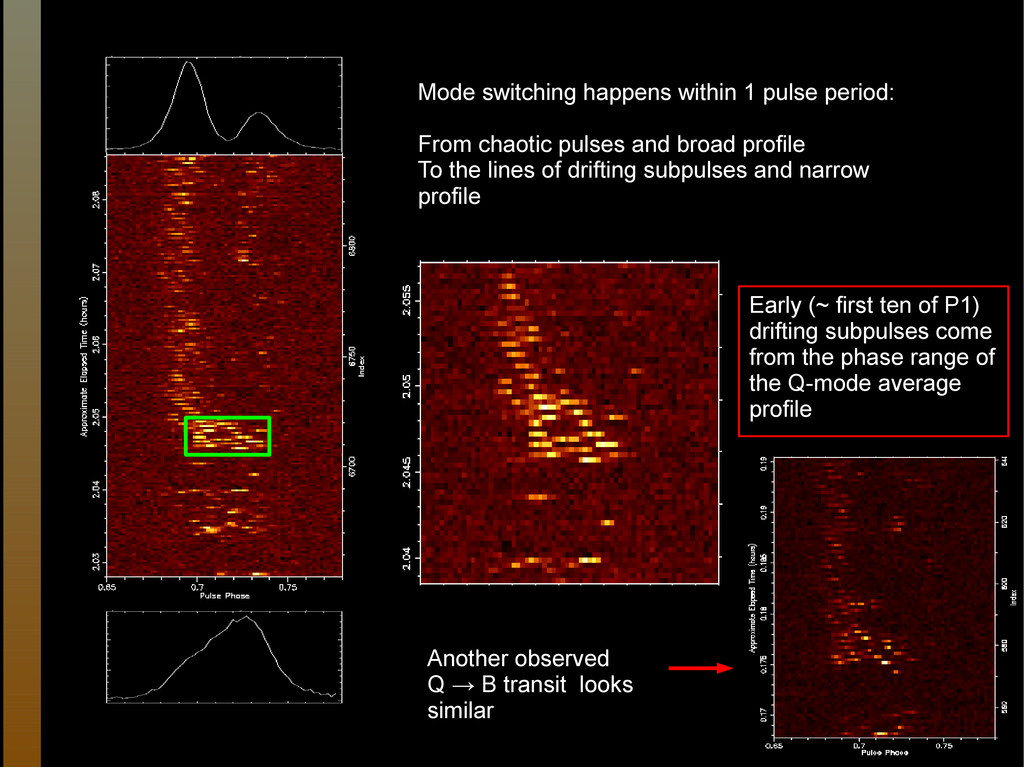
and broad profile To the lines of drifting subpulses and narrow profile Early (~ first ten of P1) drifting subpulses come from the phase range of the Q-mode average profile Another observed Q → B transit looks similar