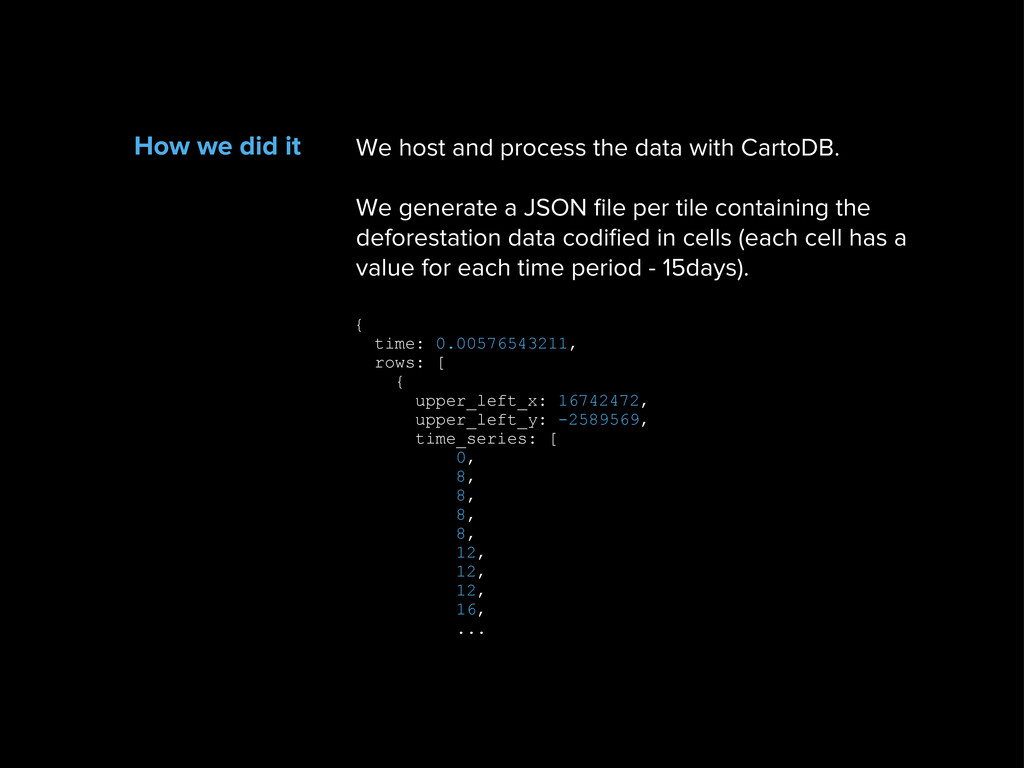
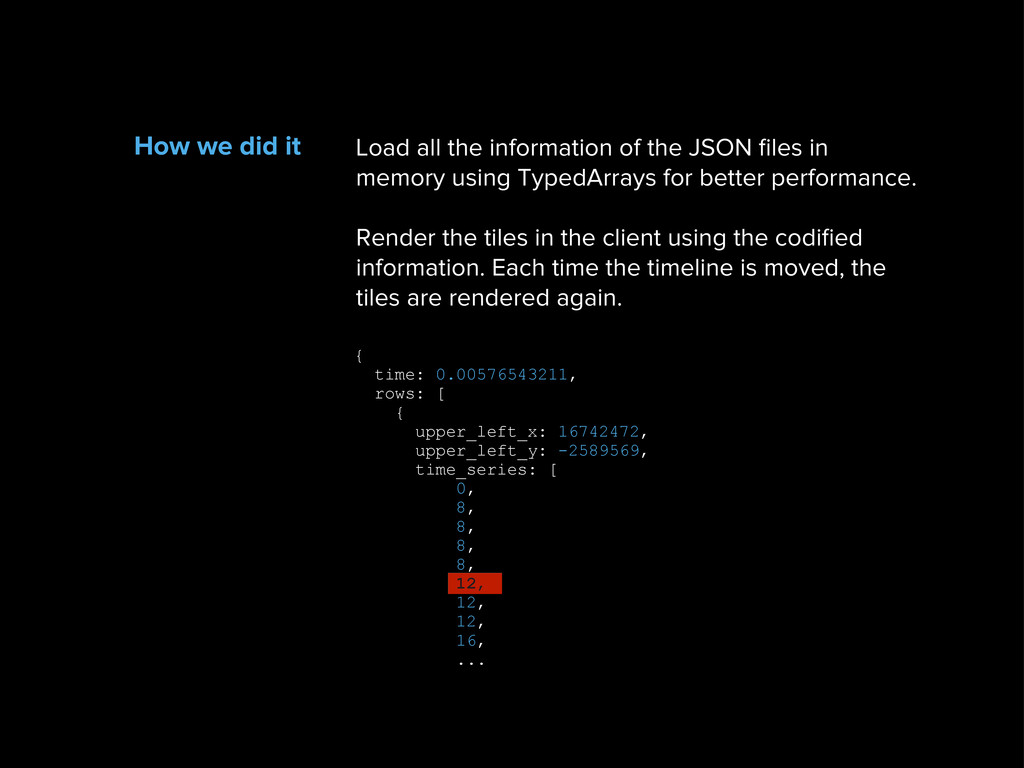
a JSON file per tile containing the deforestation data codified in cells (each cell has a value for each time period - 15days). How we did it { time: 0.00576543211, rows: [ { upper_left_x: 16742472, upper_left_y: -2589569, time_series: [ 0, 8, 8, 8, 8, 12, 12, 12, 16, ...
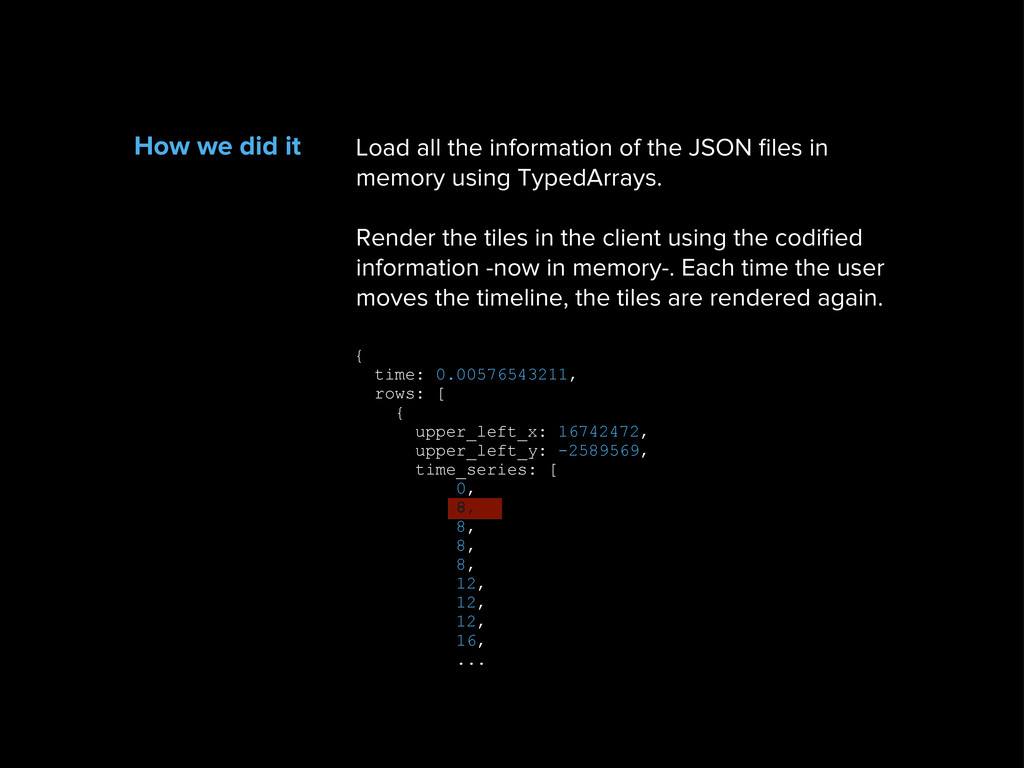
time_series: [ 0, 8, 8, 8, 8, 12, 12, 12, 16, ... Load all the information of the JSON files in memory using TypedArrays. Render the tiles in the client using the codified information -now in memory-. Each time the user moves the timeline, the tiles are rendered again. How we did it
time_series: [ 0, 8, 8, 8, 8, 12, 12, 12, 16, ... Load all the information of the JSON files in memory using TypedArrays for better performance. Render the tiles in the client using the codified information. Each time the timeline is moved, the tiles are rendered again. How we did it
time_series: [ 0, 8, 8, 8, 8, 12, 12, 12, 16, ... Load all the information of the JSON files in memory using TypedArrays for better performance. Render the tiles in the client using the codified information. Each time the timeline is moved, the tiles are rendered again. How we did it
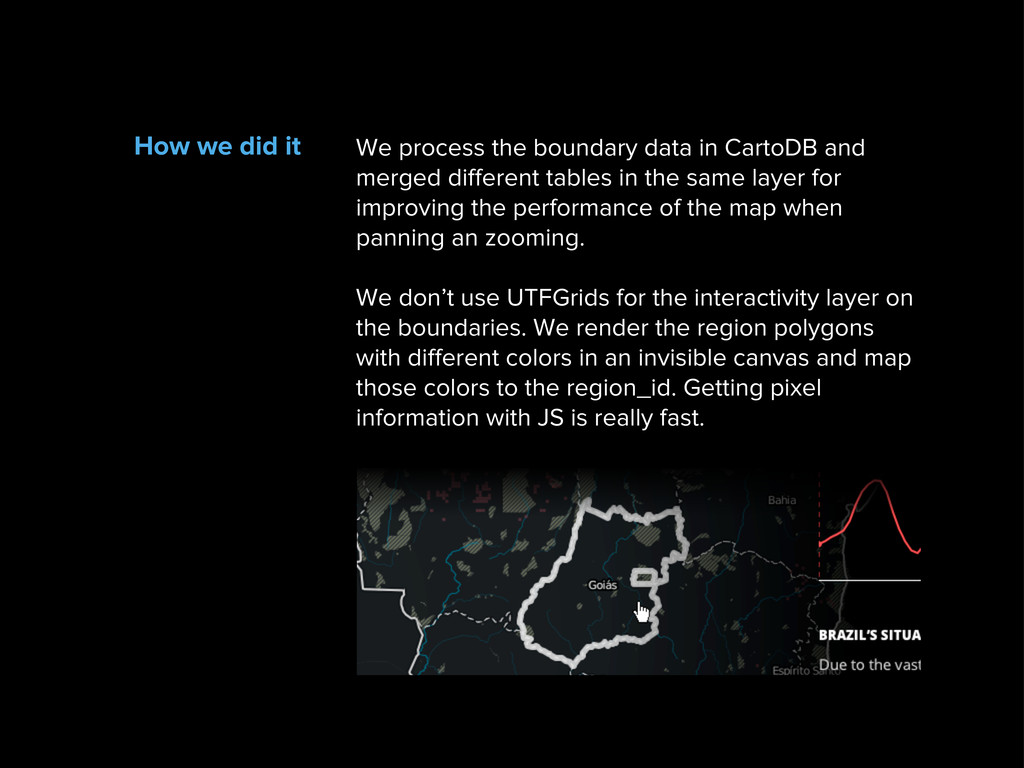
tables in the same layer for improving the performance of the map when panning an zooming. We don’t use UTFGrids for the interactivity layer on the boundaries. We render the region polygons with different colors in an invisible canvas and map those colors to the region_id. Getting pixel information with JS is really fast. How we did it
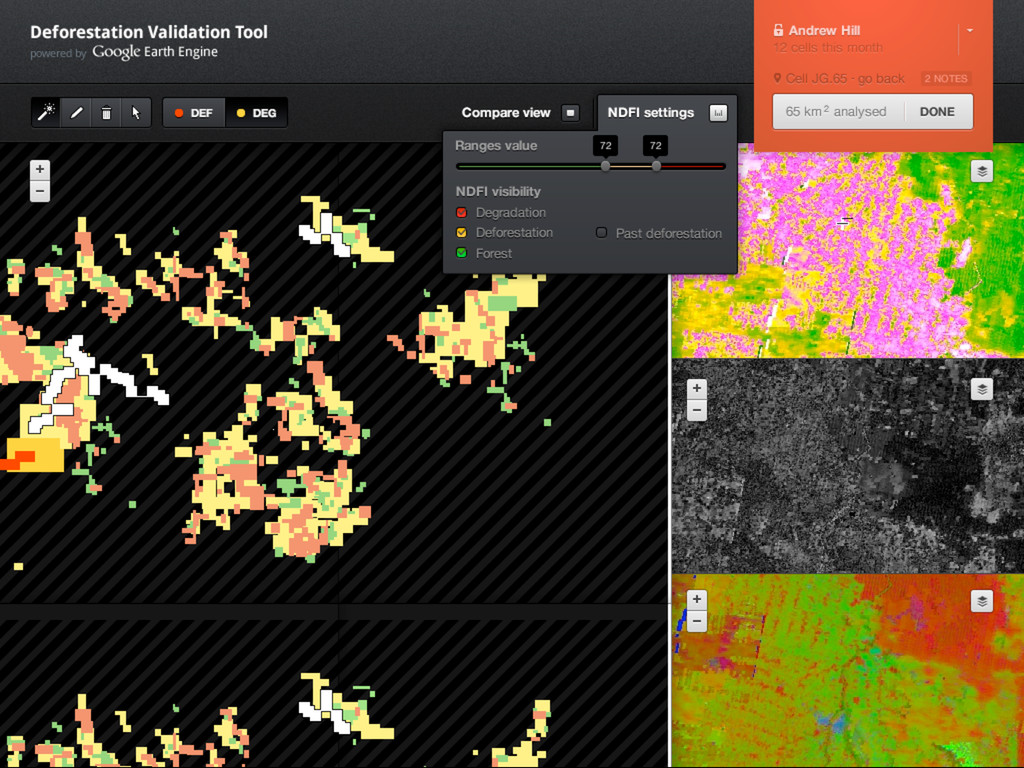
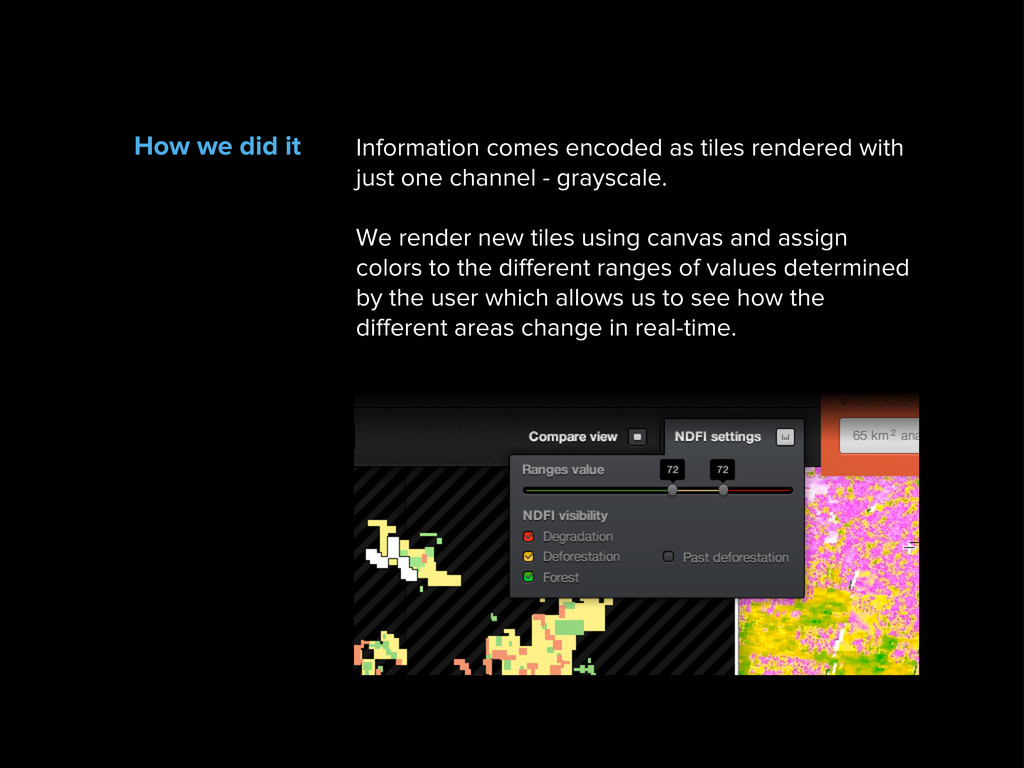
- grayscale. We render new tiles using canvas and assign colors to the different ranges of values determined by the user which allows us to see how the different areas change in real-time. How we did it
create a polygon over an area with just a click. It just detect adjacent pixels with similar colors and draws a polygon round them using several simplifying algorithms. How we did it