Share
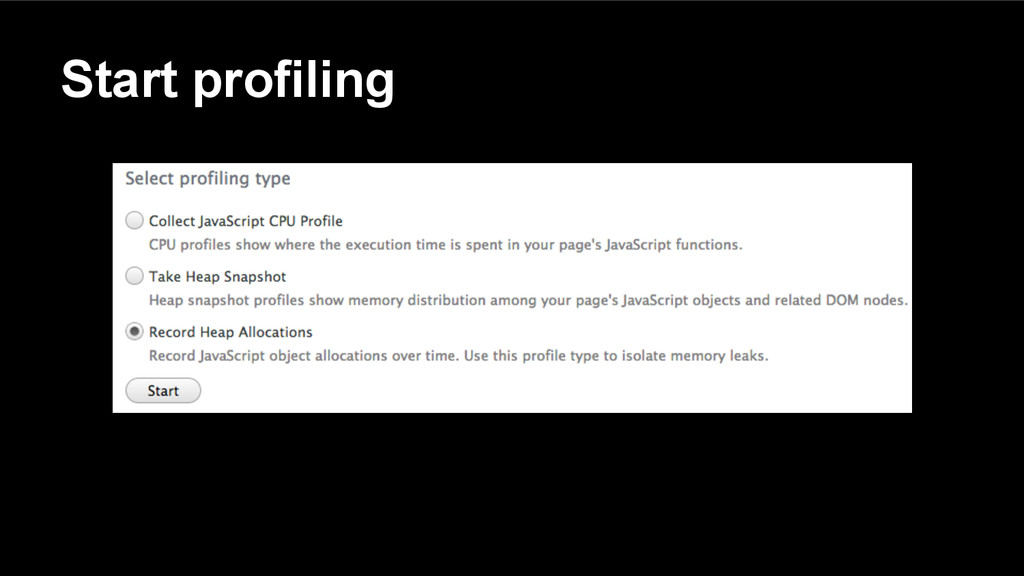
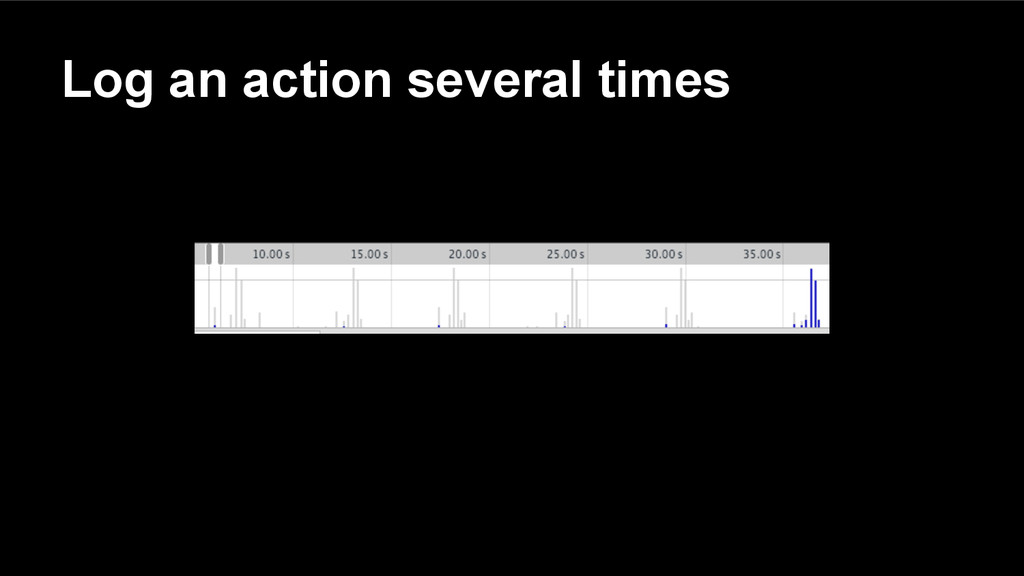
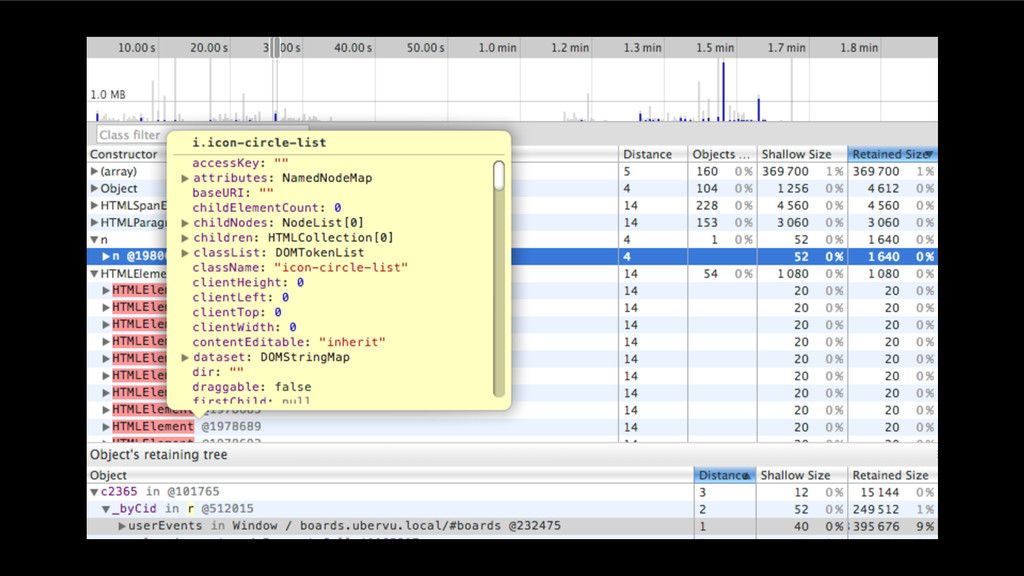
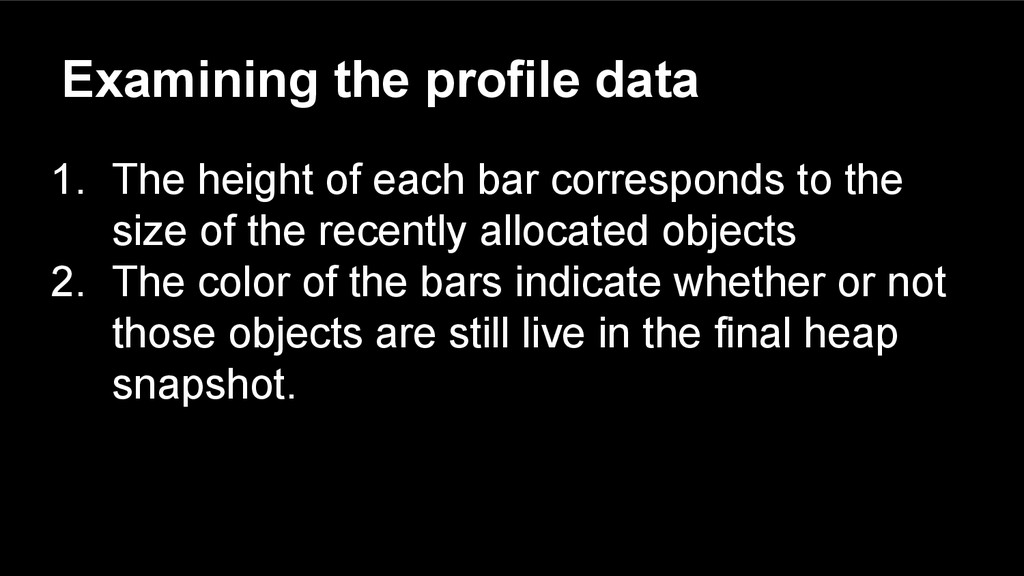
It's a short presentation based on "Finding Memory Leaks with the DevTools Heap Profiler" section from this article: http://www.html5rocks.com/en/tutorials/memory/effectivemanagement/


 akihisaikeda
 colorful12
 syumai
 n_takehata
 sylph01
 kenjiyoneyama
 yukiny
 akase244
 kmars0605
 prota
 neuecc
 kishida
 deanohume
 rasmusluckow
 chriscoyier
 sabderemane
 leimatthew05
 aleyda
 kimpetersen
 seathinner
 addyosmani
 bkeepers
 speakerdeck
 lindahogenes