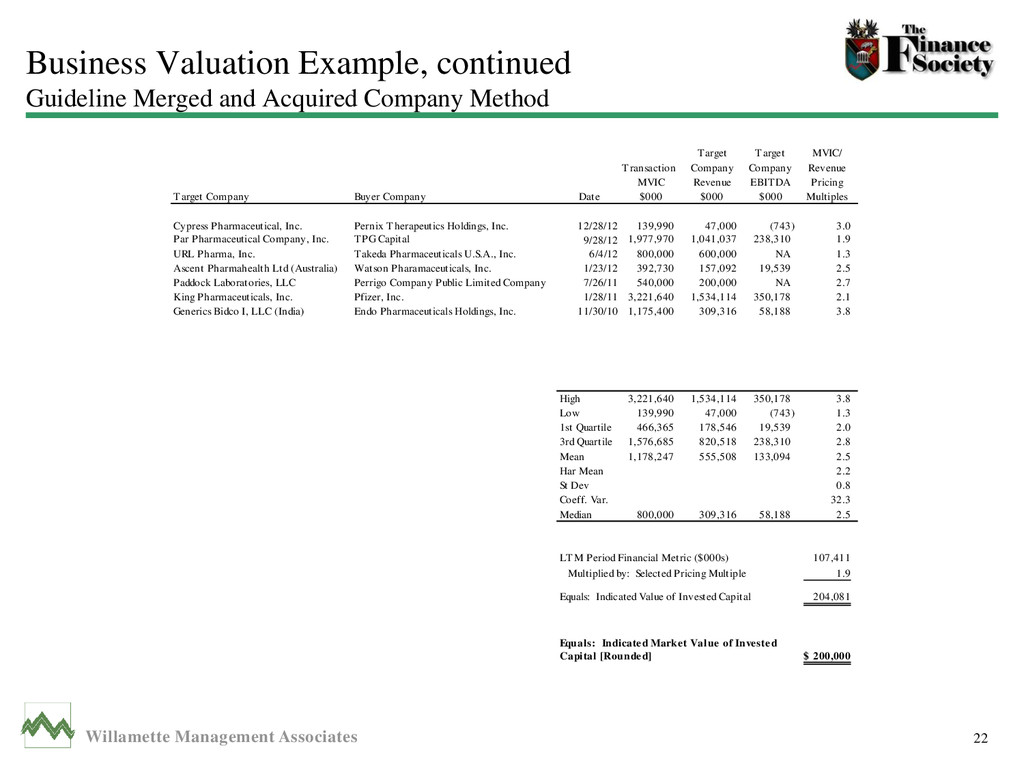
Acquired Company Method 22 Target Target MVIC/ Transaction Company Company Revenue MVIC Revenue EBITDA Pricing Target Company Buyer Company Date $000 $000 $000 Multiples Cypress Pharmaceutical, Inc. Pernix Therapeutics Holdings, Inc. 12/28/12 139,990 47,000 (743) 3.0 Par Pharmaceutical Company, Inc. TPG Capital 9/28/12 1,977,970 1,041,037 238,310 1.9 URL Pharma, Inc. Takeda Pharmaceuticals U.S.A., Inc. 6/4/12 800,000 600,000 NA 1.3 Ascent Pharmahealth Ltd (Australia) Watson Pharamaceuticals, Inc. 1/23/12 392,730 157,092 19,539 2.5 Paddock Laboratories, LLC Perrigo Company Public Limited Company 7/26/11 540,000 200,000 NA 2.7 King Pharmaceuticals, Inc. Pfizer, Inc. 1/28/11 3,221,640 1,534,114 350,178 2.1 Generics Bidco I, LLC (India) Endo Pharmaceuticals Holdings, Inc. 11/30/10 1,175,400 309,316 58,188 3.8 High 3,221,640 1,534,114 350,178 3.8 Low 139,990 47,000 (743) 1.3 1st Quartile 466,365 178,546 19,539 2.0 3rd Quartile 1,576,685 820,518 238,310 2.8 Mean 1,178,247 555,508 133,094 2.5 Har Mean 2.2 St Dev 0.8 Coeff. Var. 32.3 Median 800,000 309,316 58,188 2.5 LTM Period Financial Metric ($000s) 107,411 Multiplied by: Selected Pricing Multiple 1.9 Equals: Indicated Value of Invested Capital 204,081 200,000 $ Equals: Indicated Market Value of Invested Capital [Rounded]