Upgrade to Pro — share decks privately, control downloads, hide ads and more …

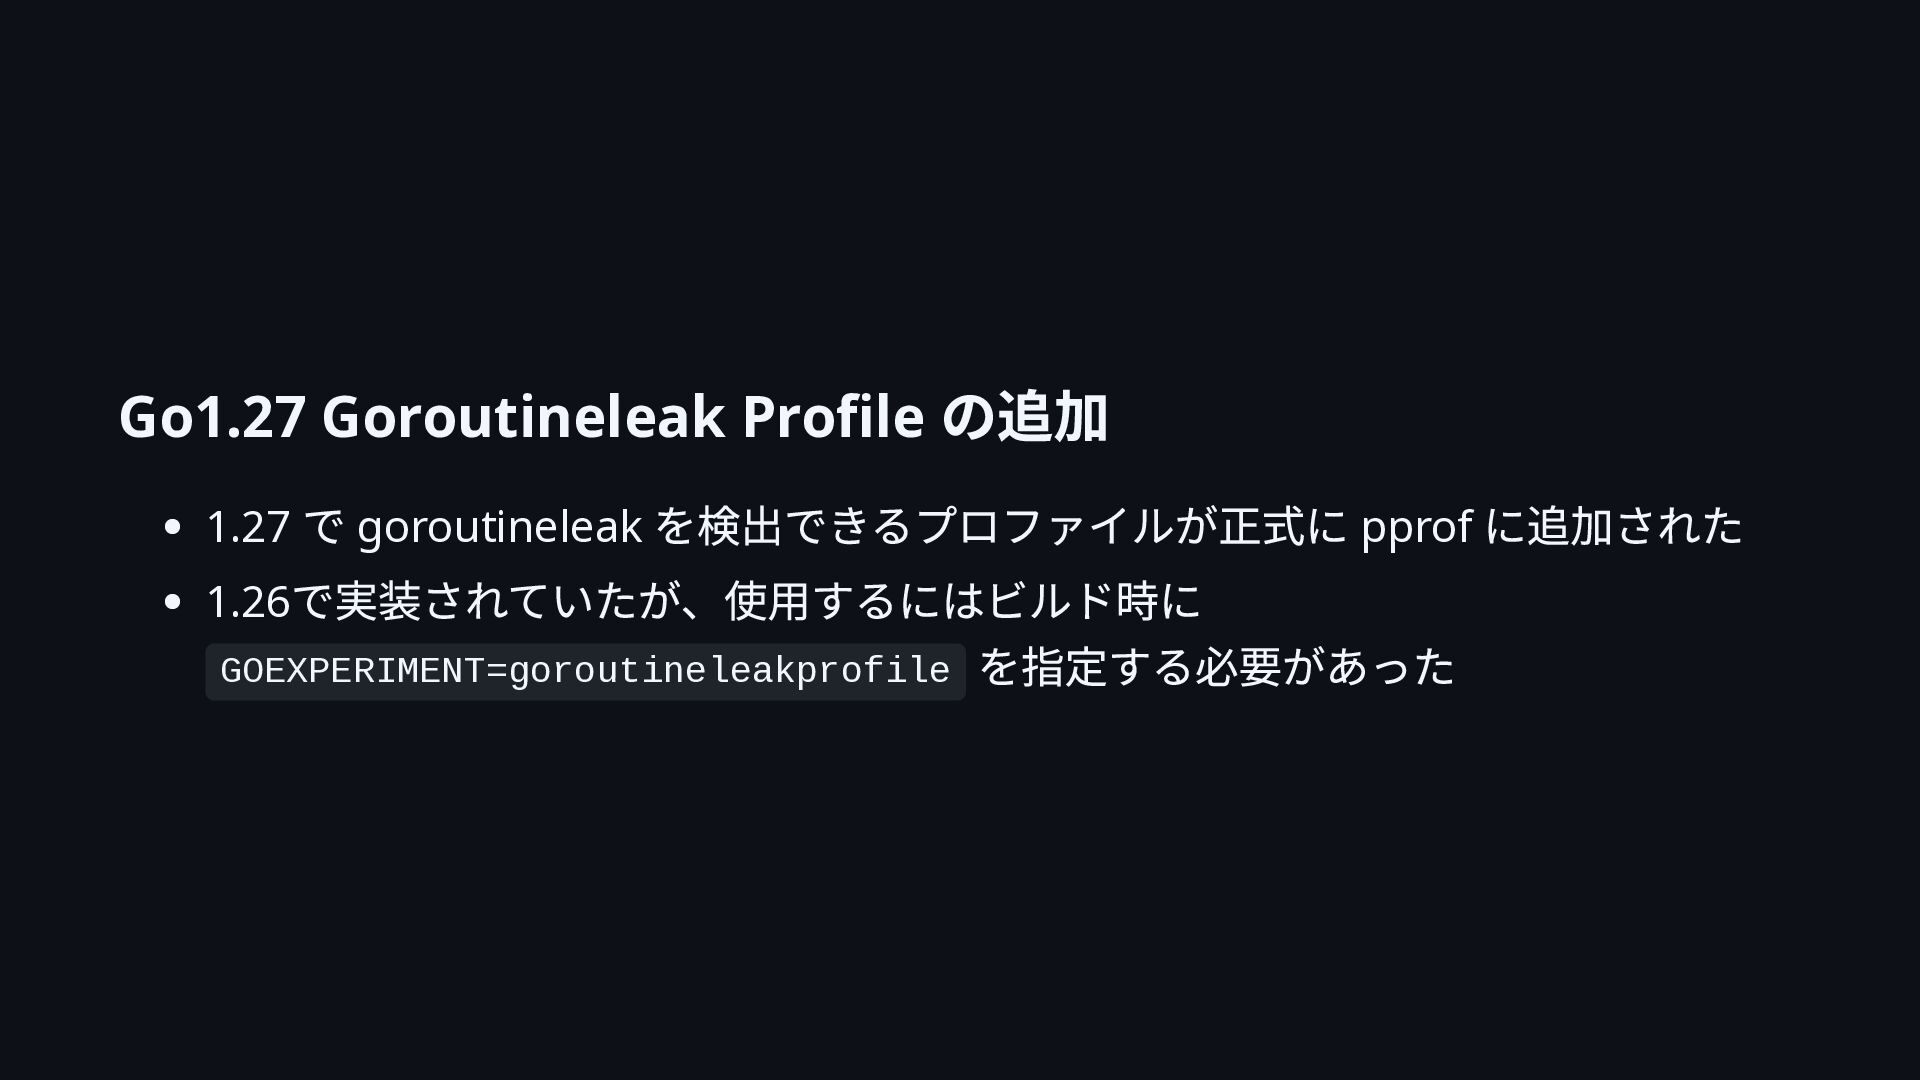
Go 1.27.0 Goroutine Profile

Sponsored · Your Podcast. Everywhere. Effortlessly. Share. Educate. Inspire. Entertain. You do you. We'll handle the rest. →
Avatar for 内野佑太郎 内野佑太郎
August 26, 2026
18

Go 1.27.0 Goroutine Profile

Avatar for 内野佑太郎

内野佑太郎

August 26, 2026

Transcript

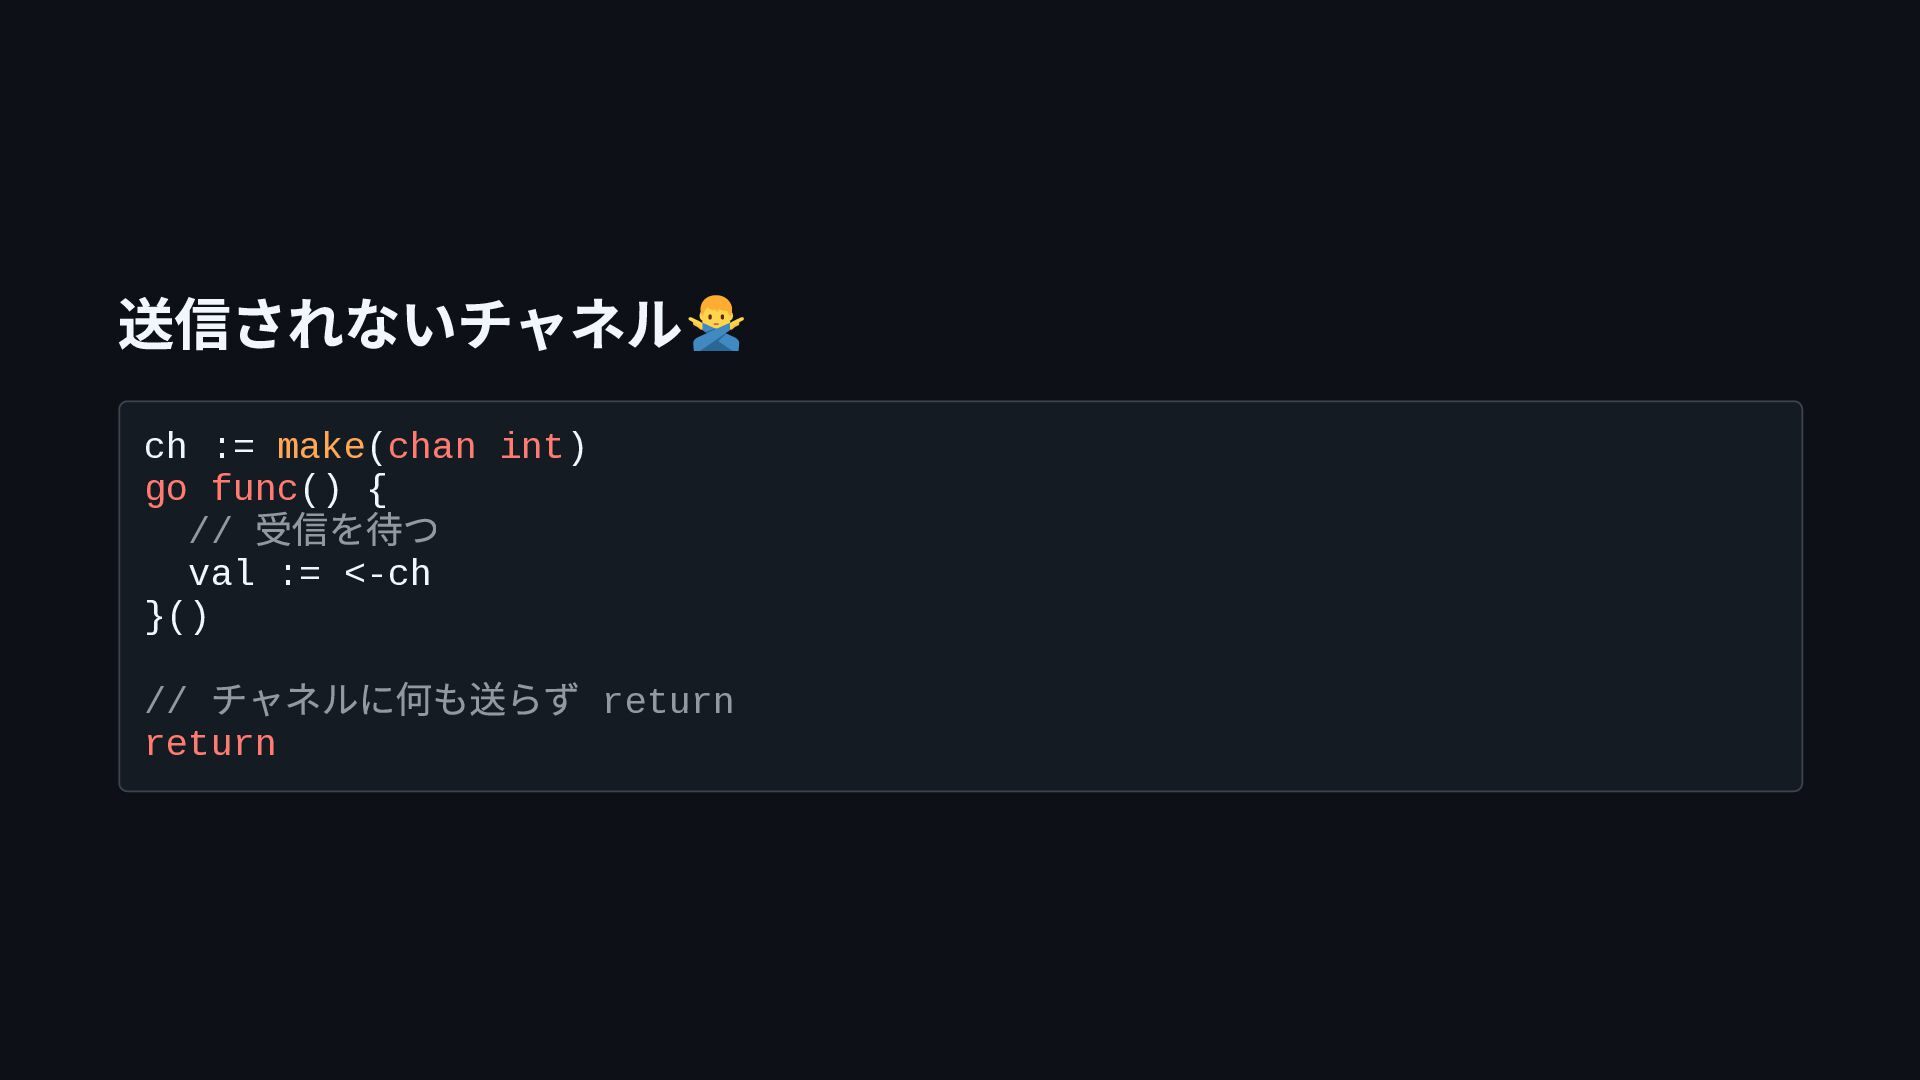
  1. 送信されないチャネル ch := make(chan int) go func() { // val

    := <-ch }() 受信を待つ チャネルに何も送らず return // return
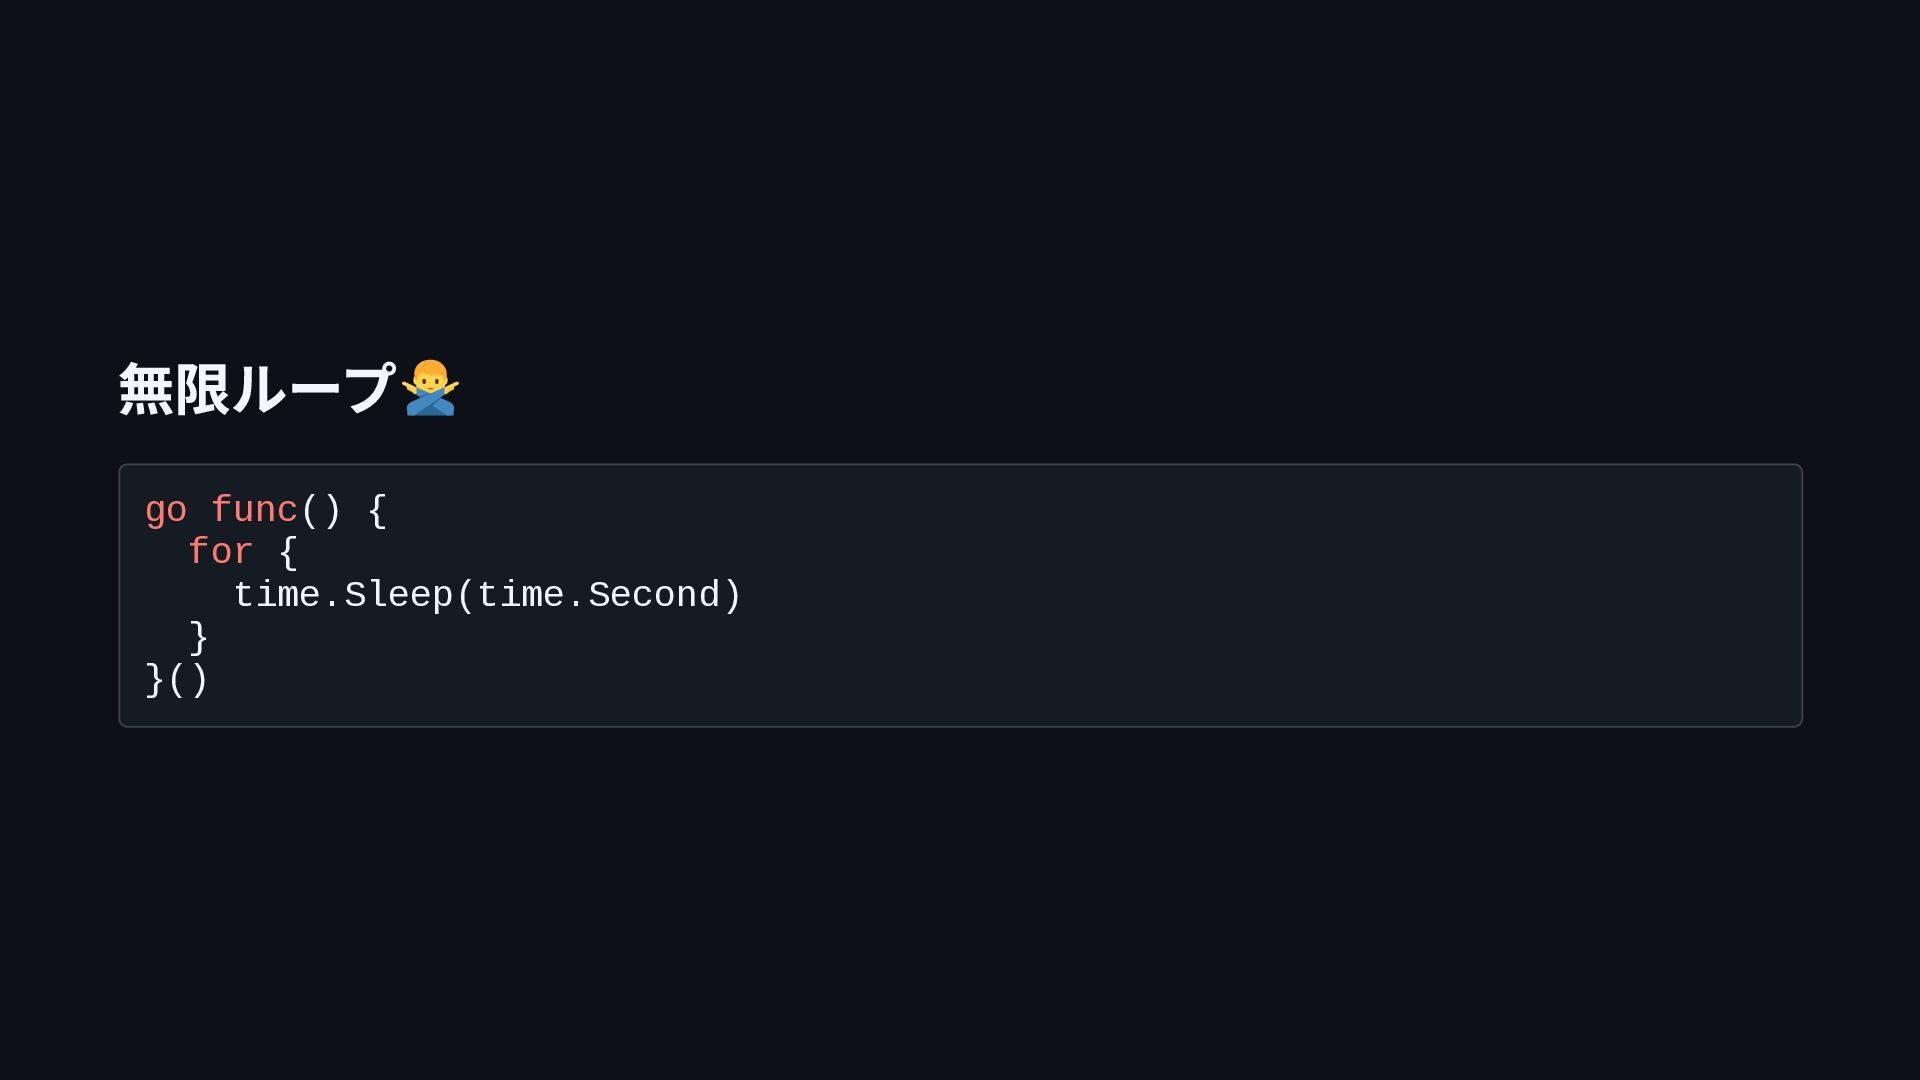
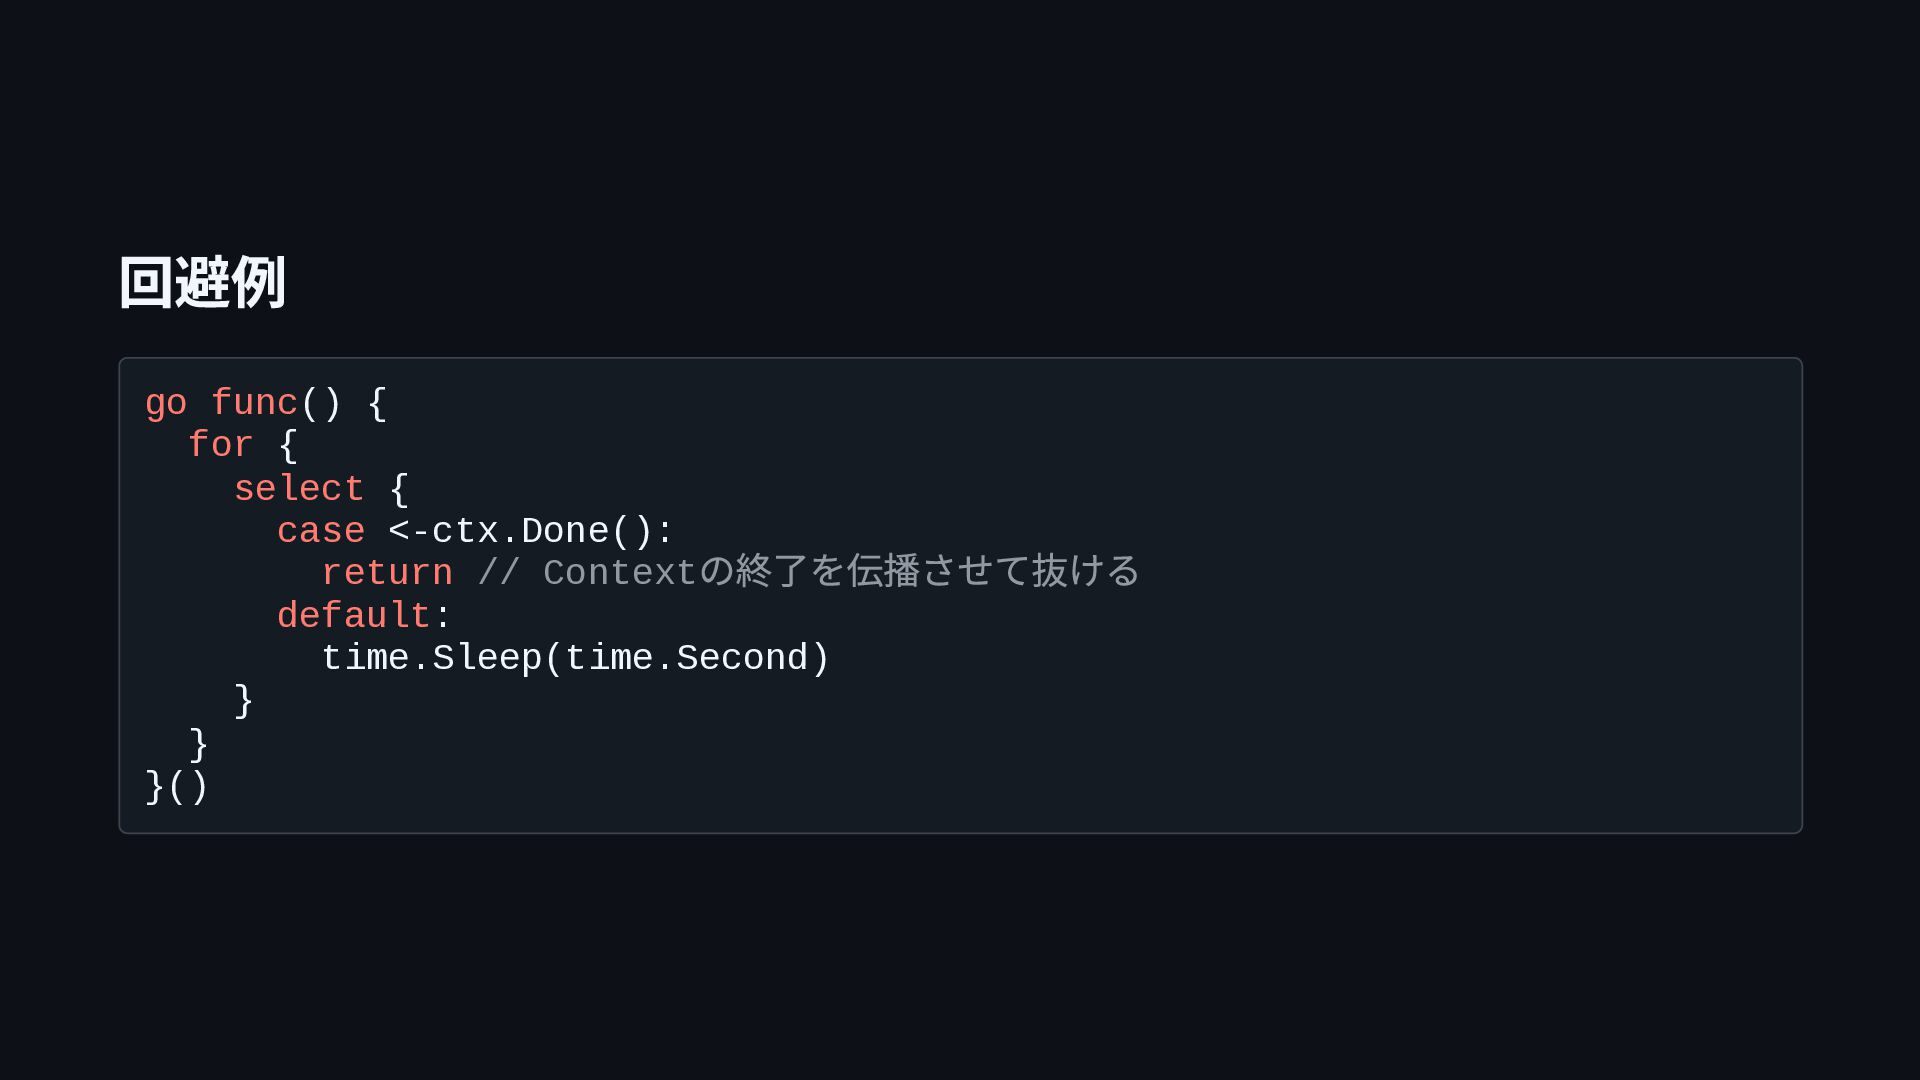
  2. 回避例 go func() { for { select { case <-ctx.Done():

    return // Context default: time.Sleep(time.Second) } } }() の終了を伝播させて抜ける
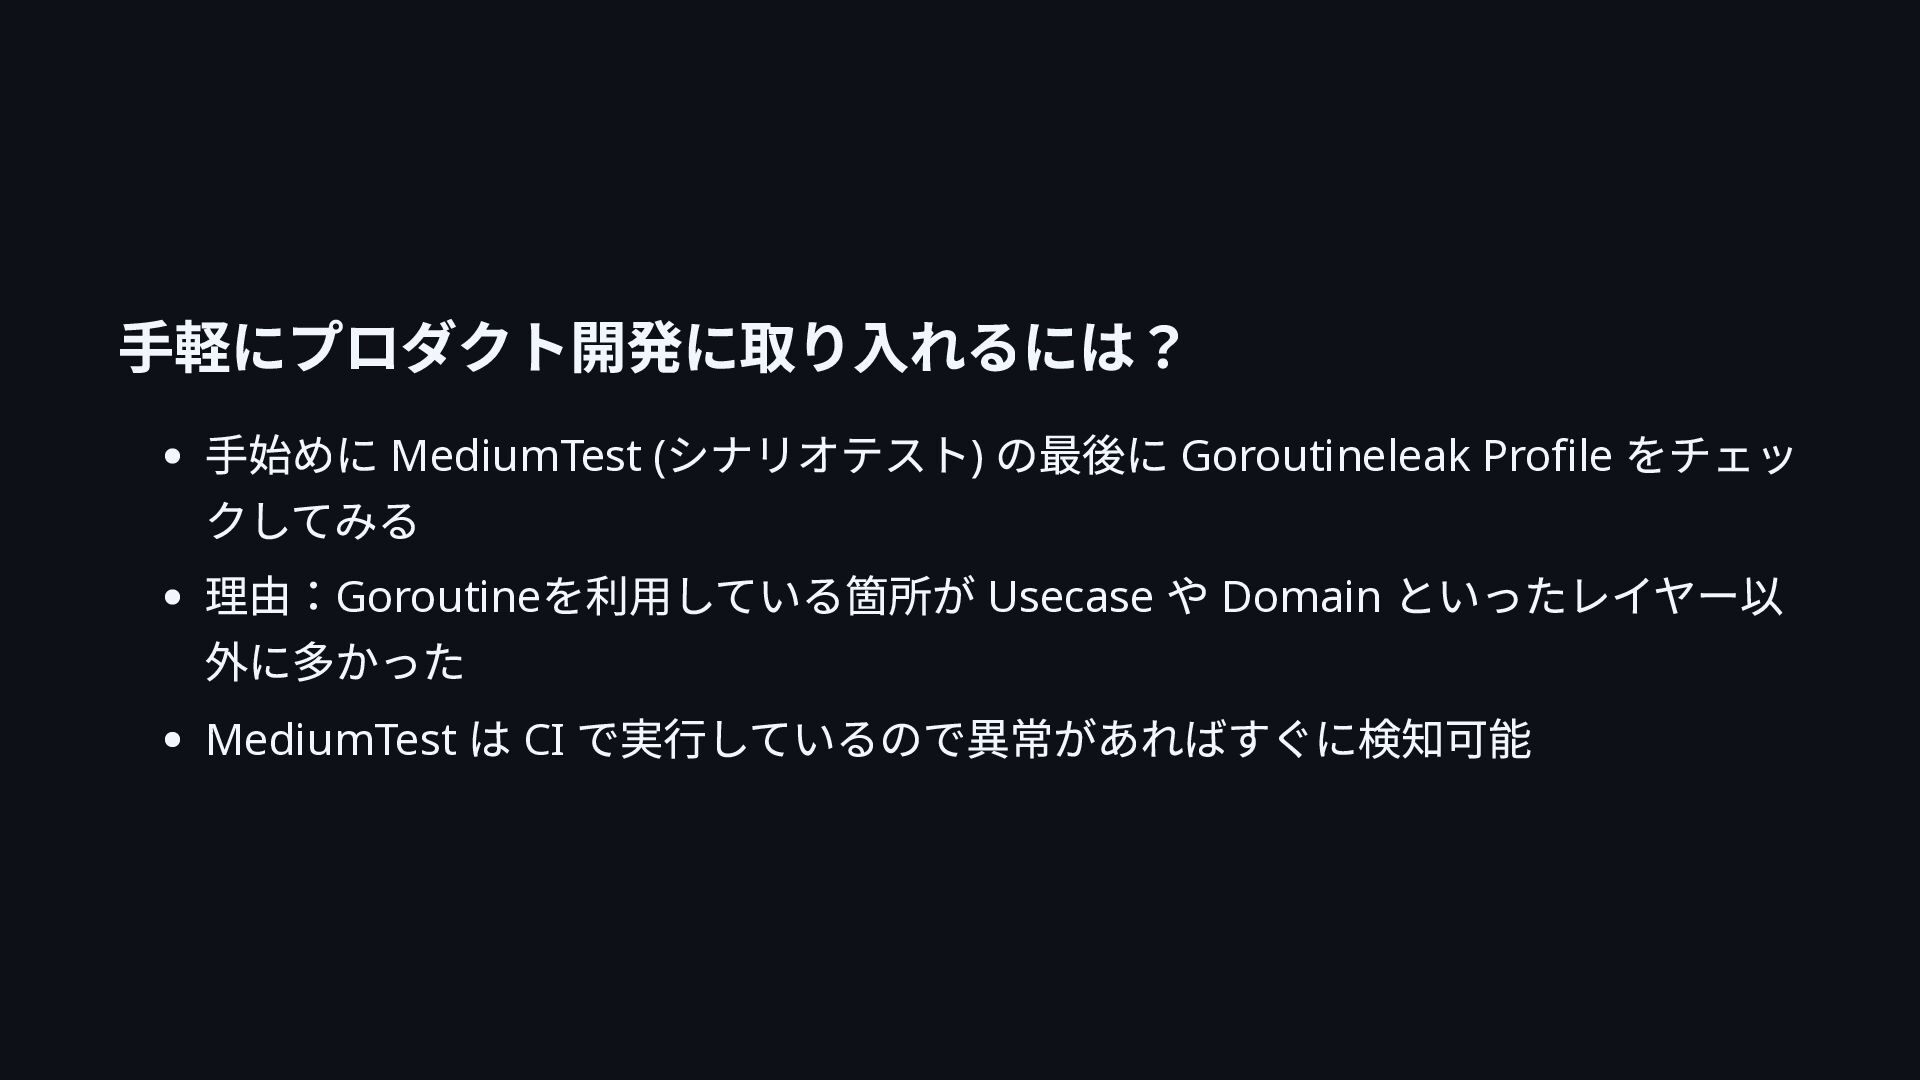
  3. 手軽にプロダクト開発に取り入れるには? 手始めに MediumTest (シナリオテスト) の最後に Goroutineleak Profile をチェッ クしてみる 理由:Goroutineを利用している箇所が

    Usecase や Domain といったレイヤー以 外に多かった MediumTest は CI で実行しているので異常があればすぐに検知可能
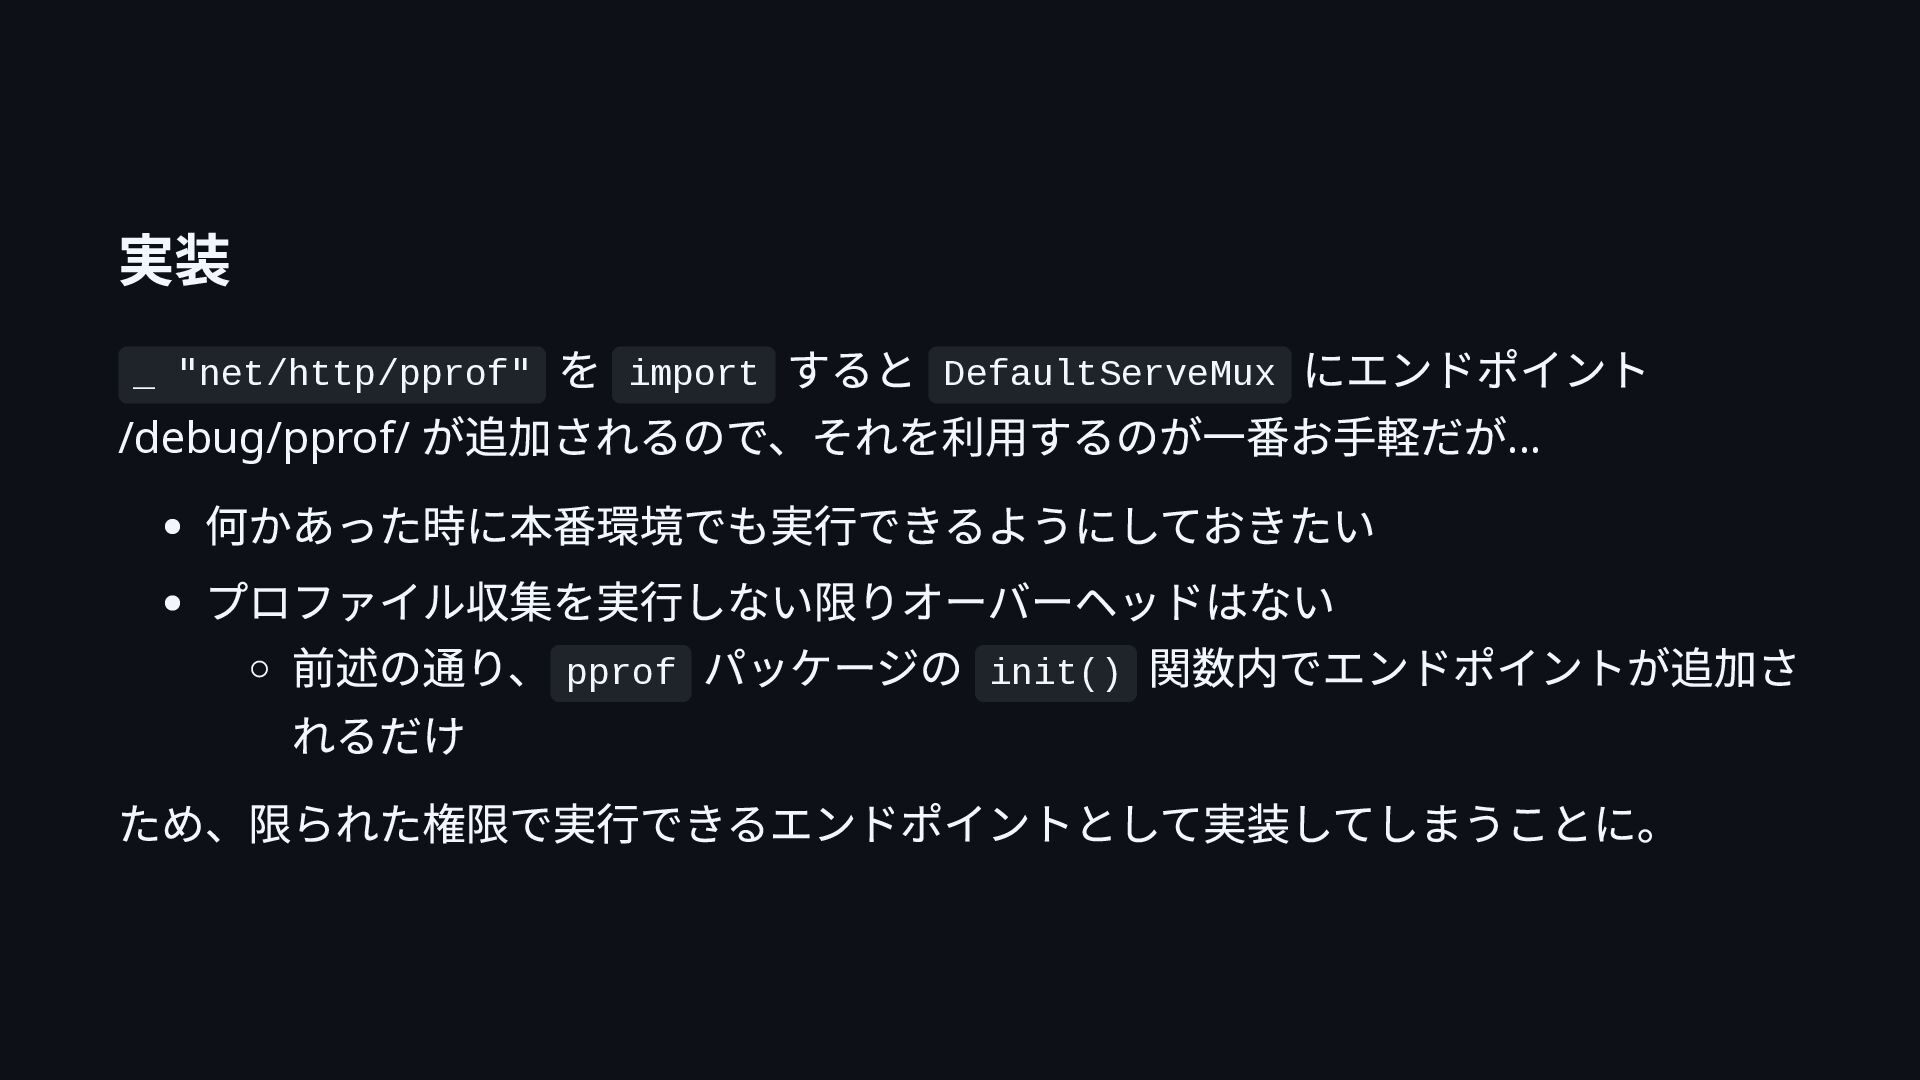
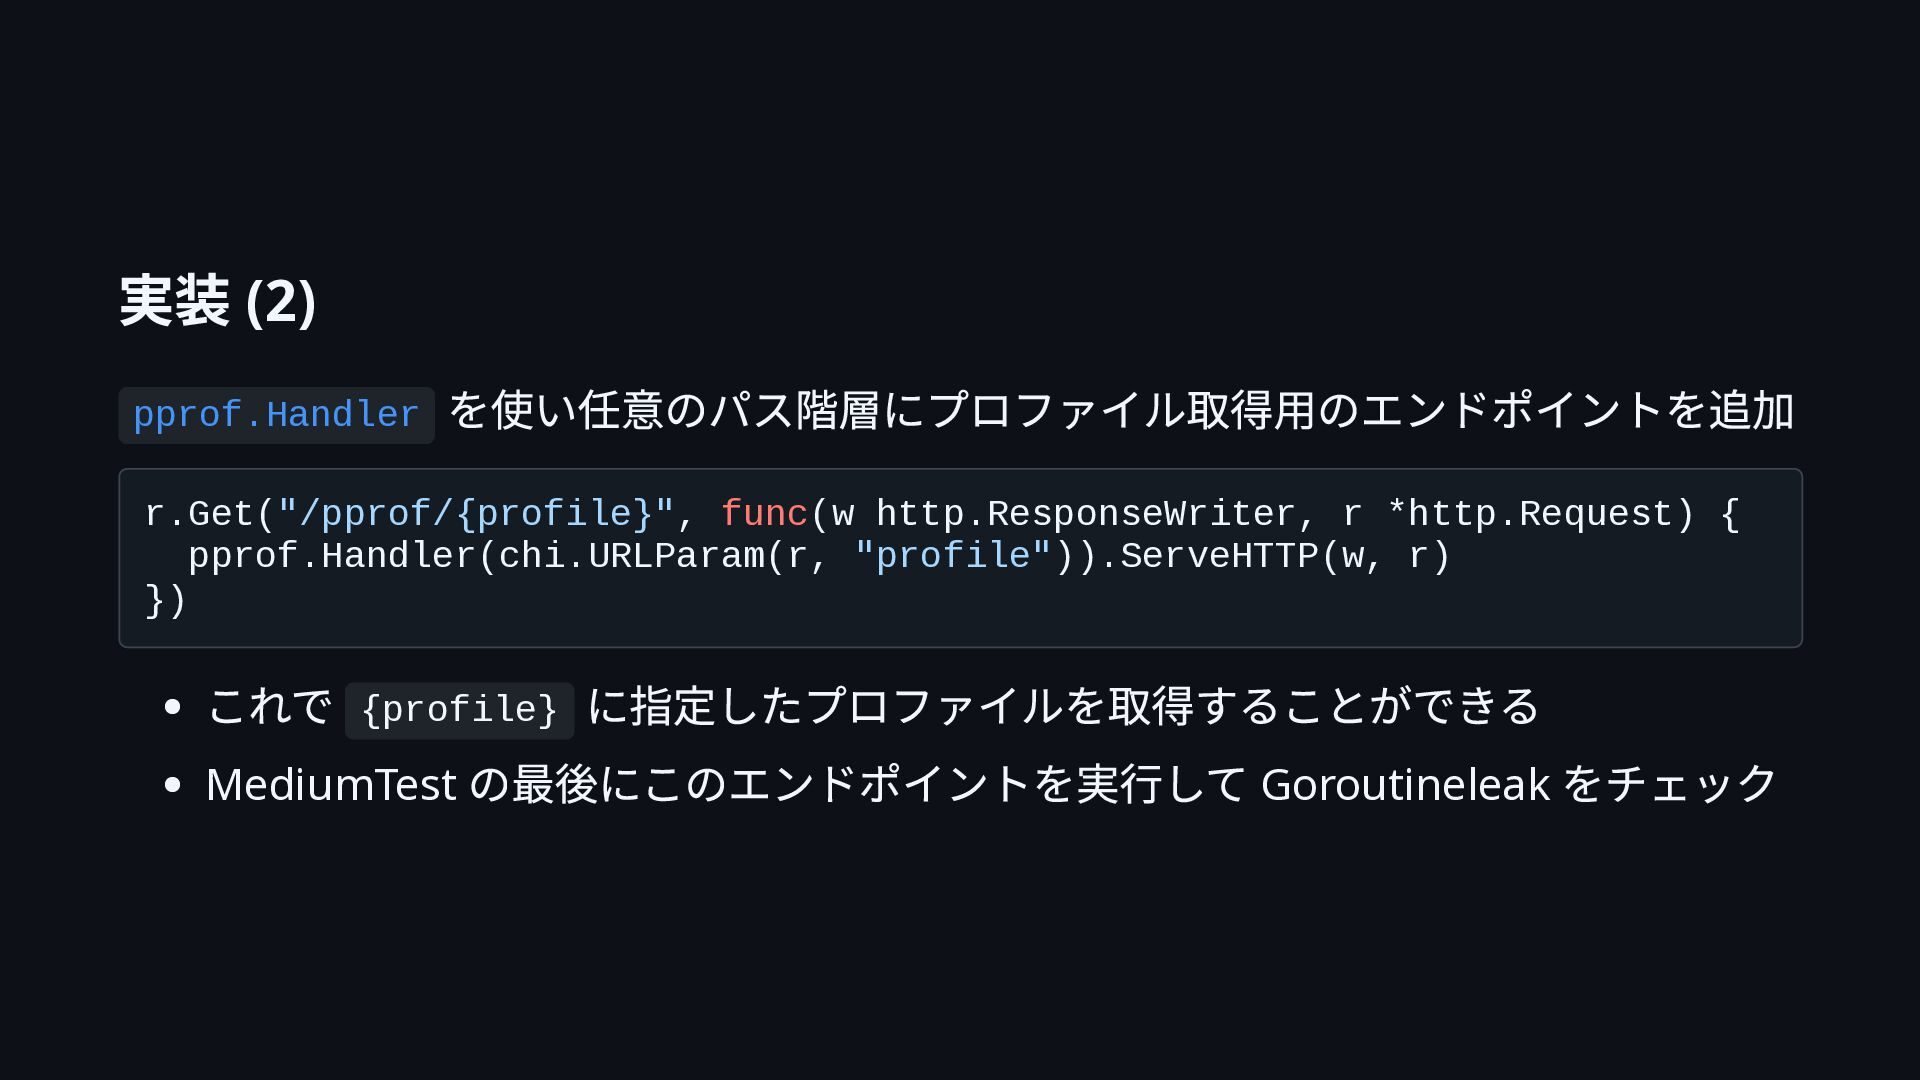
  4. 実装 を import すると DefaultServeMux にエンドポイント /debug/pprof/ が追加されるので、それを利用するのが一番お手軽だが... 何かあった時に本番環境でも実行できるようにしておきたい プロファイル収集を実行しない限りオーバーヘッドはない

    前述の通り、 pprof パッケージの init() 関数内でエンドポイントが追加さ れるだけ ため、限られた権限で実行できるエンドポイントとして実装してしまうことに。 _ "net/http/pprof"
  5. 実装 (2) pprof.Handler を使い任意のパス階層にプロファイル取得用のエンドポイントを追加 r.Get("/pprof/{profile}", func(w http.ResponseWriter, r *http.Request) {

    pprof.Handler(chi.URLParam(r, "profile")).ServeHTTP(w, r) }) これで {profile} に指定したプロファイルを取得することができる MediumTest の最後にこのエンドポイントを実行して Goroutineleak をチェック
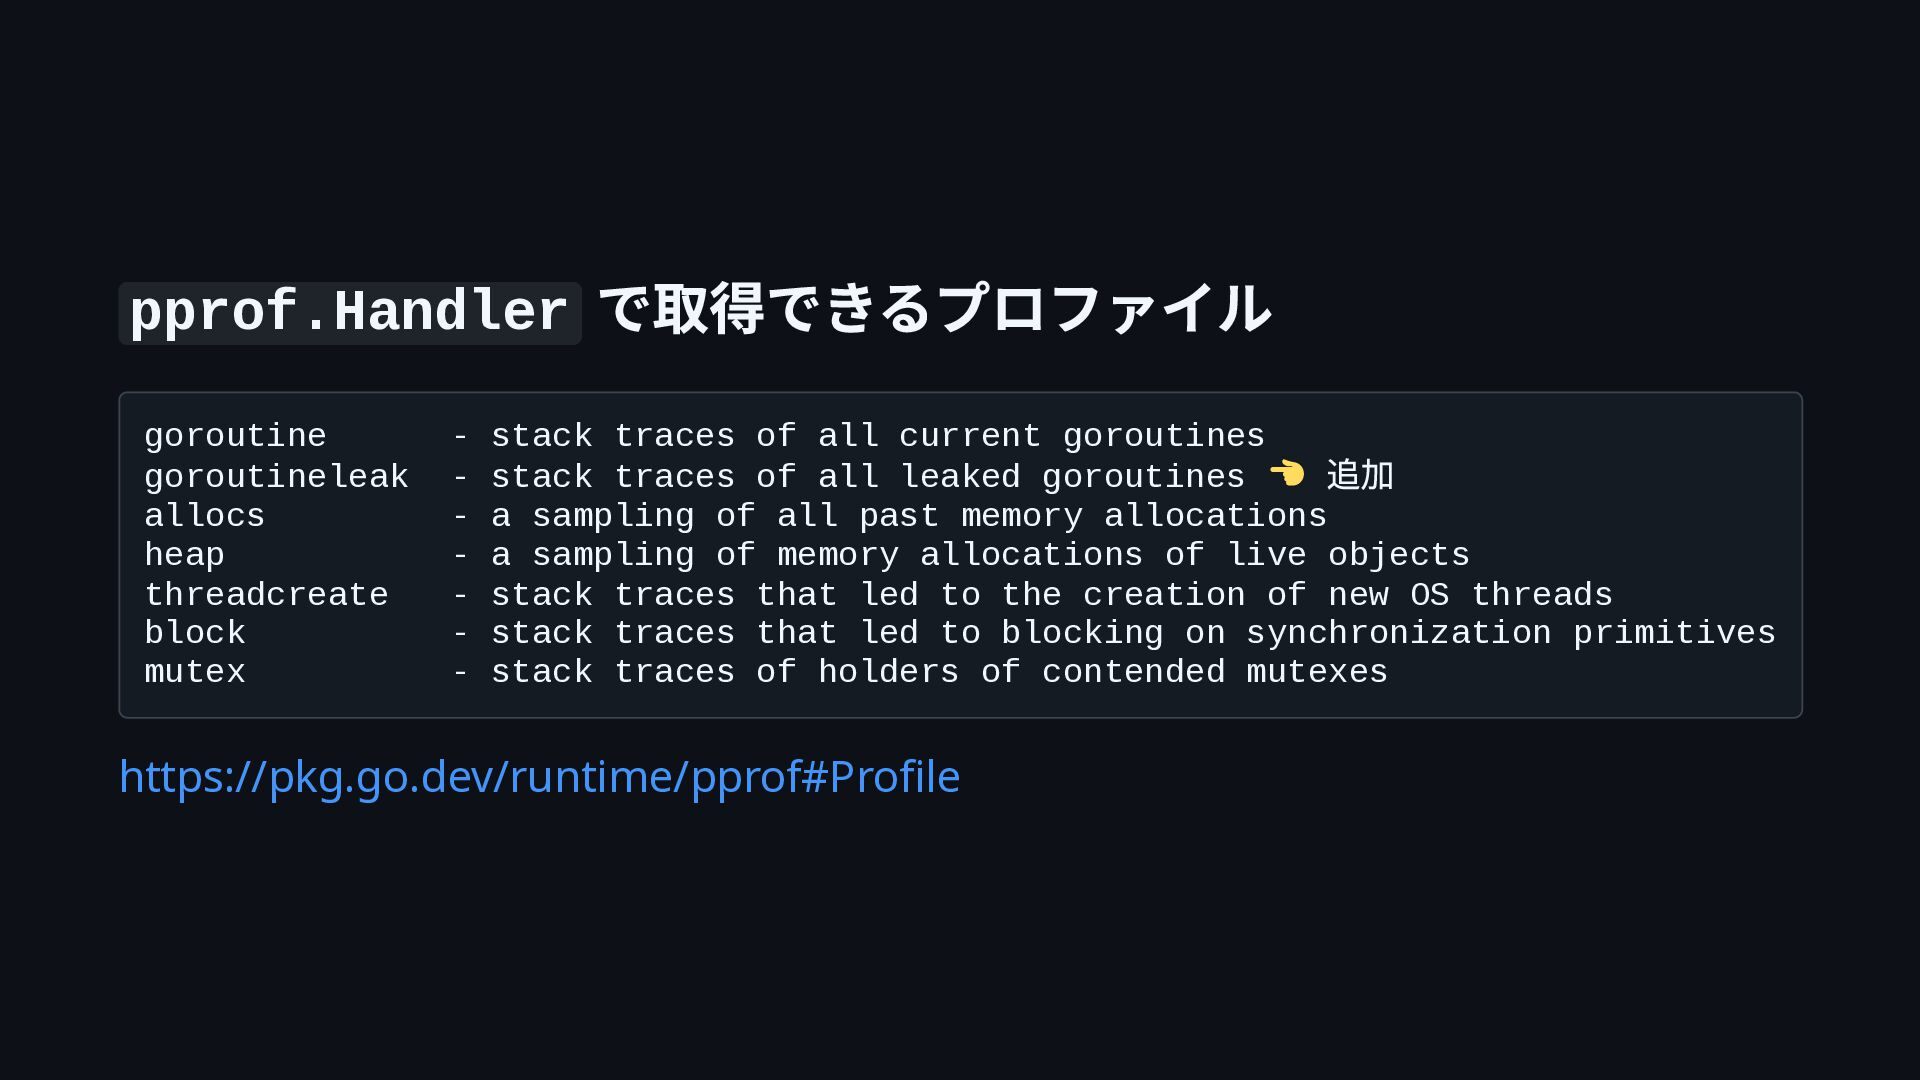
  6. pprof.Handler goroutine goroutineleak allocs heap threadcreate block mutex で取得できるプロファイル -

    stack traces of all current goroutines - stack traces of all leaked goroutines - a sampling of all past memory allocations - a sampling of memory allocations of live objects - stack traces that led to the creation of new OS threads - stack traces that led to blocking on synchronization primitives - stack traces of holders of contended mutexes https://pkg.go.dev/runtime/pprof#Profile 追加
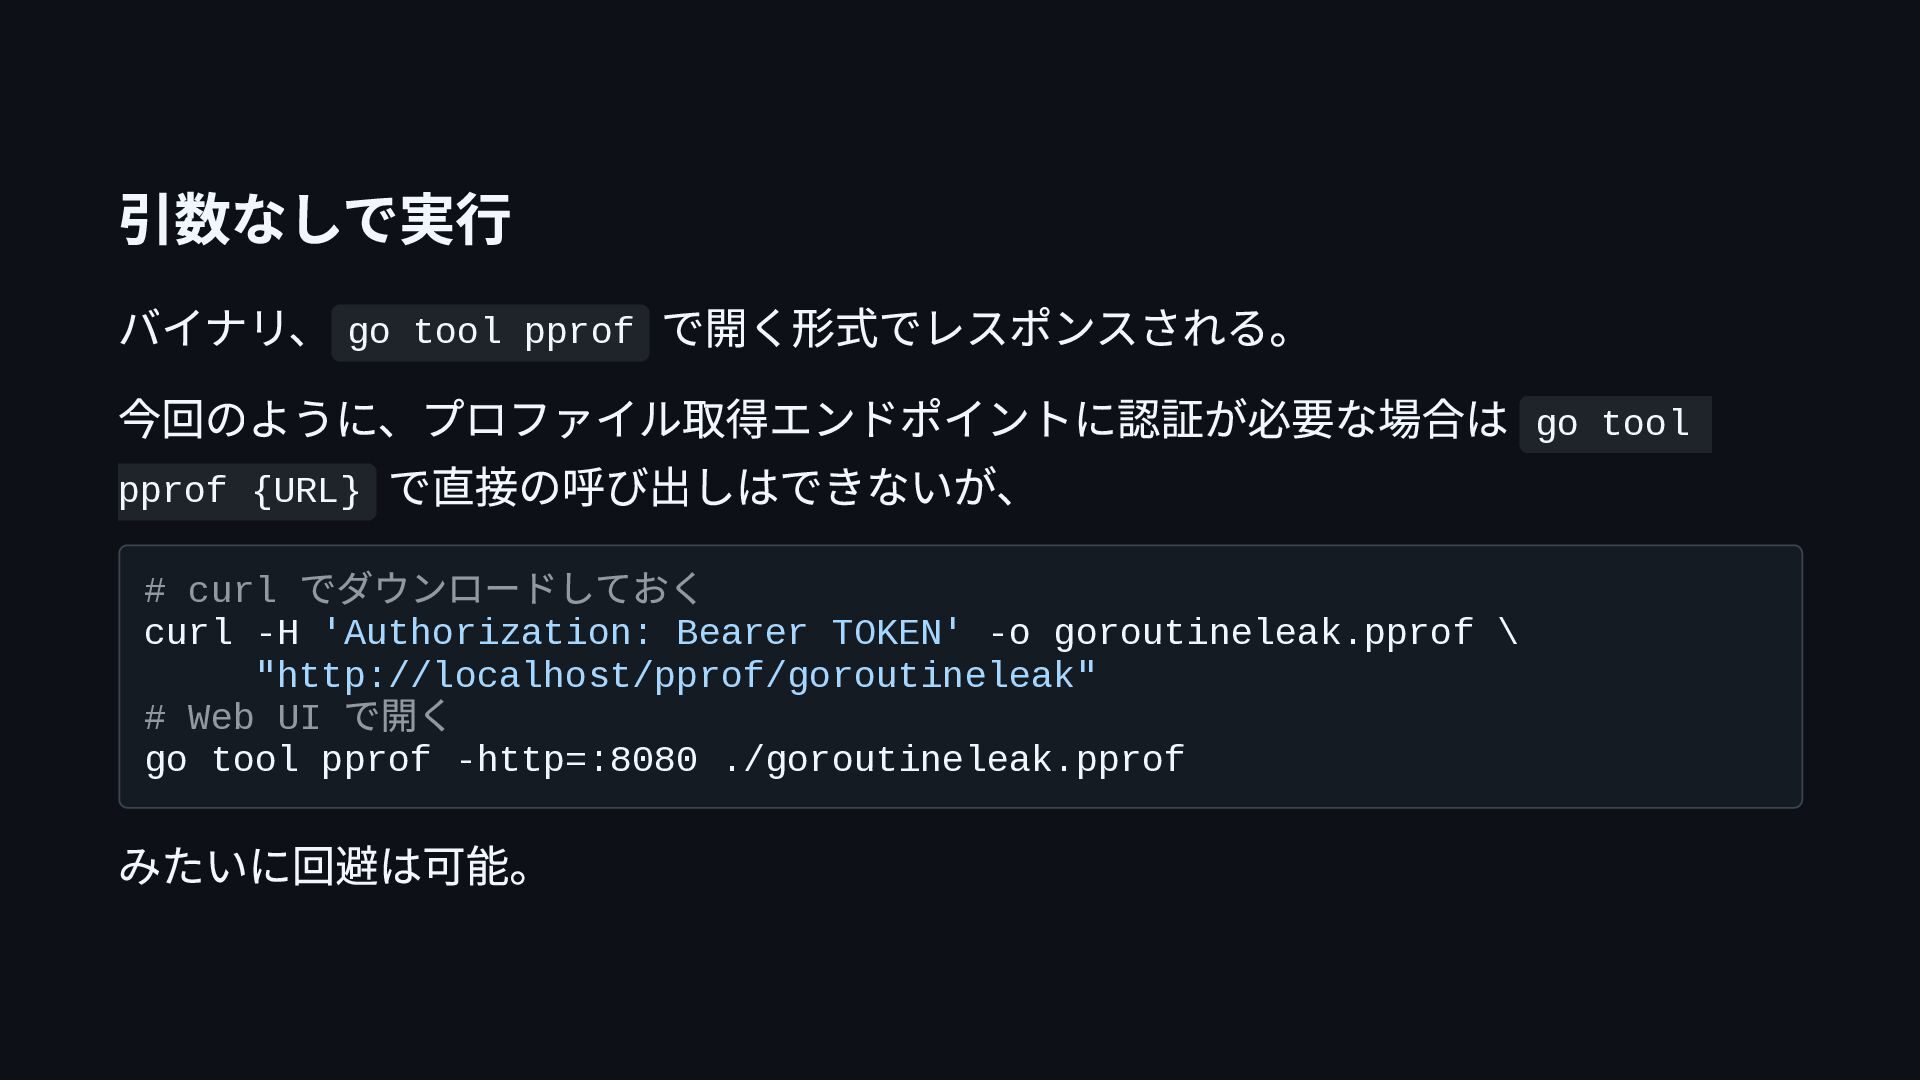
  7. 引数なしで実行 バイナリ、 go tool pprof で開く形式でレスポンスされる。 今回のように、プロファイル取得エンドポイントに認証が必要な場合は go tool pprof

    {URL} で直接の呼び出しはできないが、 でダウンロードしておく # curl curl -H 'Authorization: Bearer TOKEN' -o goroutineleak.pprof \ "http://localhost/pprof/goroutineleak" # Web UI go tool pprof -http=:8080 ./goroutineleak.pprof で開く みたいに回避は可能。
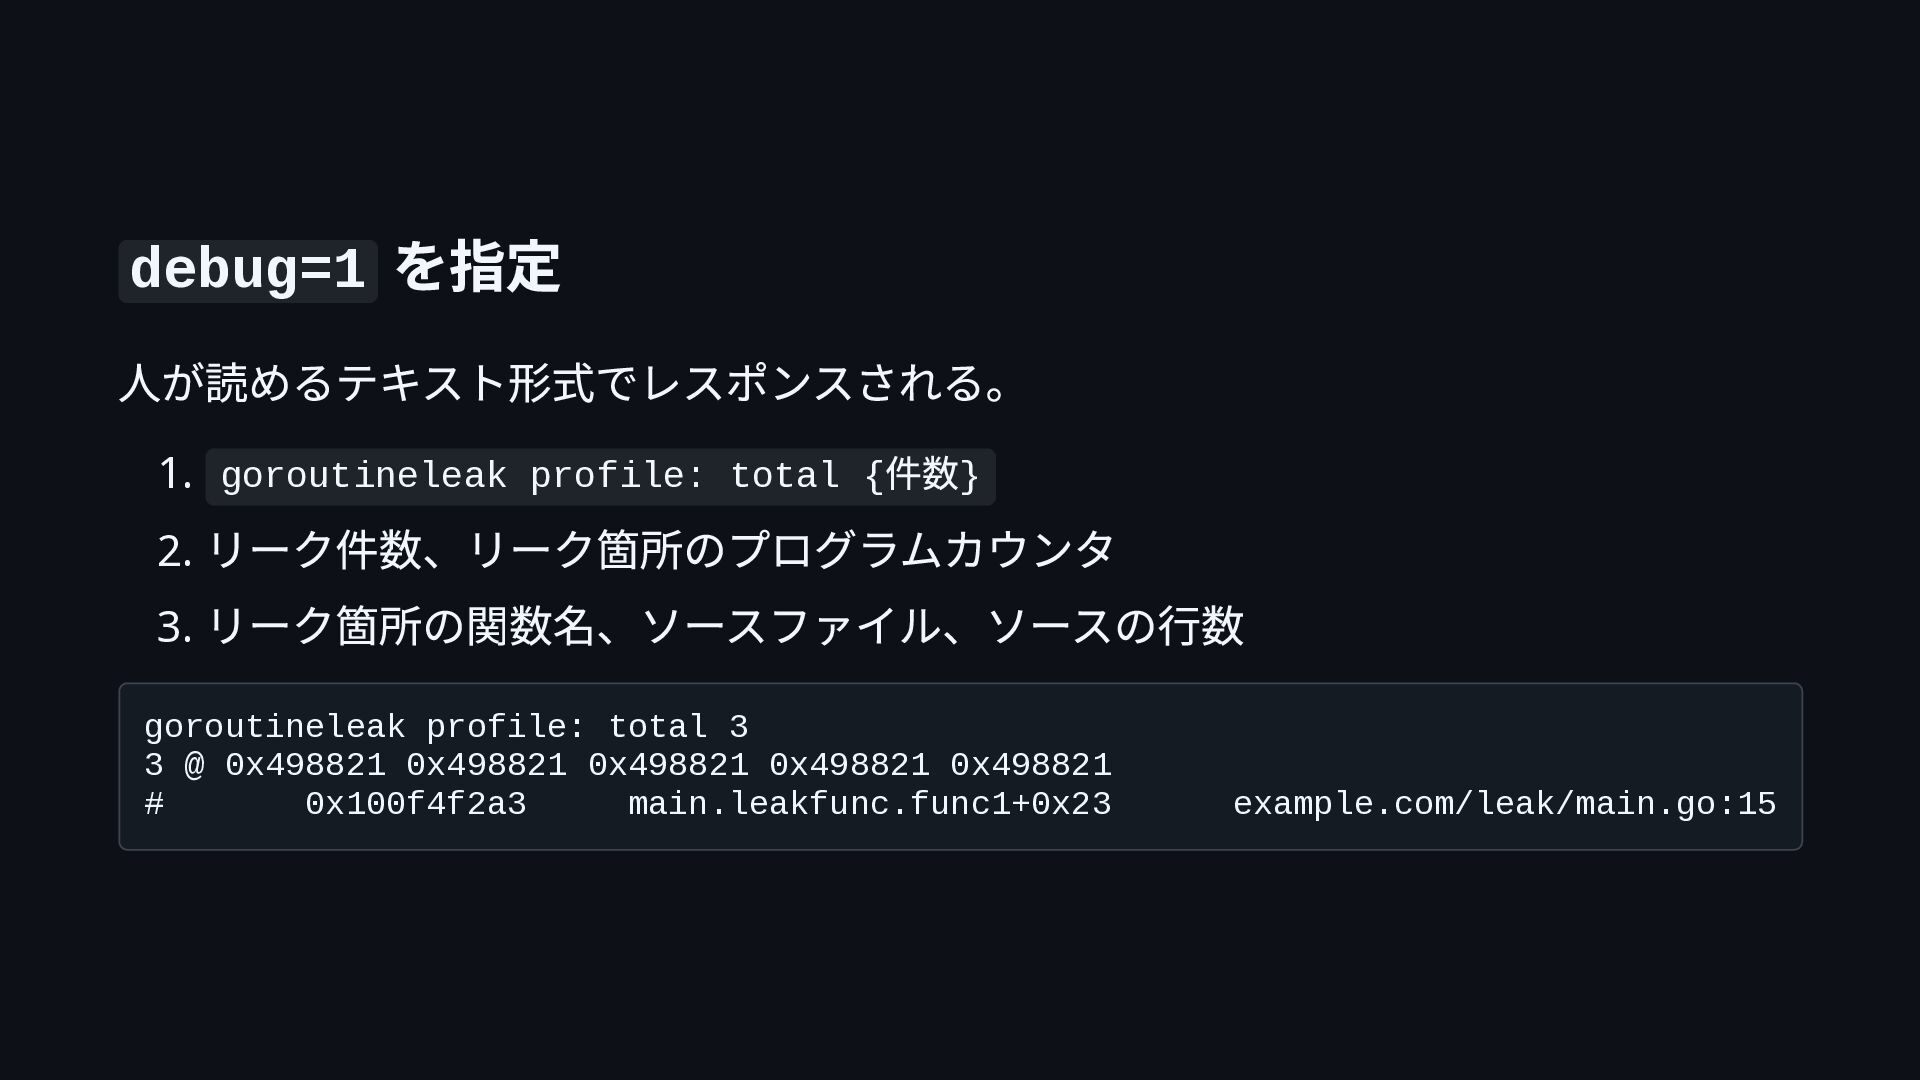
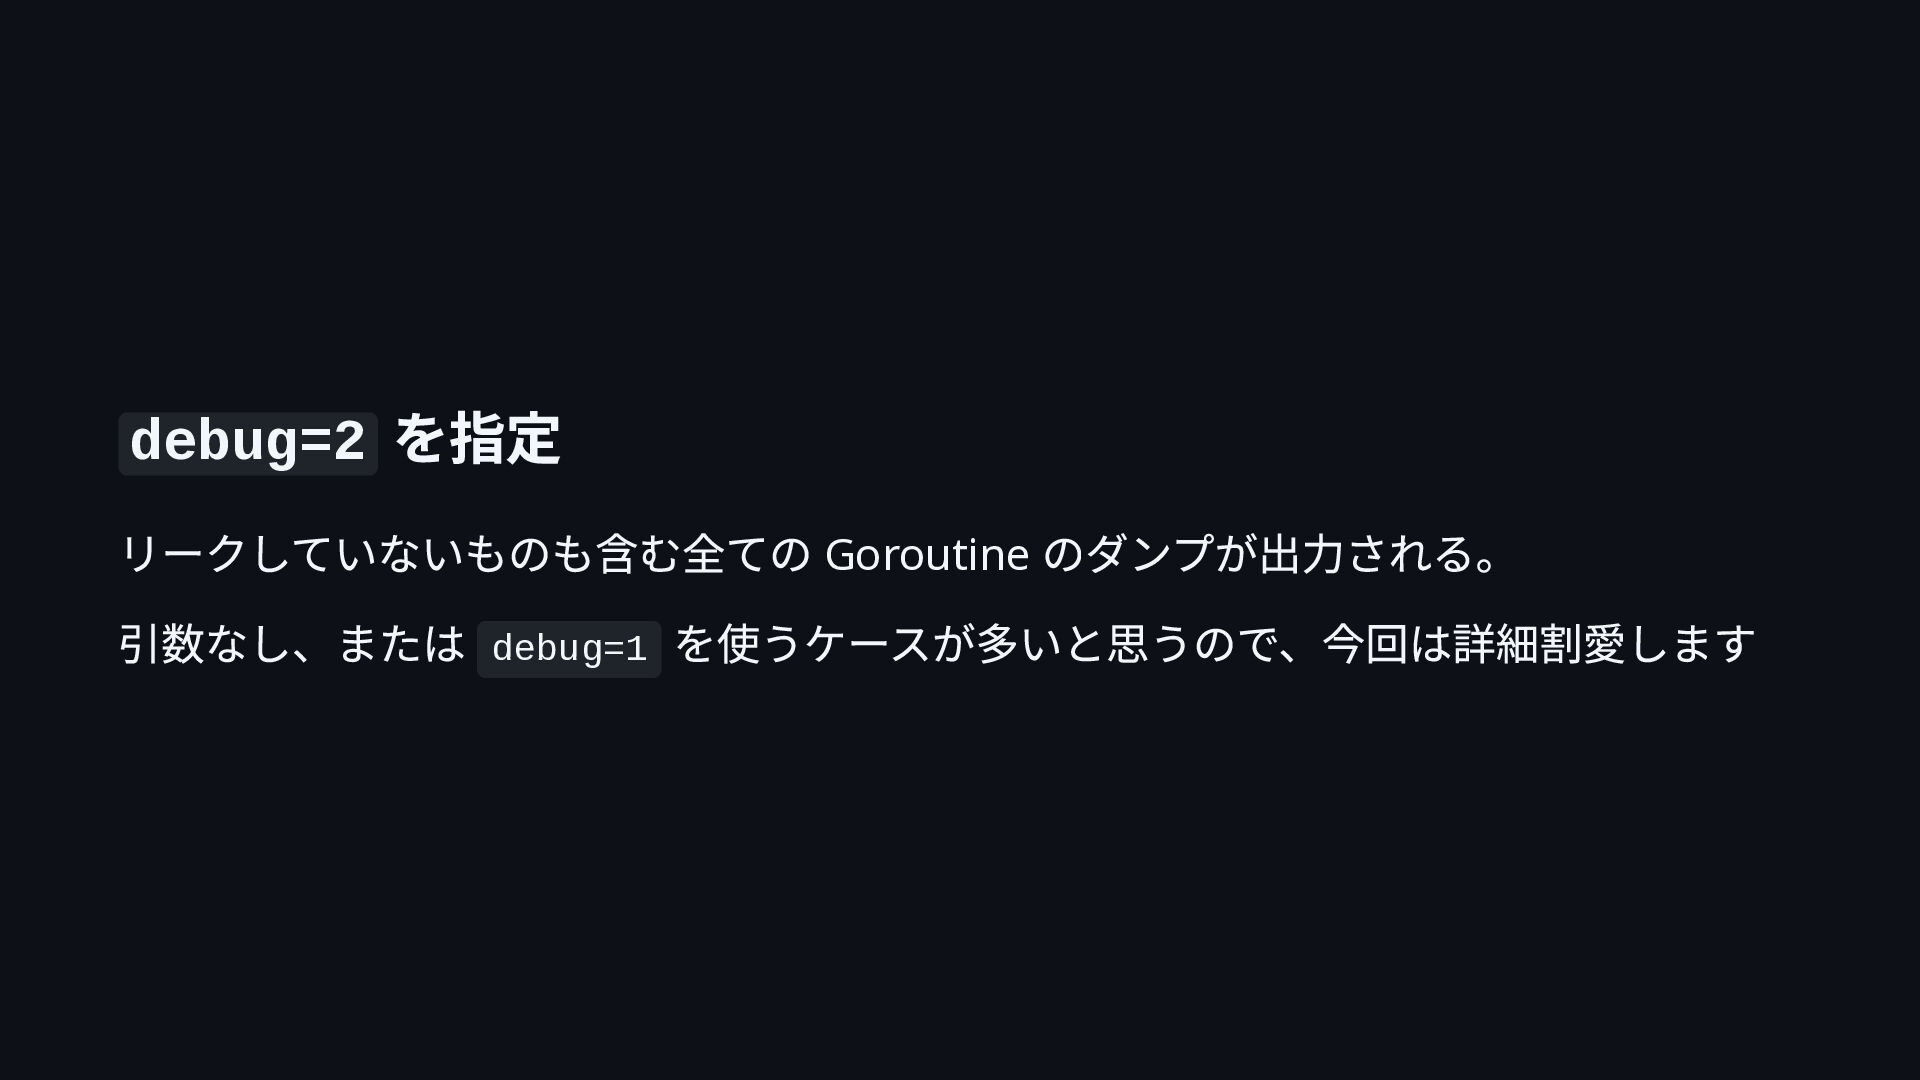
  8. debug=1 を指定 人が読めるテキスト形式でレスポンスされる。 件数} 1. goroutineleak profile: total { リーク件数、リーク箇所のプログラムカウンタ

    3. リーク箇所の関数名、ソースファイル、ソースの行数 2. goroutineleak profile: total 3 3 @ 0x498821 0x498821 0x498821 0x498821 0x498821 # 0x100f4f2a3 main.leakfunc.func1+0x23 example.com/leak/main.go:15
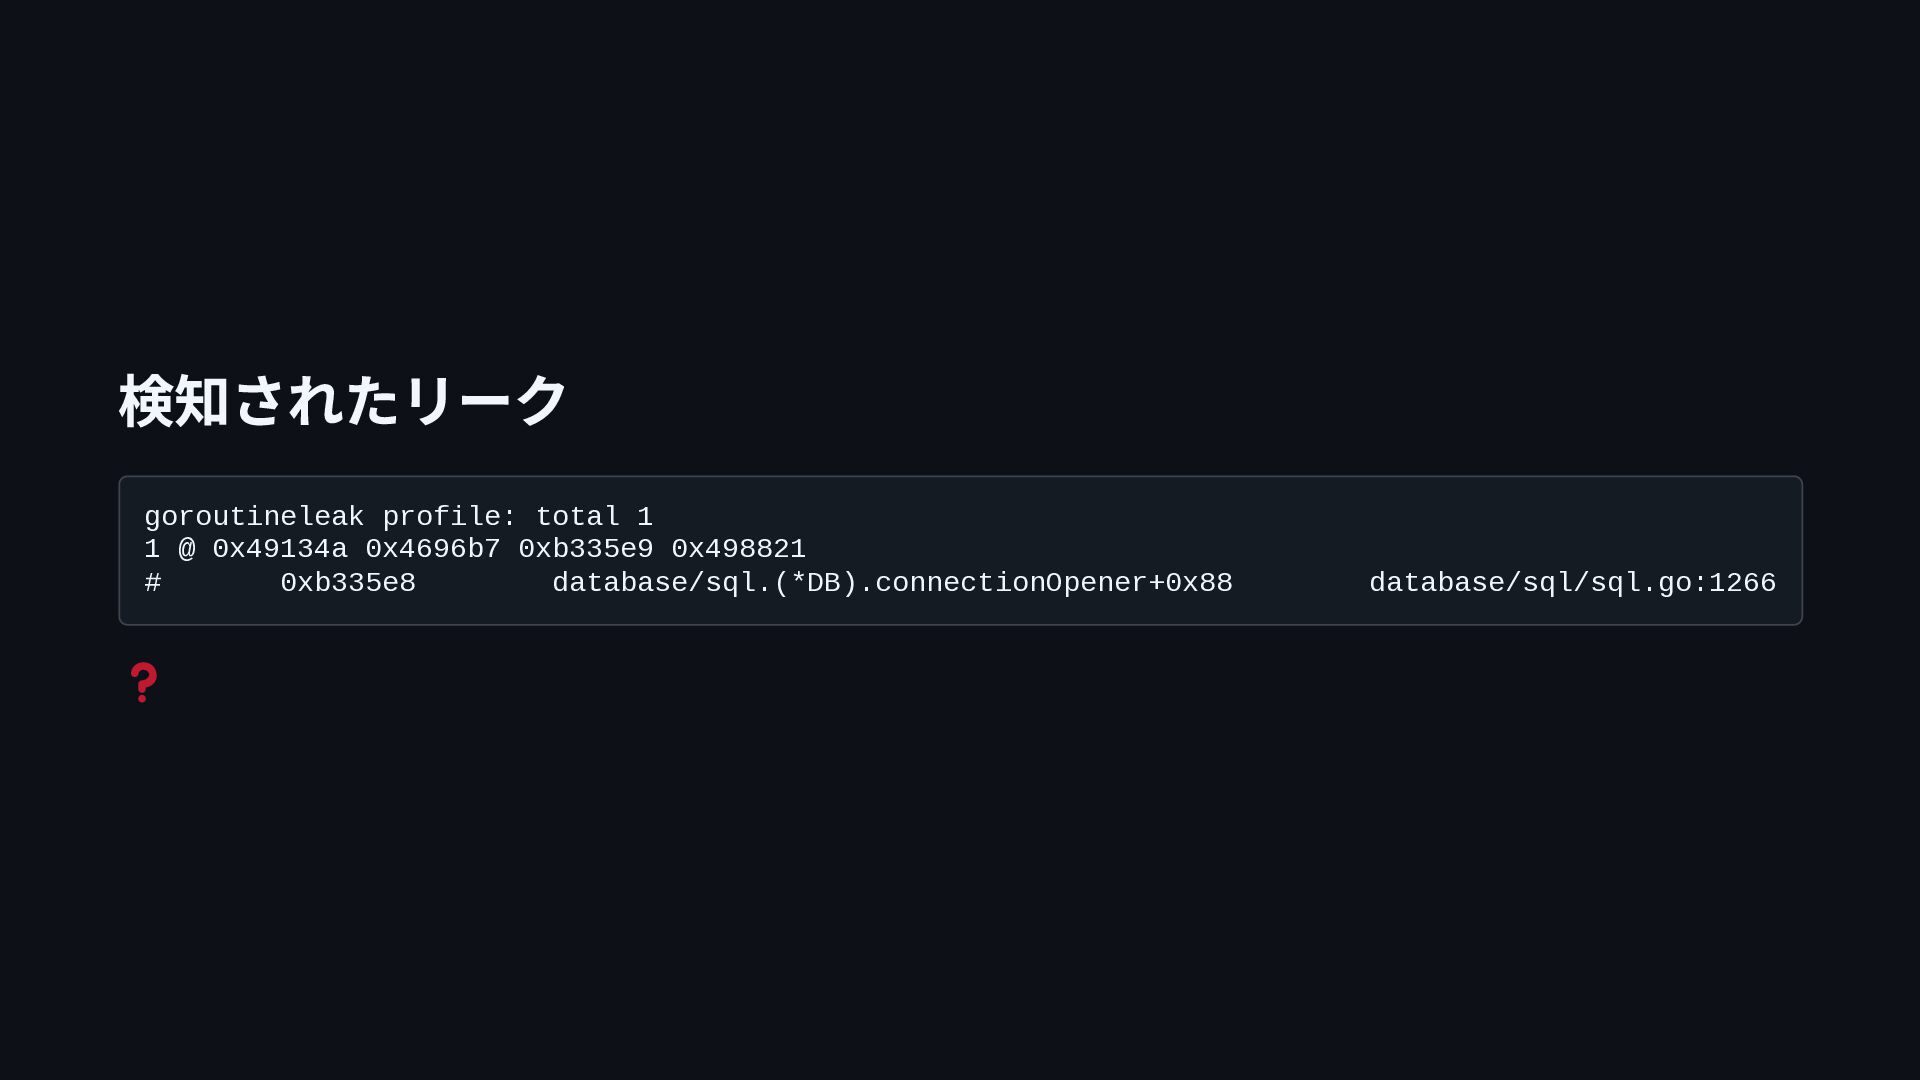
  9. 検知されたリーク goroutineleak profile: total 1 1 @ 0x49134a 0x4696b7 0xb335e9

    0x498821 # 0xb335e8 database/sql.(*DB).connectionOpener+0x88 database/sql/sql.go:1266
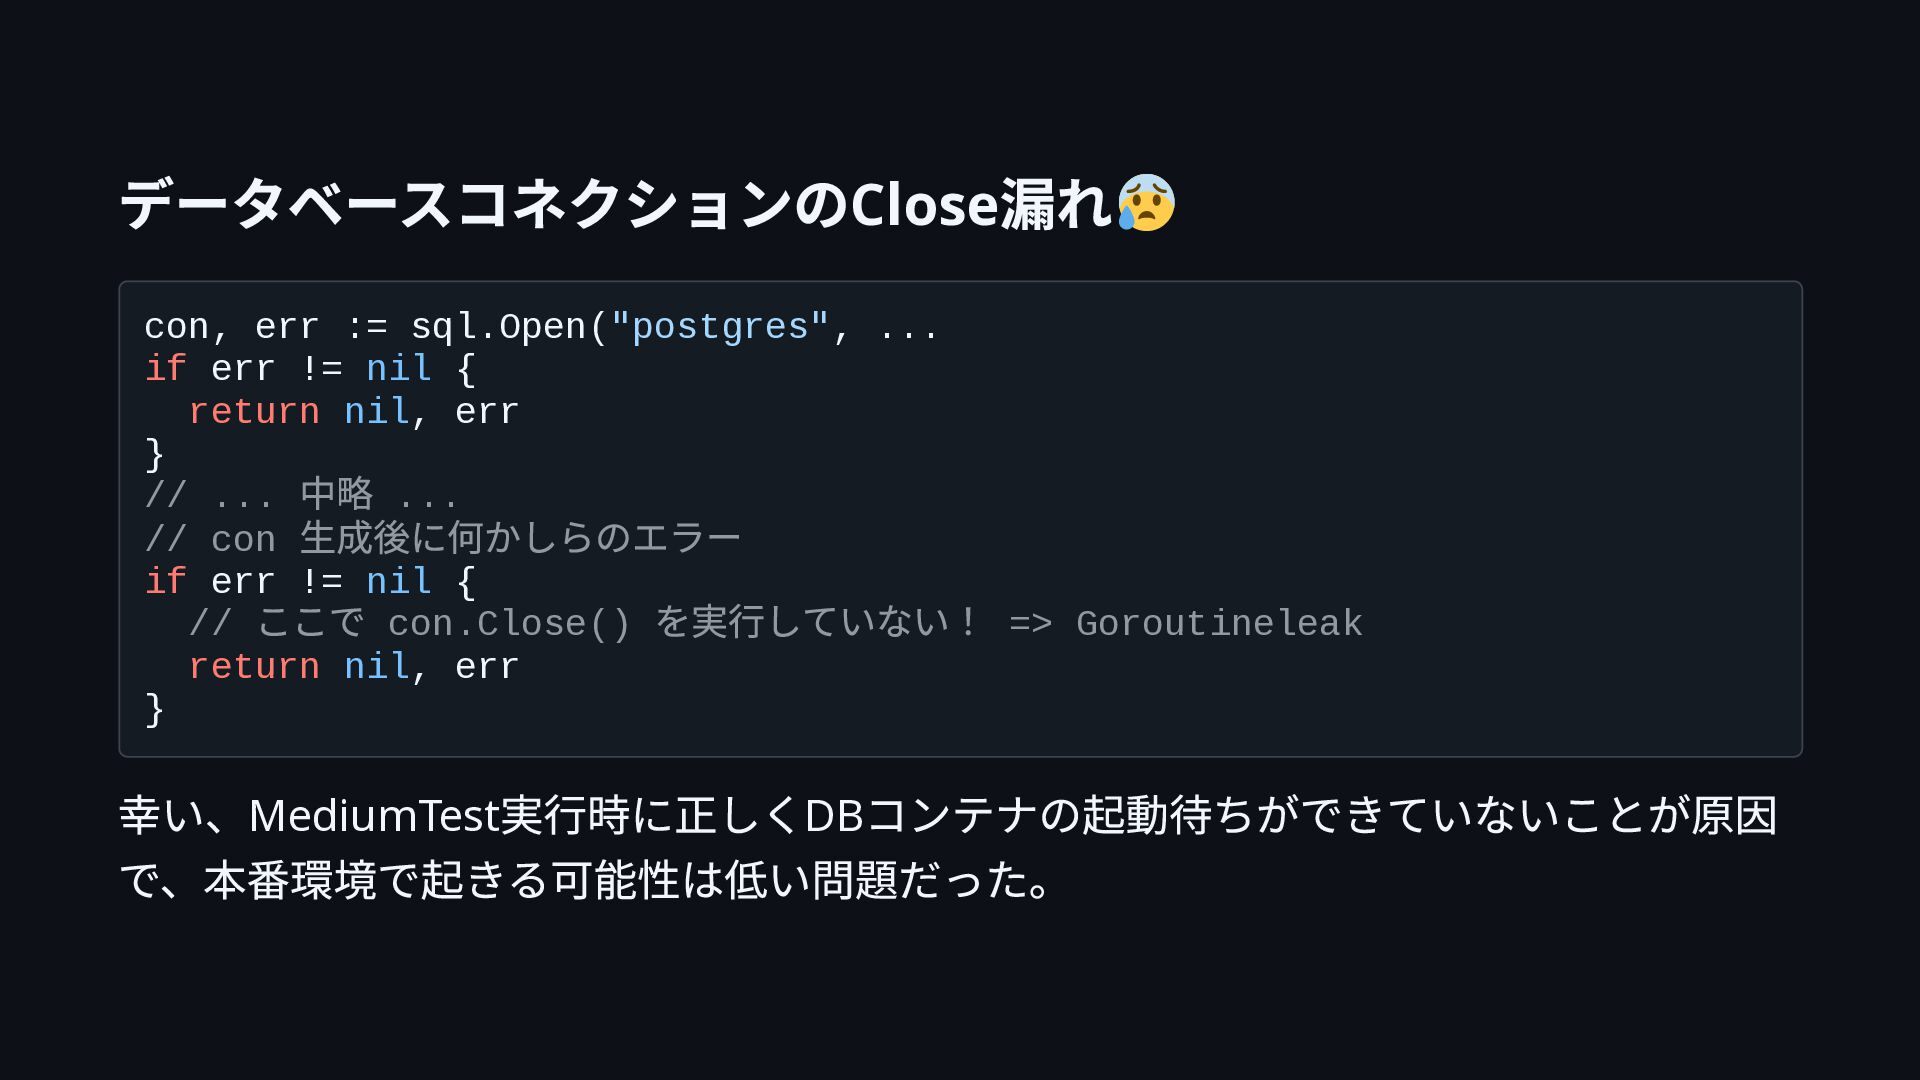
  10. データベースコネクションのClose漏れ con, err := sql.Open("postgres", ... if err != nil

    { return nil, err } // ... ... // con if err != nil { // con.Close() return nil, err } 中略 生成後に何かしらのエラー ここで を実行していない! => Goroutineleak 幸い、MediumTest実行時に正しくDBコンテナの起動待ちができていないことが原因 で、本番環境で起きる可能性は低い問題だった。
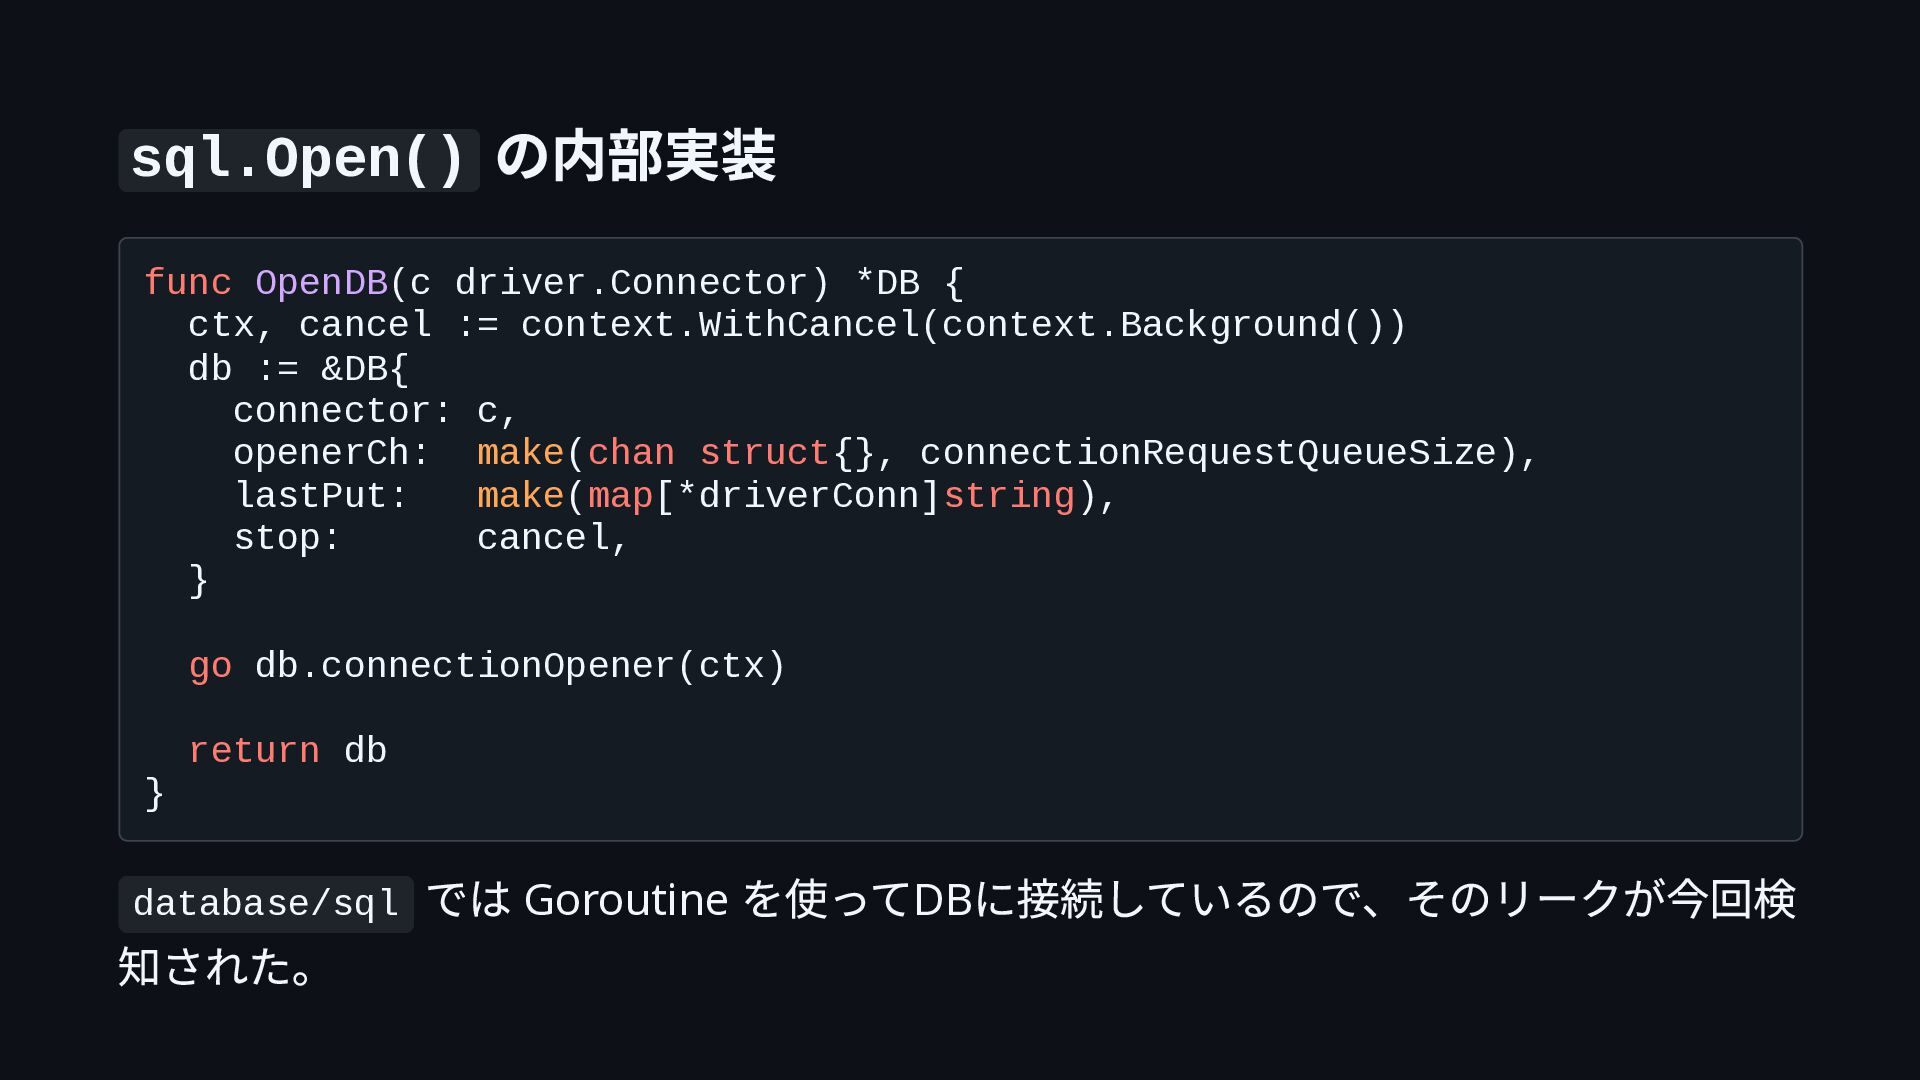
  11. sql.Open() の内部実装 func OpenDB(c driver.Connector) *DB { ctx, cancel :=

    context.WithCancel(context.Background()) db := &DB{ connector: c, openerCh: make(chan struct{}, connectionRequestQueueSize), lastPut: make(map[*driverConn]string), stop: cancel, } go db.connectionOpener(ctx) return db } database/sql 知された。 では Goroutine を使ってDBに接続しているので、そのリークが今回検