Upgrade to Pro — share decks privately, control downloads, hide ads and more …

data mining

Avatar for Mahek Dangi Mahek Dangi
February 11, 2025
9

data mining

it's a defines data mining concepts. it helpsful for students and for interviewers

Avatar for Mahek Dangi

Mahek Dangi

February 11, 2025

Transcript

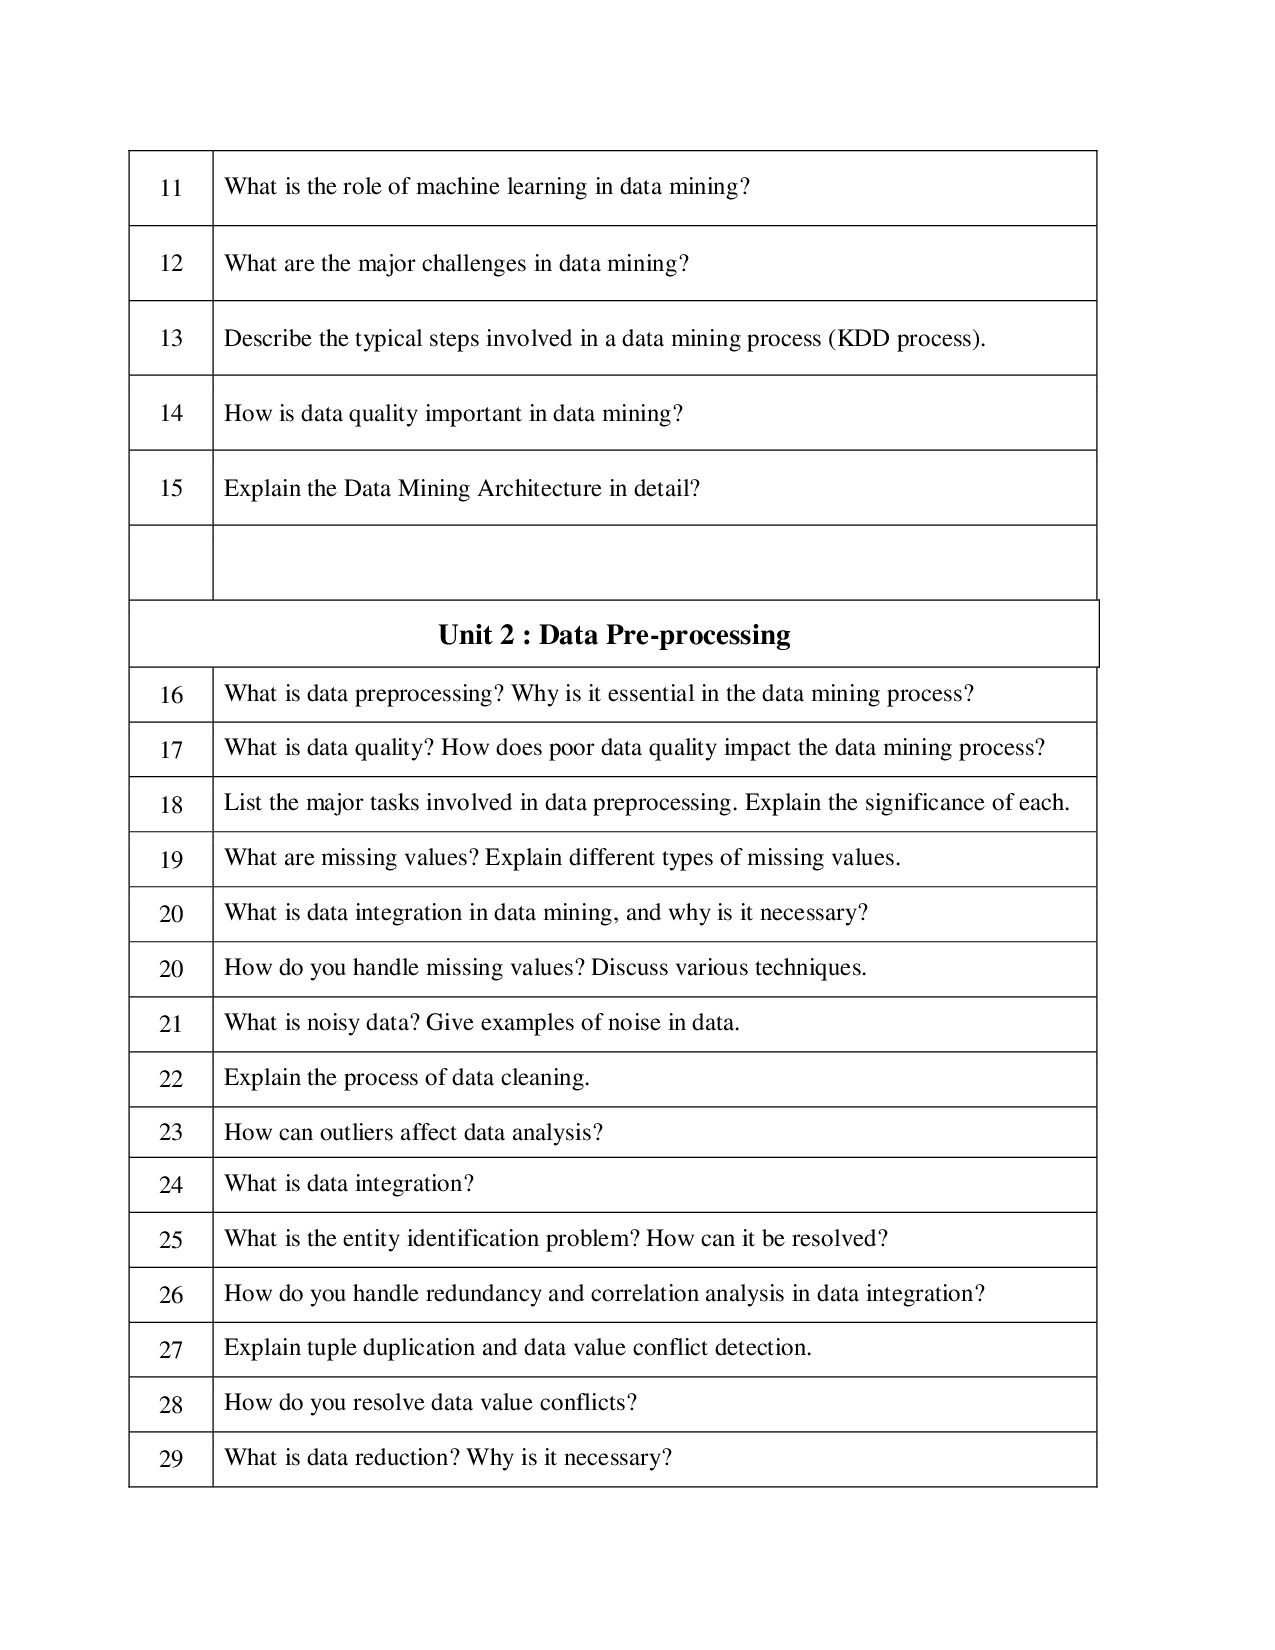
  1. SILVER OAK UNIVERSITY Silver Oak College of Computer Application Bachelor

    of Computer Application Semester: 5 Academic Year: 2024-2025 Course Name: Data Mining Course Code: 2040233341 Question bank Sr. No. Question Text Unit 1 : Introduction to data mining (DM) 1 Define data mining. What are the main goals of data mining? 2 Differentiate between data, information, and knowledge. 3 How does data mining differ from traditional database query processing? 4 What is a database? How does it differ from a data warehouse? 5 What does KDD stands ? 5 Explain transactional data with examples. 6 What is the difference between descriptive and predictive data mining? 7 Define characterization and discrimination. 8 What are association rules? Give an example. 9 Differentiate between classification and clustering. 10 Discuss the challenges in identifying interesting patterns.
  2. 11 What is the role of machine learning in data

    mining? 12 What are the major challenges in data mining? 13 Describe the typical steps involved in a data mining process (KDD process). 14 How is data quality important in data mining? 15 Explain the Data Mining Architecture in detail? Unit 2 : Data Pre-processing 16 What is data preprocessing? Why is it essential in the data mining process? 17 What is data quality? How does poor data quality impact the data mining process? 18 List the major tasks involved in data preprocessing. Explain the significance of each. 19 What are missing values? Explain different types of missing values. 20 What is data integration in data mining, and why is it necessary? 20 How do you handle missing values? Discuss various techniques. 21 What is noisy data? Give examples of noise in data. 22 Explain the process of data cleaning. 23 How can outliers affect data analysis? 24 What is data integration? 25 What is the entity identification problem? How can it be resolved? 26 How do you handle redundancy and correlation analysis in data integration? 27 Explain tuple duplication and data value conflict detection. 28 How do you resolve data value conflicts? 29 What is data reduction? Why is it necessary?
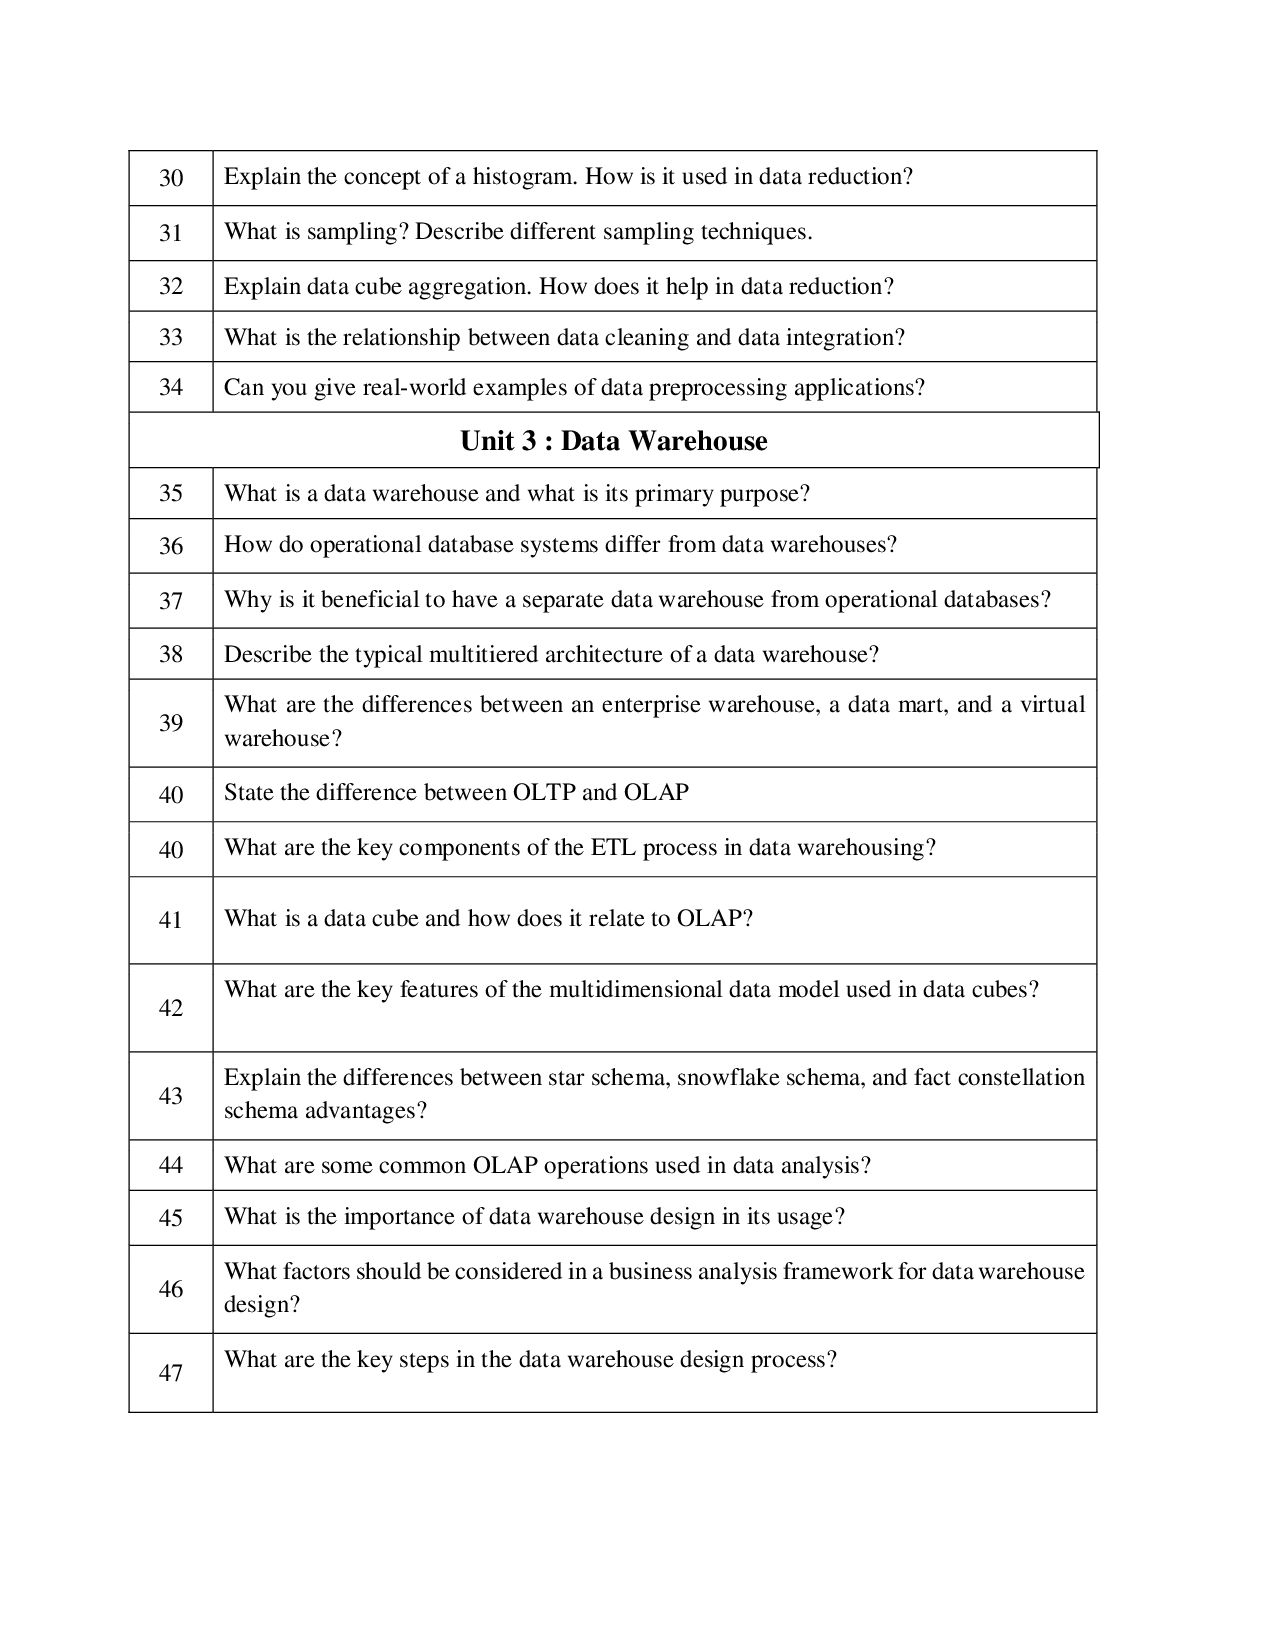
  3. 30 Explain the concept of a histogram. How is it

    used in data reduction? 31 What is sampling? Describe different sampling techniques. 32 Explain data cube aggregation. How does it help in data reduction? 33 What is the relationship between data cleaning and data integration? 34 Can you give real-world examples of data preprocessing applications? Unit 3 : Data Warehouse 35 What is a data warehouse and what is its primary purpose? 36 How do operational database systems differ from data warehouses? 37 Why is it beneficial to have a separate data warehouse from operational databases? 38 Describe the typical multitiered architecture of a data warehouse? 39 What are the differences between an enterprise warehouse, a data mart, and a virtual warehouse? 40 State the difference between OLTP and OLAP 40 What are the key components of the ETL process in data warehousing? 41 What is a data cube and how does it relate to OLAP? 42 What are the key features of the multidimensional data model used in data cubes? 43 Explain the differences between star schema, snowflake schema, and fact constellation schema advantages? 44 What are some common OLAP operations used in data analysis? 45 What is the importance of data warehouse design in its usage? 46 What factors should be considered in a business analysis framework for data warehouse design? 47 What are the key steps in the data warehouse design process?
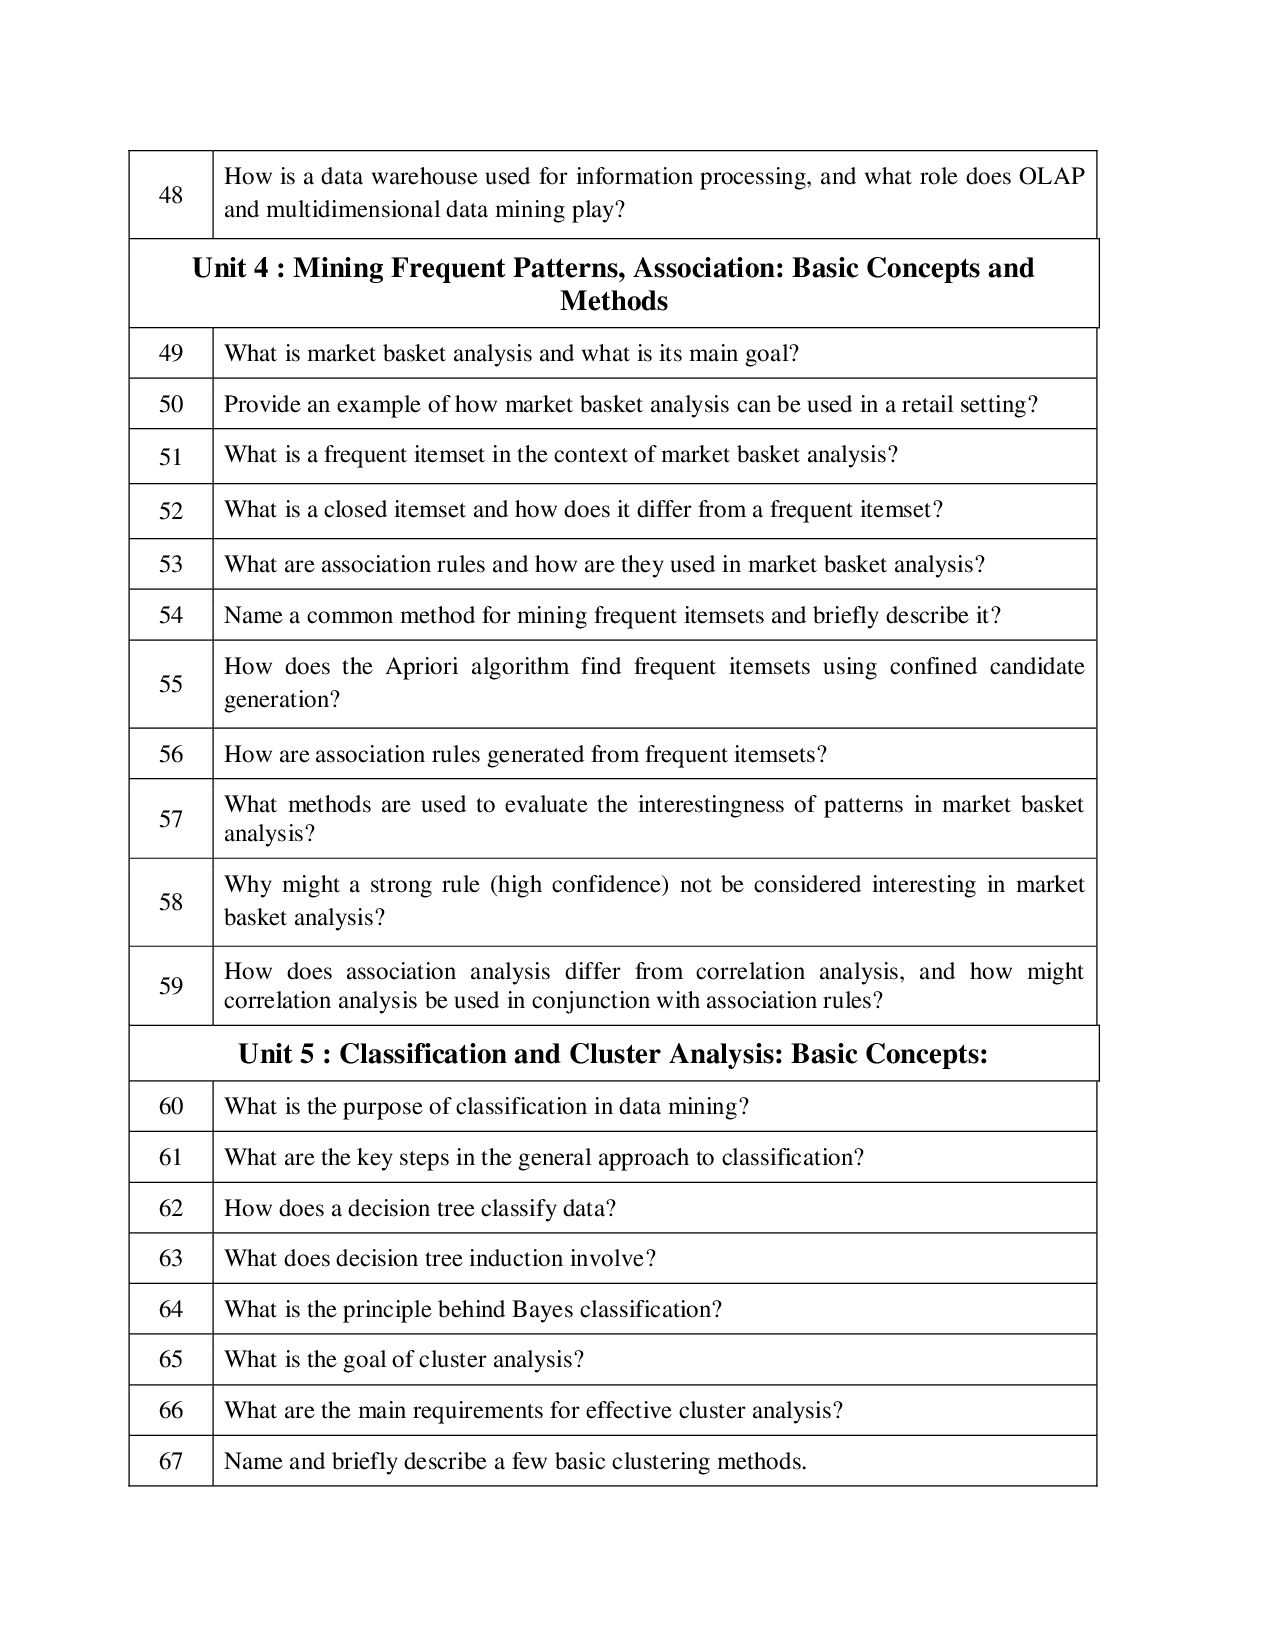
  4. 48 How is a data warehouse used for information processing,

    and what role does OLAP and multidimensional data mining play? Unit 4 : Mining Frequent Patterns, Association: Basic Concepts and Methods 49 What is market basket analysis and what is its main goal? 50 Provide an example of how market basket analysis can be used in a retail setting? 51 What is a frequent itemset in the context of market basket analysis? 52 What is a closed itemset and how does it differ from a frequent itemset? 53 What are association rules and how are they used in market basket analysis? 54 Name a common method for mining frequent itemsets and briefly describe it? 55 How does the Apriori algorithm find frequent itemsets using confined candidate generation? 56 How are association rules generated from frequent itemsets? 57 What methods are used to evaluate the interestingness of patterns in market basket analysis? 58 Why might a strong rule (high confidence) not be considered interesting in market basket analysis? 59 How does association analysis differ from correlation analysis, and how might correlation analysis be used in conjunction with association rules? Unit 5 : Classification and Cluster Analysis: Basic Concepts: 60 What is the purpose of classification in data mining? 61 What are the key steps in the general approach to classification? 62 How does a decision tree classify data? 63 What does decision tree induction involve? 64 What is the principle behind Bayes classification? 65 What is the goal of cluster analysis? 66 What are the main requirements for effective cluster analysis? 67 Name and briefly describe a few basic clustering methods.
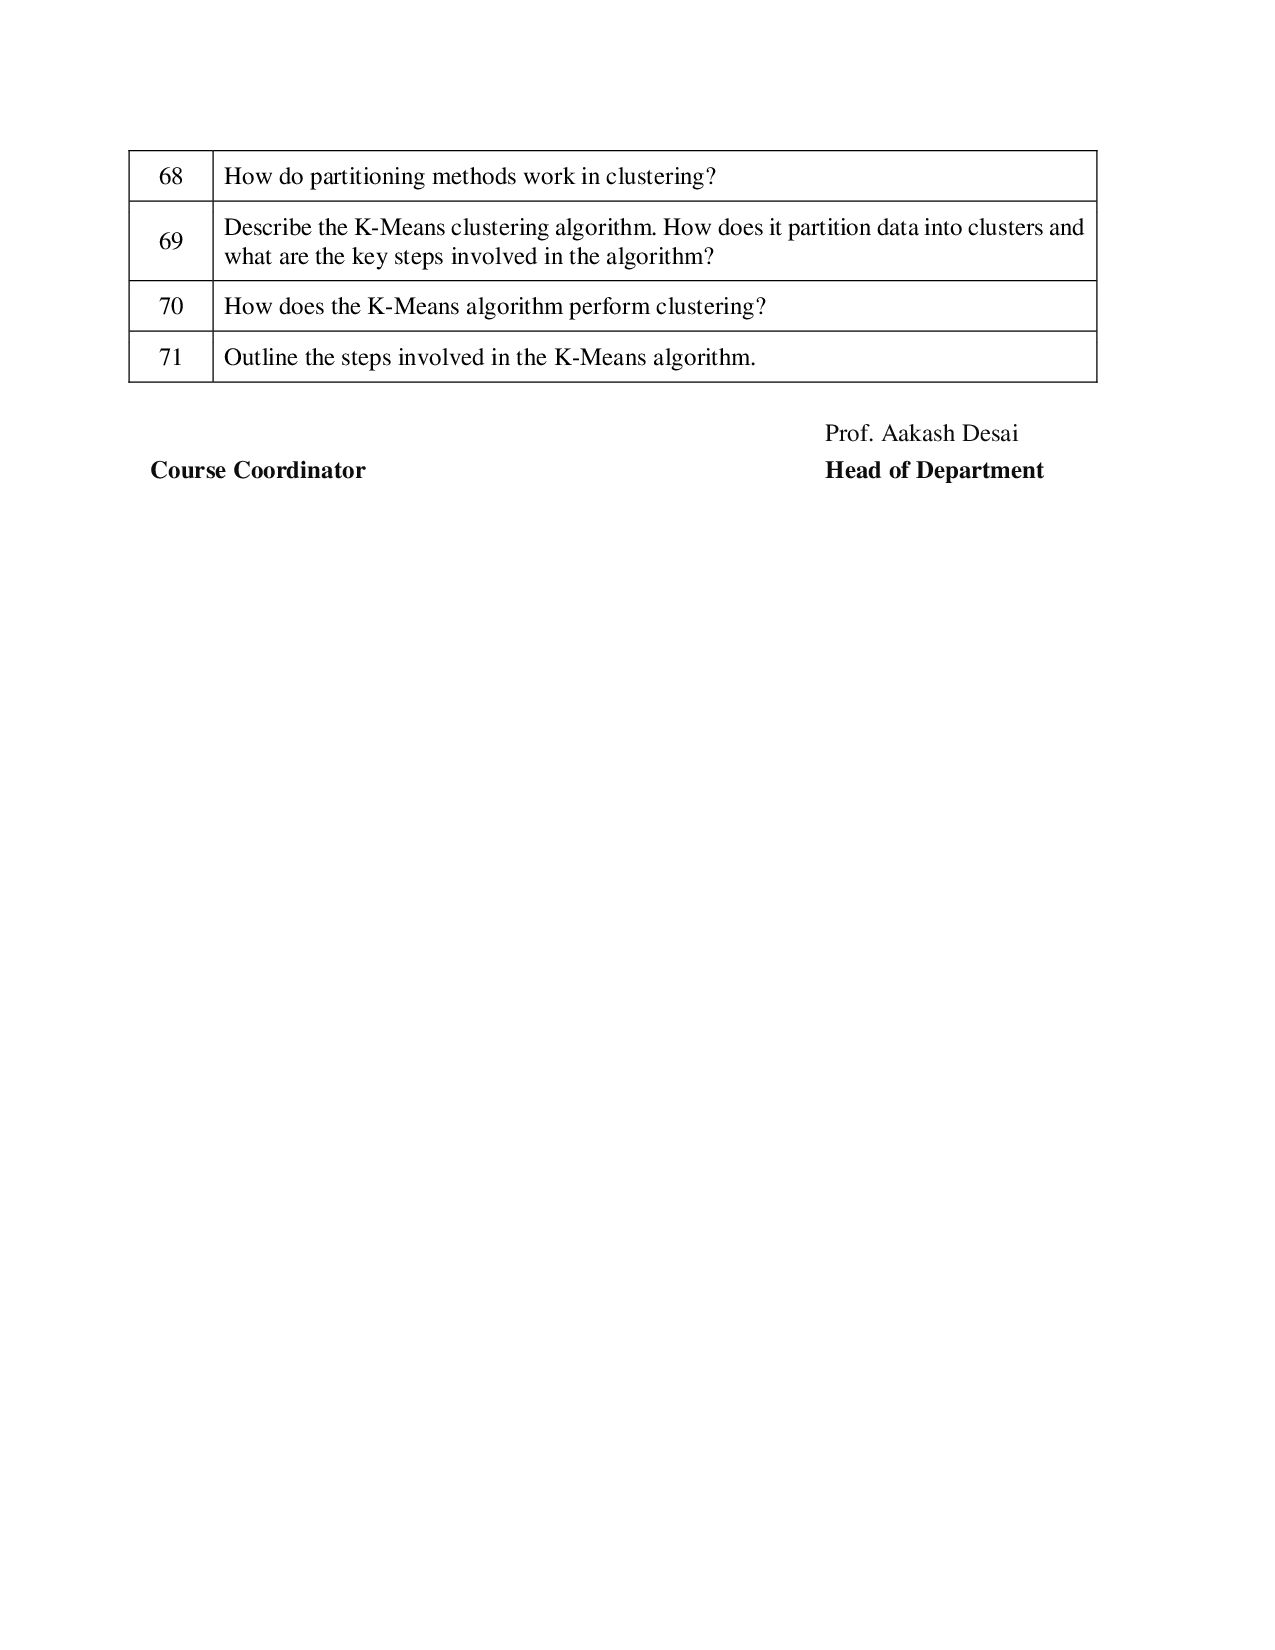
  5. 68 How do partitioning methods work in clustering? 69 Describe

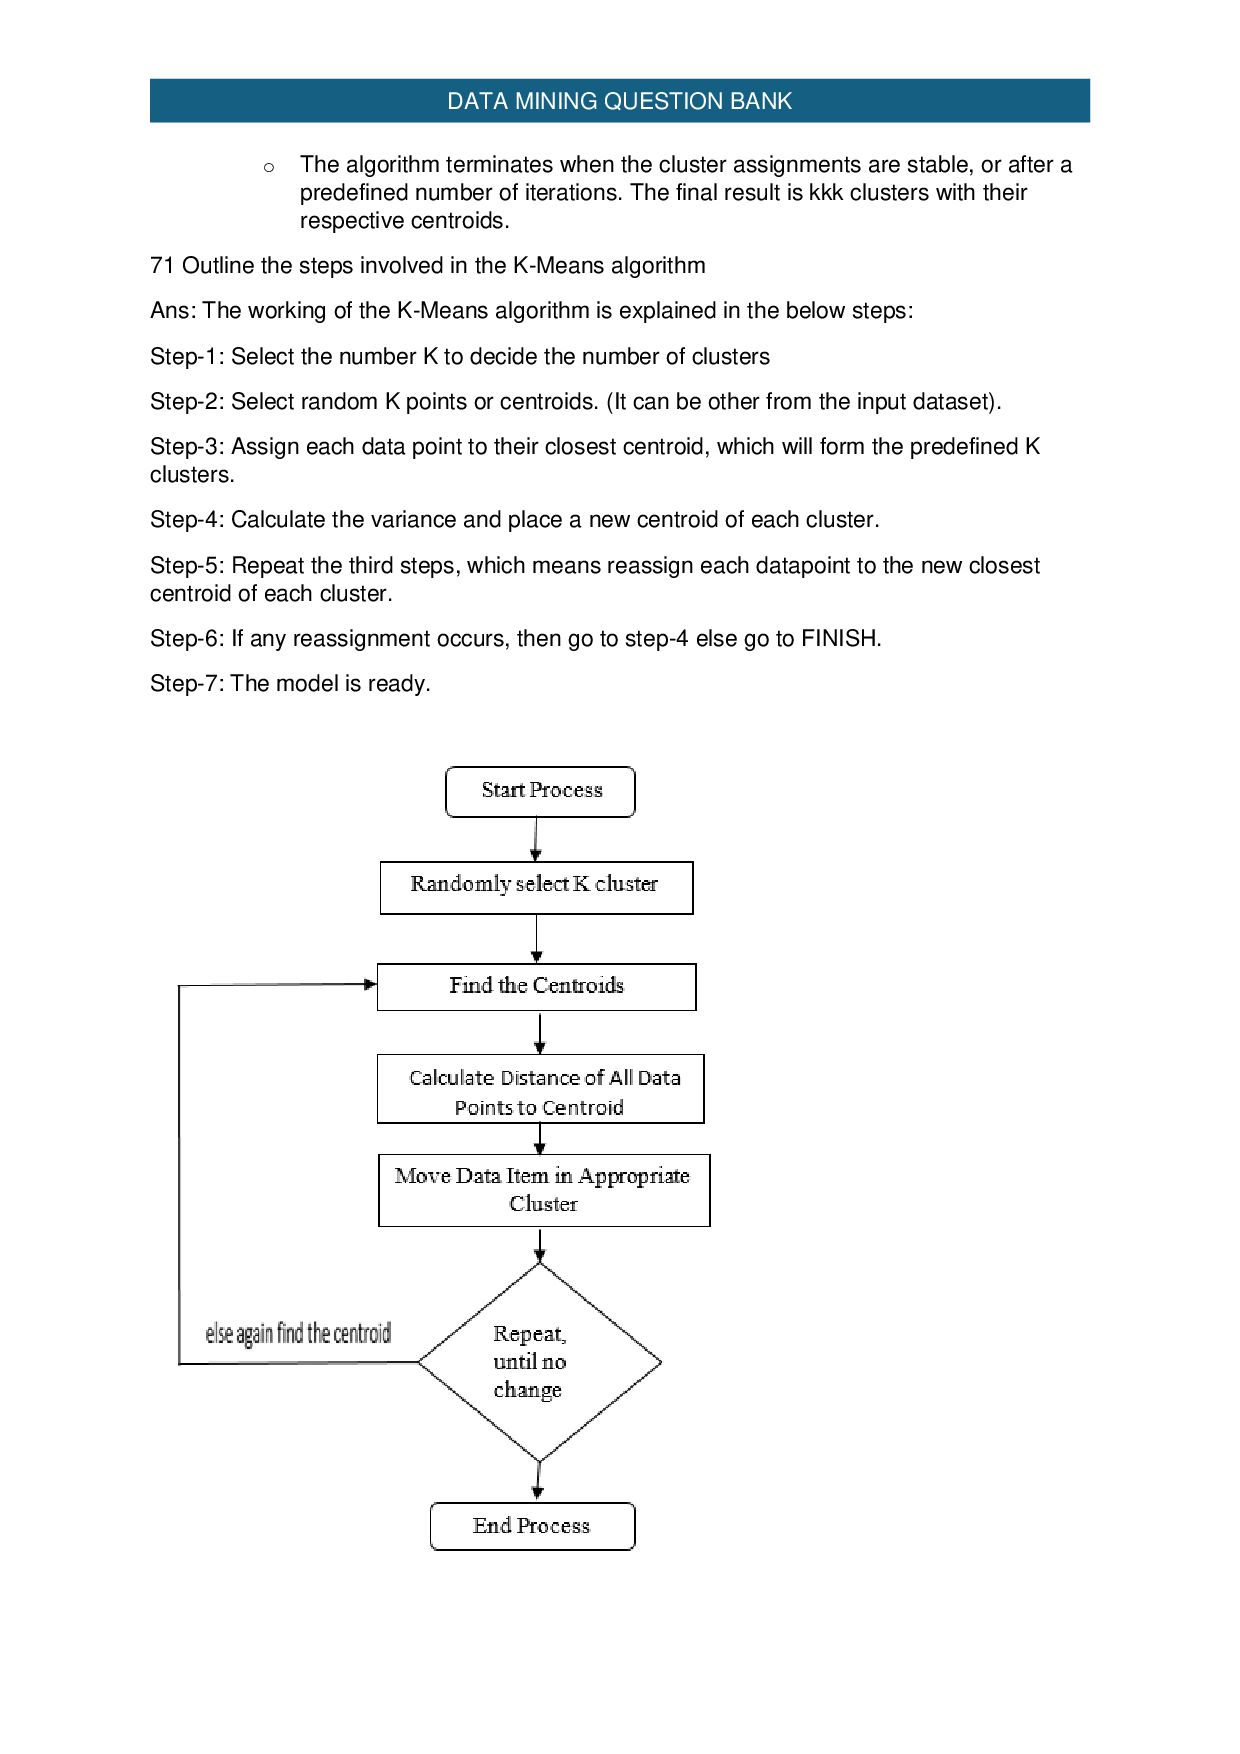
    the K-Means clustering algorithm. How does it partition data into clusters and what are the key steps involved in the algorithm? 70 How does the K-Means algorithm perform clustering? 71 Outline the steps involved in the K-Means algorithm. Prof. Aakash Desai Course Coordinator Head of Department
  6. DATA MINING QUESTION BANK Unit 1 : Introduction to data

    mining (DM) 1 Define data mining. What are the main goals of data mining? Ans: The process of extracting information to identify patterns, trends, and useful data that would allow the business to take the data-driven decision from huge sets of data is called Data Mining. Main Goals of Data Mining:  Pattern Discovery: Identify and uncover patterns or relationships in data that were previously unknown.  Prediction: Use historical data to predict future trends, behaviors, or outcomes.  Classification: Categorize data into predefined classes or groups based on learned patterns.  Clustering: Group similar data points together without predefined labels, revealing natural groupings in the data.  Anomaly Detection: Identify outliers or unusual data points that may indicate significant events or errors.  Association Rule Learning: Discover relationships or correlations between different variables in a dataset.  Summarization: Provide a compact and concise representation of the dataset, such as generating summary statistics or visualizations.  Data Reduction: Simplify the dataset while retaining its essential characteristics, often used to make large datasets more manageable for analysis. 2 Differentiate between data, information, and knowledge. Ans: 1. Data: Raw, unprocessed facts, figures, or symbols that have no inherent meaning on their own. Data is the basic building block and can be in the form of numbers, text, images, or other unprocessed inputs. Example: "1001," "John," "12:30 PM," "apple." 2. Information: Processed or organized data that is meaningful and useful. Information is data that has been given context, making it interpretable and relevant to a specific purpose. Example: "John bought an apple at 12:30 PM." Here, the data is organized in a way that conveys a clear message or fact. 3. Knowledge: Information that has been further processed, understood, and integrated with experience, context, or insights. Knowledge is actionable and can be used to make decisions, predictions, or understand complex situations. Example: Knowing that John buys an apple every day at 12:30 PM because it is his regular snack time. This understanding allows for the prediction of future behavior based on past information.
  7. DATA MINING QUESTION BANK 3 How does data mining differ

    from traditional database query processing? Ans: Aspect Data Mining Traditional Database Query Processing Objective Discover hidden patterns, trends, and knowledge from large datasets. Retrieve specific data or perform simple operations on data. Nature of Output Produces new insights, patterns, rules, or predictions. Provides exact, predefined results based on the query criteria. Processing Type Exploratory and often involves complex algorithms (e.g., clustering, classification). Deterministic and based on specific, well-defined queries (e.g., SELECT statements). Data Involvement Works with large, often unstructured or semi- structured datasets. Operates on structured data with a predefined schema. User Interaction Typically requires advanced analytical tools and techniques; often automated. Requires direct user input in the form of specific SQL queries. Scope Focuses on discovering unknown or unexpected relationships in data. Focuses on retrieving and manipulating known, well- structured data. Examples Identifying customer segments, predicting stock prices, detecting fraud. Retrieving customer records, updating a database, calculating totals. Tools and Techniques Uses machine learning algorithms, statistical analysis, and pattern recognition. Uses SQL queries and relational database management systems (RDBMS). Complexity Generally more complex and computationally intensive. Simpler, often involves straightforward data retrieval or updates. 4 What is a database? How does it differ from a data warehouse? Ans: A structured collection of data that is stored and managed to serve applications and users. It supports CRUD operations (Create, Read, Update, Delete). Ex:- A customer relationship management (CRM) system that stores customer information, sales records, and interaction history. Key Differences Between a Database and a Data Warehouse: Aspect Database Data Warehouse
  8. DATA MINING QUESTION BANK Purpose Manage day-to-day operations and transactional

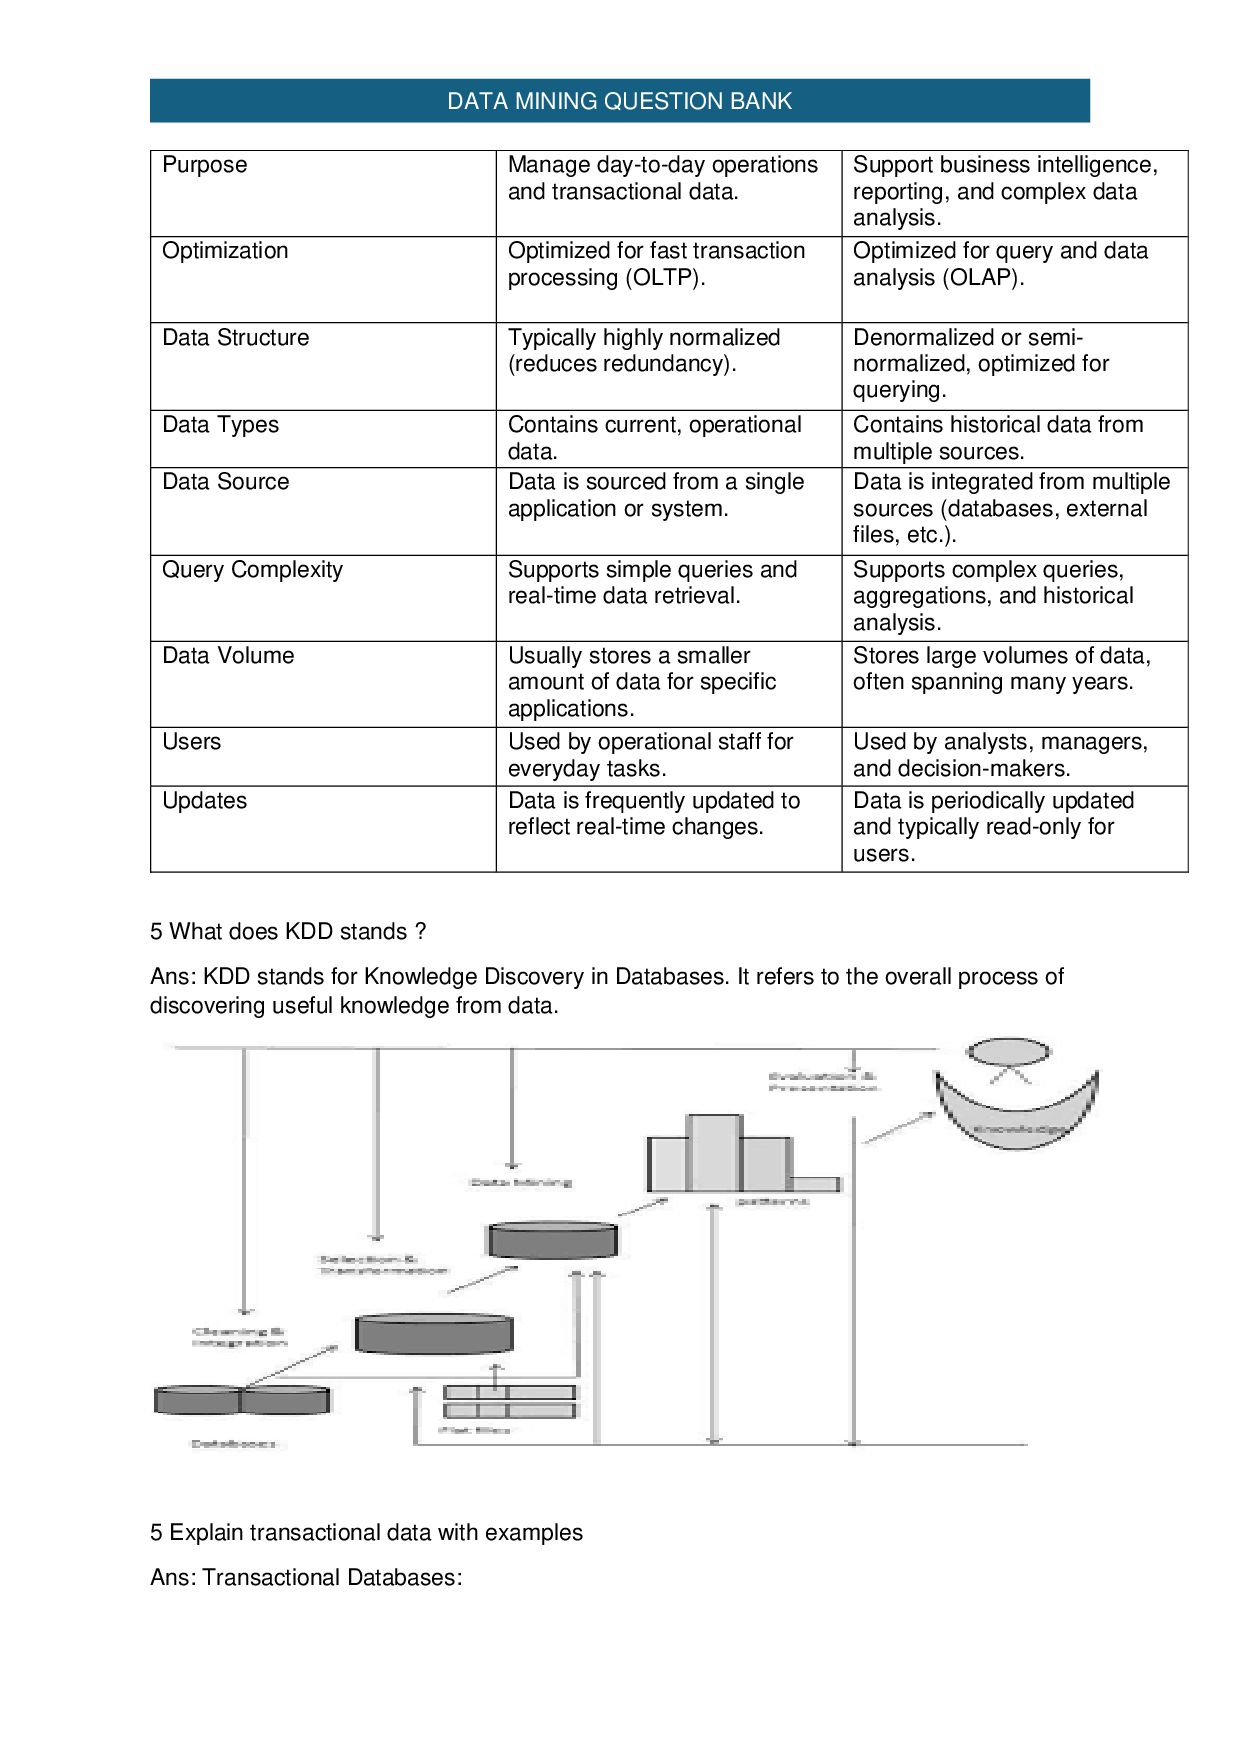
    data. Support business intelligence, reporting, and complex data analysis. Optimization Optimized for fast transaction processing (OLTP). Optimized for query and data analysis (OLAP). Data Structure Typically highly normalized (reduces redundancy). Denormalized or semi- normalized, optimized for querying. Data Types Contains current, operational data. Contains historical data from multiple sources. Data Source Data is sourced from a single application or system. Data is integrated from multiple sources (databases, external files, etc.). Query Complexity Supports simple queries and real-time data retrieval. Supports complex queries, aggregations, and historical analysis. Data Volume Usually stores a smaller amount of data for specific applications. Stores large volumes of data, often spanning many years. Users Used by operational staff for everyday tasks. Used by analysts, managers, and decision-makers. Updates Data is frequently updated to reflect real-time changes. Data is periodically updated and typically read-only for users. 5 What does KDD stands ? Ans: KDD stands for Knowledge Discovery in Databases. It refers to the overall process of discovering useful knowledge from data. 5 Explain transactional data with examples Ans: Transactional Databases:
  9. DATA MINING QUESTION BANK • Transactional database consists of a

    file where each record represents a transaction. • A transaction typically includes a unique transaction identity number (TID) and a list of the items making up the transaction (such as items purchased in a store). • E.g. : Online shopping on Flipkart, Amazon etc. 6 What is the difference between descriptive and predictive data mining? Ans: Data mining functionalities can be classified into two categories: 1. Descriptive 2. Predictive 1. Descriptive:- • This task presents the general properties of data stored in a database. • The descriptive tasks are used to find out patterns in data. • E.g.: Cluster, Trends, etc. 2. Predictive:- • These tasks predict the value of one attribute on the basis of values of other attributes. • E.g.: Festival Customer/Product Sell prediction at store 7 Define characterization and discrimination. Ans: 1. Data Characterization :  This refers to summarizing data of class under study.  It’s also called Target class.  E.g. Summarize the characteristics of customers who purchase more items on the shopping website.  The data related to such items can be collected by executing an SQL query on the purchase database.  Output of Data characterization can be presented in various forms. Like, pie chart, bar chart, curves, multidimensional data cubes and multidimensional data tables.  The resulting description can also be presented as generalized relations or in rule form is called Characteristic Rules. 2. Data Discrimination:  It refers to the comparison of the target class with one or set of comparative classes.  It’s also called Contrasting classes  E.g. A customer relationship manager want to compare two groups of customers - who shop for computer products regularly and who shop for computer products rarely.
  10. DATA MINING QUESTION BANK  Output of Data descrimination can

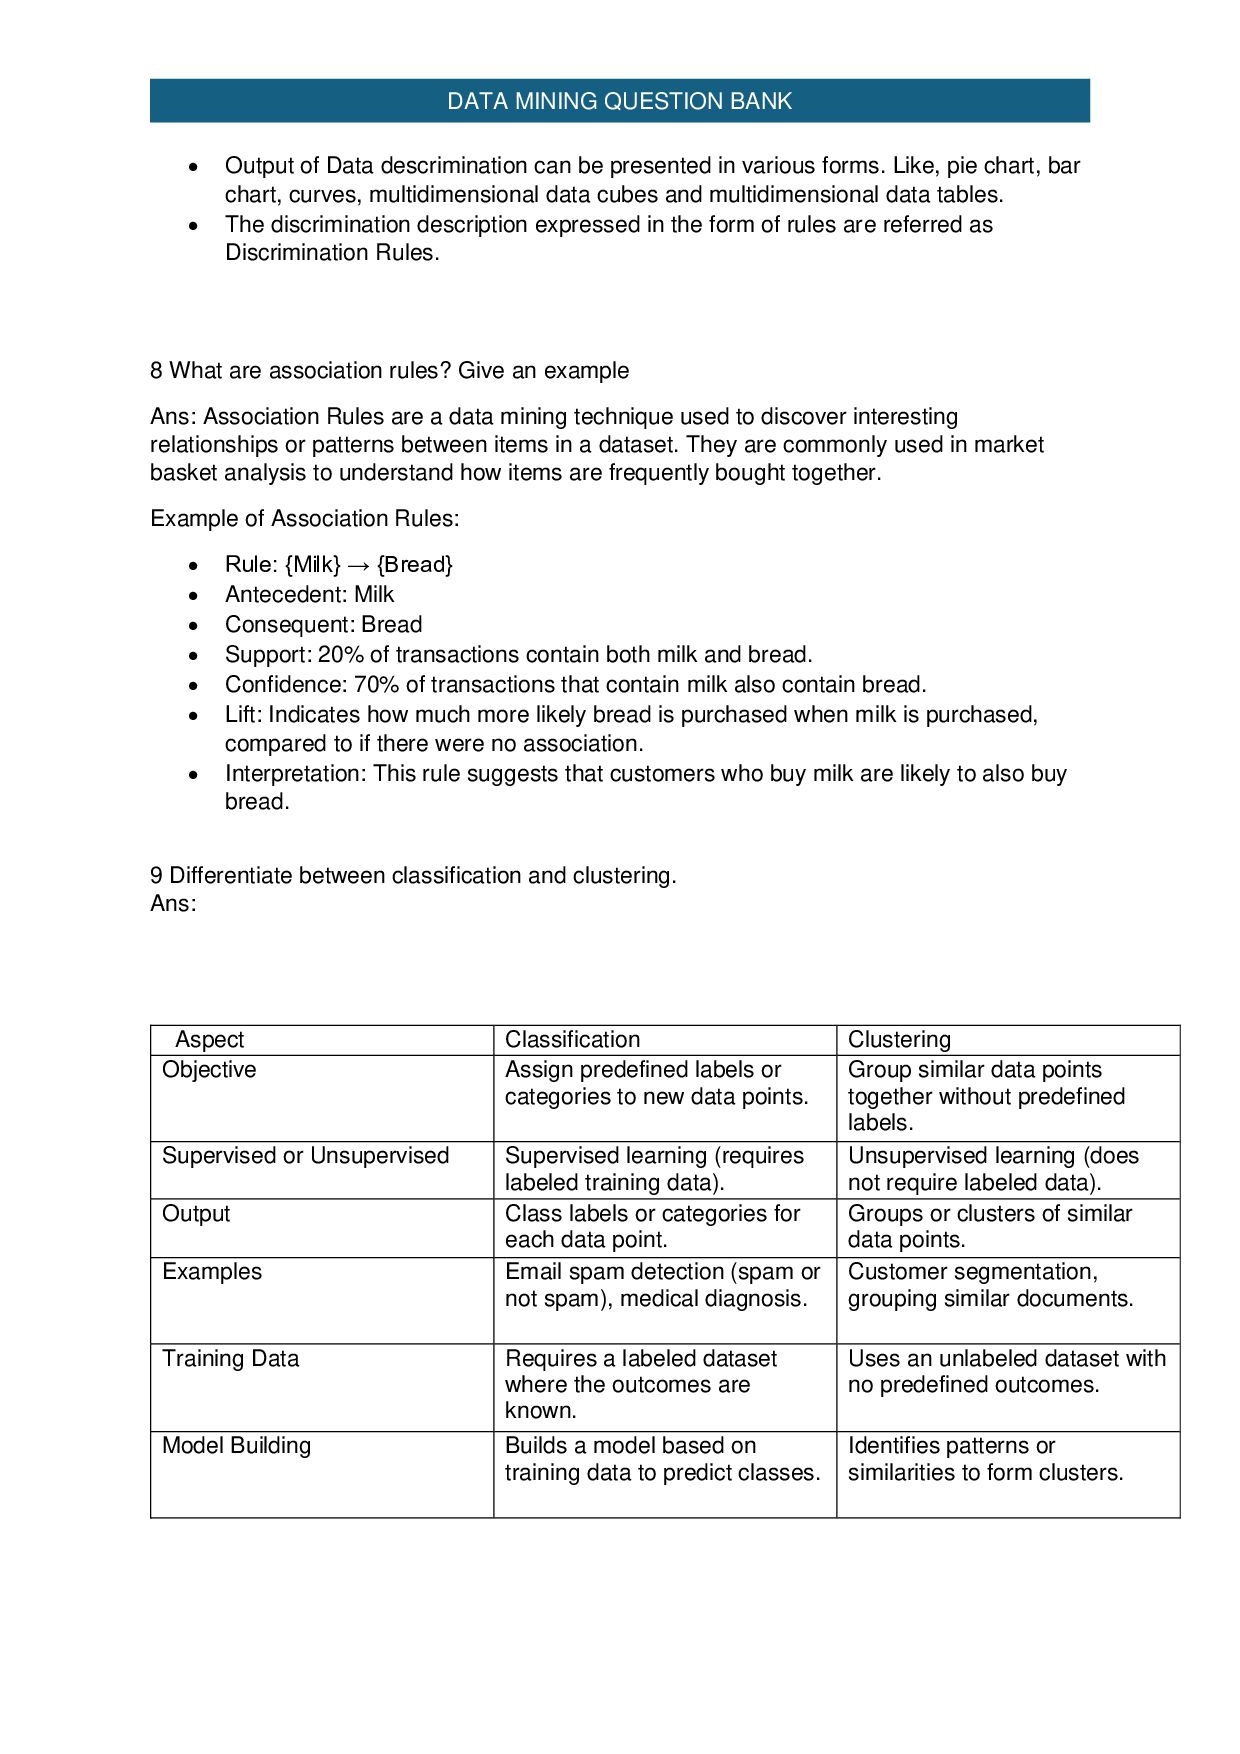
    be presented in various forms. Like, pie chart, bar chart, curves, multidimensional data cubes and multidimensional data tables.  The discrimination description expressed in the form of rules are referred as Discrimination Rules. 8 What are association rules? Give an example Ans: Association Rules are a data mining technique used to discover interesting relationships or patterns between items in a dataset. They are commonly used in market basket analysis to understand how items are frequently bought together. Example of Association Rules:  Rule: {Milk} → {Bread}  Antecedent: Milk  Consequent: Bread  Support: 20% of transactions contain both milk and bread.  Confidence: 70% of transactions that contain milk also contain bread.  Lift: Indicates how much more likely bread is purchased when milk is purchased, compared to if there were no association.  Interpretation: This rule suggests that customers who buy milk are likely to also buy bread. 9 Differentiate between classification and clustering. Ans: Aspect Classification Clustering Objective Assign predefined labels or categories to new data points. Group similar data points together without predefined labels. Supervised or Unsupervised Supervised learning (requires labeled training data). Unsupervised learning (does not require labeled data). Output Class labels or categories for each data point. Groups or clusters of similar data points. Examples Email spam detection (spam or not spam), medical diagnosis. Customer segmentation, grouping similar documents. Training Data Requires a labeled dataset where the outcomes are known. Uses an unlabeled dataset with no predefined outcomes. Model Building Builds a model based on training data to predict classes. Identifies patterns or similarities to form clusters.
  11. DATA MINING QUESTION BANK Evaluation Accuracy, precision, recall, F1 score,

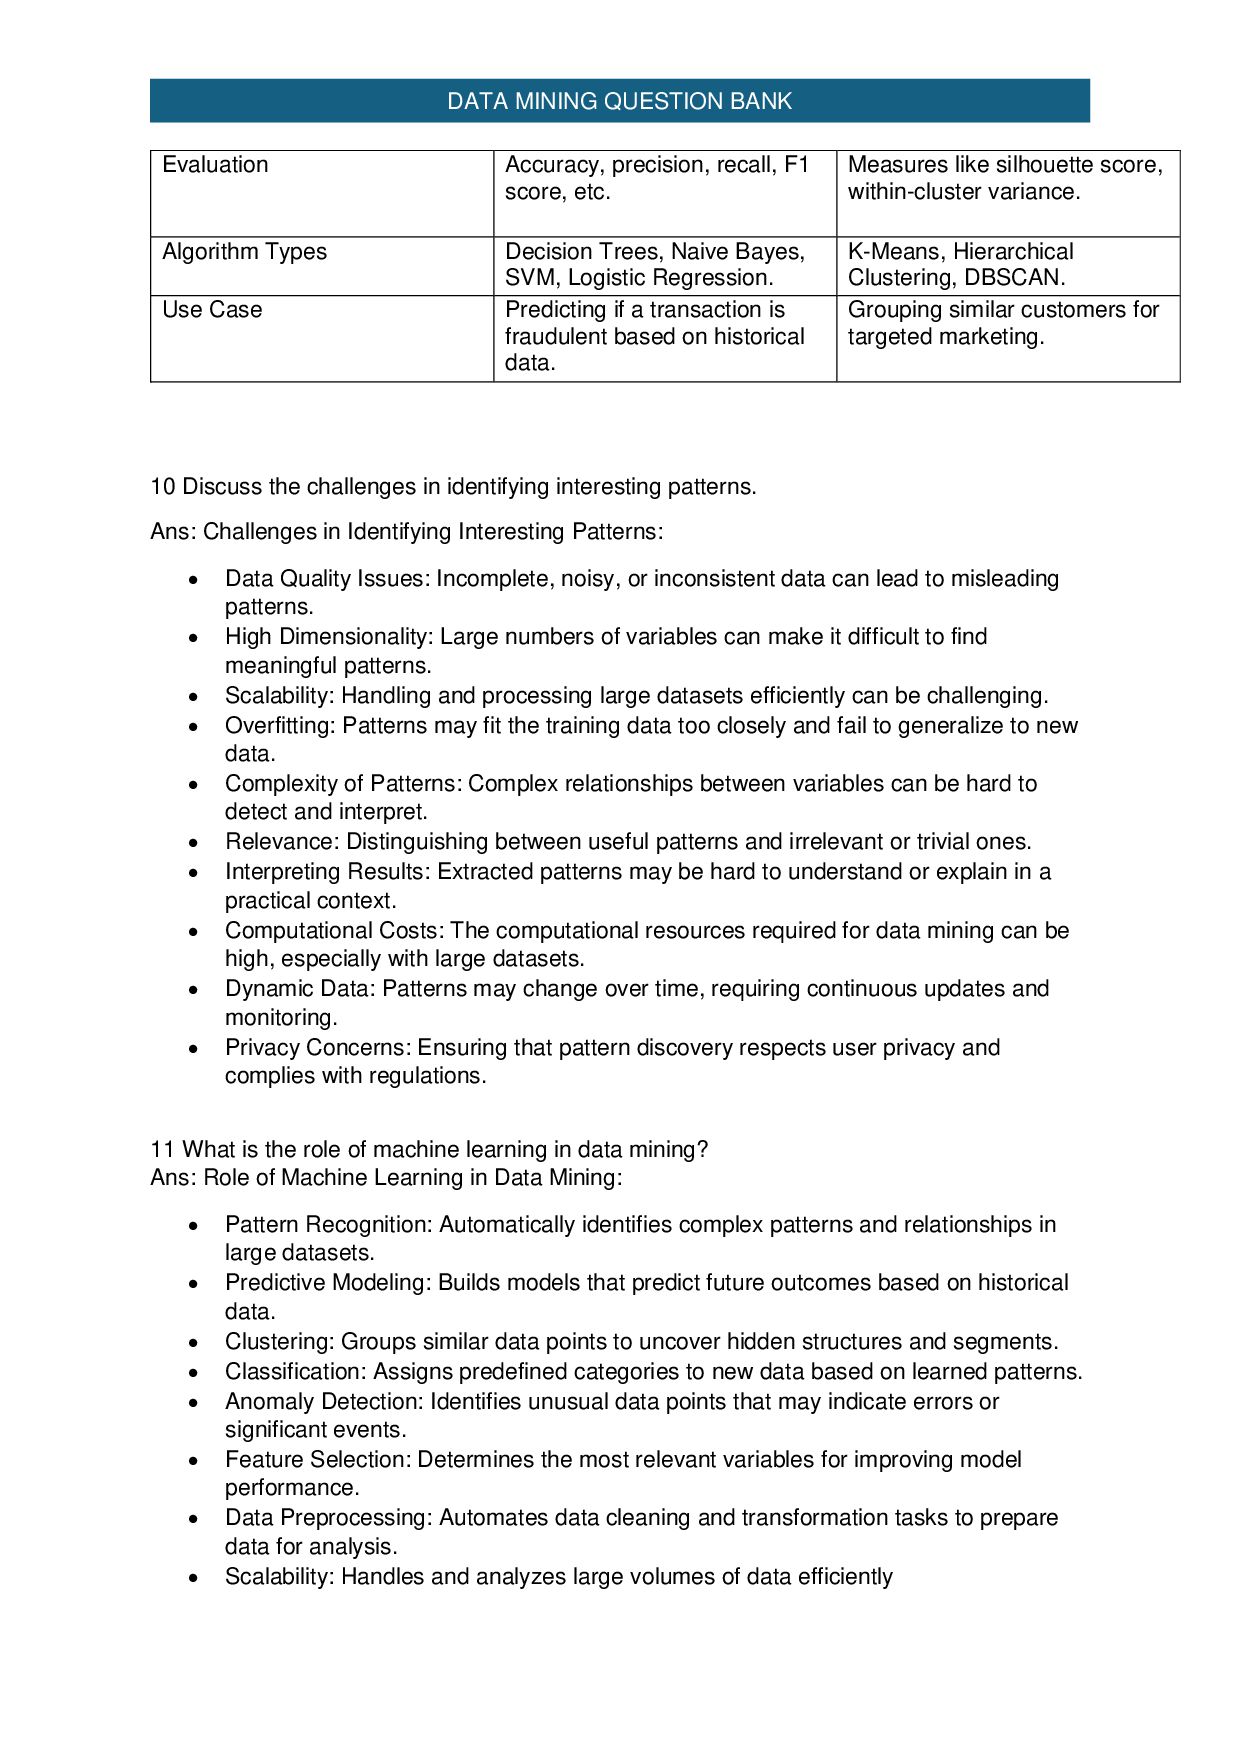
    etc. Measures like silhouette score, within-cluster variance. Algorithm Types Decision Trees, Naive Bayes, SVM, Logistic Regression. K-Means, Hierarchical Clustering, DBSCAN. Use Case Predicting if a transaction is fraudulent based on historical data. Grouping similar customers for targeted marketing. 10 Discuss the challenges in identifying interesting patterns. Ans: Challenges in Identifying Interesting Patterns:  Data Quality Issues: Incomplete, noisy, or inconsistent data can lead to misleading patterns.  High Dimensionality: Large numbers of variables can make it difficult to find meaningful patterns.  Scalability: Handling and processing large datasets efficiently can be challenging.  Overfitting: Patterns may fit the training data too closely and fail to generalize to new data.  Complexity of Patterns: Complex relationships between variables can be hard to detect and interpret.  Relevance: Distinguishing between useful patterns and irrelevant or trivial ones.  Interpreting Results: Extracted patterns may be hard to understand or explain in a practical context.  Computational Costs: The computational resources required for data mining can be high, especially with large datasets.  Dynamic Data: Patterns may change over time, requiring continuous updates and monitoring.  Privacy Concerns: Ensuring that pattern discovery respects user privacy and complies with regulations. 11 What is the role of machine learning in data mining? Ans: Role of Machine Learning in Data Mining:  Pattern Recognition: Automatically identifies complex patterns and relationships in large datasets.  Predictive Modeling: Builds models that predict future outcomes based on historical data.  Clustering: Groups similar data points to uncover hidden structures and segments.  Classification: Assigns predefined categories to new data based on learned patterns.  Anomaly Detection: Identifies unusual data points that may indicate errors or significant events.  Feature Selection: Determines the most relevant variables for improving model performance.  Data Preprocessing: Automates data cleaning and transformation tasks to prepare data for analysis.  Scalability: Handles and analyzes large volumes of data efficiently
  12. DATA MINING QUESTION BANK 12 What are the major challenges

    in data mining? Ans: Major Challenges in Data Mining:  Data Quality: Handling incomplete, noisy, and inconsistent data.  Data Integration: Combining data from multiple sources with different formats and structures.  Scalability: Managing and processing large datasets efficiently.  High Dimensionality: Dealing with a large number of features or variables.  Overfitting: Avoiding models that perform well on training data but poorly on new data.  Interpretability: Making complex models and patterns understandable and actionable.  Privacy and Security: Ensuring data mining practices comply with privacy regulations and safeguard sensitive information.  Dynamic Data: Adapting to changes in data patterns over time. 13 Describe the typical steps involved in a data mining process (KDD process) Ans: KDD Process steps:- 1.Data Selection: Choosing relevant data from various sources. 2.Data Preprocessing: Cleaning and preparing the data for analysis. 3.Data Transformation: Converting data into a suitable format or structure for mining. 4.Data Mining: Applying algorithms to extract patterns, trends, and relationships from the data. 5.Evaluation: Assessing the patterns and knowledge discovered to ensure they are valid and useful. 6.Knowledge Presentation: Presenting the results in a format that is understandable and actionable, such as reports or visualizations. 14 How is data quality important in data mining? Ans: Importance of Data Quality in Data Mining:  Accuracy: Ensures that the patterns and insights derived are reliable and true to the real-world scenario.  Consistency: Prevents conflicting results from data that is inconsistent or contradictory.  Completeness: Provides a full picture by avoiding gaps or missing values that could skew results.  Relevance: Ensures that the data used is pertinent to the problem being addressed.  Trustworthiness: Builds confidence in the analysis and results derived from the data.  Efficiency: Reduces the time and resources needed for data cleaning and preprocessing.  Model Performance: Enhances the effectiveness of machine learning models by providing high-quality input data.
  13. DATA MINING QUESTION BANK 15 Explain the Data Mining Architecture

    in detail? Ans: Data Mining Architecture involves various components and stages designed to efficiently extract useful knowledge from large datasets. 1. Data Sources: Description: Various sources from which data is collected, including databases, data warehouses, flat files, external sources, and real-time data streams. Purpose: Provide the raw data that will be analyzed and mined. 2. Data Integration: Description: The process of combining data from different sources into a unified format. Purpose: Ensure consistency and provide a comprehensive dataset for mining. Components: ETL (Extract, Transform, Load) tools, data integration platforms. 3. Data Preprocessing: Description: Cleaning and preparing data for analysis by handling missing values, noise, and inconsistencies. Purpose: Improve data quality and ensure accurate mining results. Components: Data cleaning, normalization, transformation, and feature selection techniques. 4. Data Storage: Description: Storing preprocessed data in a structured format, often in databases or data warehouses. Purpose: Provide a central repository for data that can be efficiently accessed and queried. Components: Databases, data warehouses, distributed storage systems. 5. Data Mining Engine: Description: The core component that applies algorithms and techniques to discover patterns, trends, and relationships in the data. Purpose: Extract meaningful insights and knowledge from the data. Components: Machine learning algorithms, statistical methods, clustering, classification, association rules. 6. Pattern Evaluation: Description: Assessing the patterns and rules discovered by the data mining engine to determine their usefulness and relevance.
  14. DATA MINING QUESTION BANK Purpose: Validate and refine the results

    to ensure they are actionable and accurate. Components: Evaluation metrics like accuracy, precision, recall, and lift. 7. Knowledge Presentation: Description: Presenting the results of data mining in an understandable and actionable format, such as reports, dashboards, or visualizations. Purpose: Facilitate decision-making by making the insights easy to interpret. Components: Visualization tools, reporting systems, interactive dashboards. 8. Decision-Making: Description: Using the insights and knowledge derived from data mining to make informed decisions and take action. Purpose: Apply the mined knowledge to solve problems or capitalize on opportunities. Components: Business intelligence tools, decision support systems. Unit 2 : Data Pre-processing 16 What is data preprocessing? Why is it essential in the data mining process? Ans: Data preprocessing:- Data pre-processing is a data mining technique that involves transforming raw data (real world data) into an understandable format.  Real-world data is often incomplete, inconsistent, lacking in certain behaviors or trends and likely to contain many errors. Why it's essential:  Improves Accuracy: Clean and well-prepared data helps ensure the accuracy and reliability of the analysis and the models built.  Enhances Efficiency: Reduces the complexity of the data, making it easier and faster to process and analyze.
  15. DATA MINING QUESTION BANK  Facilitates Better Decision Making: High-quality

    data leads to more insightful and actionable results, helping organizations make informed decisions.  Prevents Misleading Results: Proper preprocessing helps avoid biases and errors that could lead to incorrect conclusions 17 What is data quality? How does poor data quality impact the data mining process? Ans: Data quality refers to the condition of data based on factors like accuracy, completeness, consistency, reliability, and relevance. High-quality data should be accurate, timely, and fit for its intended purpose. Poor data quality can significantly impact the data mining process in several ways:  Inaccurate Results: Errors and inaccuracies in the data can lead to misleading or incorrect results from data mining algorithms. This affects the validity of any insights or conclusions drawn.  Increased Complexity: Poor-quality data can make preprocessing more complex and time-consuming. More effort is required to clean, correct, and integrate data, which can delay the analysis process.  Reduced Model Performance: Data mining models trained on low-quality data may perform poorly, leading to less effective predictions or classifications. This can result in suboptimal decision-making.  Increased Costs: Addressing data quality issues after analysis can be more costly than dealing with them during preprocessing. It might require reprocessing or reanalysis, adding extra time and resources.  Loss of Trust: Stakeholders may lose confidence in the data-driven insights and decisions if they are aware of data quality issues, potentially undermining the value of the data mining efforts. 18 List the major tasks involved in data preprocessing. Explain the significance of each Ans: Major Task in Data-Preprocessing:- • Data Cleaning : • Data Integration: • Data Reduction : • Data Transformation : Data Cleaning:  Significance: Ensures that the data is accurate, consistent, and free from errors. It involves handling missing values, correcting inaccuracies, and removing duplicate records. Clean data is essential for reliable analysis and model performance. Data Integration:
  16. DATA MINING QUESTION BANK  Significance: Combines data from different

    sources into a unified dataset. This is important because data often resides in various systems or formats. Integration provides a comprehensive view and ensures consistency across data sources. Data Transformation:  Significance: Converts data into a suitable format or structure for analysis. This can include normalization (scaling data to a standard range), encoding categorical variables, or aggregating data. Transformation helps in aligning the data with the requirements of the analytical models. Data Reduction:  Significance: Reduces the volume of data while retaining its essential characteristics. Techniques include feature selection (choosing relevant attributes) and dimensionality reduction (reducing the number of features). This helps in speeding up processing and improving model performance. 19 What are missing values? Explain different types of missing values Ans: Missing values are gaps in a dataset where data points are absent or not recorded. They can occur for various reasons and can impact the quality and analysis of the data. There are three main types of missing data. 1. Missing Completely At Random (MCAR) 2. Missing At Random (MAR) 3. Missing Not At Random (MNAR) 1. Missing Completely at Random (MCAR):  Description: The probability of a value being missing is independent of both observed and unobserved data.  Impact: This type of missingness does not bias the results, as the missing data does not relate to any particular patterns. 2. Missing at Random (MAR):  Description: The probability of a value being missing is related to the observed data but not to the missing data itself.  Impact: The missing data is still unbiased but may require accounting for the observed variables to handle properly. 3. Missing Not at Random (MNAR):  Description: The probability of a value being missing is related to the unobserved data itself. For example, higher income individuals might not report their income.
  17. DATA MINING QUESTION BANK  Impact: This type of missingness

    can introduce bias and may require more sophisticated methods to handle, as it is influenced by the data that is missing. 20 What is data integration in data mining, and why is it necessary? Ans: Data Integration:  Merging of data collected from multiple sources.  Careful Integration can help reduce redundancies and inconsistencies in the resulting dataset.  Approaches in Data Integration : 1. Entity Identification problem 2. Redundancy and Correlation analysis 3. Tuple Duplication 4. Data Value conflict Detection and Resolution  Entity identification problem o Schema Integration and Object Matching are very important issues in Data Integration Schema integration: e.g., cust-id ,customer_id, cust_no,etc o Handling blank ,zero null values. Object Matching: Matching in structure of the data o e.g., Discount Issues, Currency type 20 How do you handle missing values? Discuss various techniques. Ans: Handling missing values involves several techniques, each suited to different types of missingness and data contexts. Here are some common methods: Remove Missing Values:  Description: Delete rows or columns with missing values.  When to Use: When the amount of missing data is small or the data is missing randomly. Useful for maintaining dataset size and integrity. Imputation with Mean/Median/Mode:  Description: Replace missing values with the mean, median, or mode of the column.  When to Use: For numerical data with MCAR or MAR missingness. Median is preferred for skewed distributions. Forward/Backward Fill:
  18. DATA MINING QUESTION BANK  Description: Use the previous (forward

    fill) or next (backward fill) value to replace missing entries.  When to Use: Time series data where the value is assumed to be stable over time. Interpolation:  Description: Estimate missing values using interpolation methods like linear interpolation.  When to Use: For time series or sequential data where values change gradually. Regression Imputation:  Description: Predict missing values using a regression model based on other variables.  When to Use: When there is a strong correlation between the missing value and other features. K-Nearest Neighbors (KNN) Imputation:  Description: Impute missing values based on the values of the nearest neighbors in the feature space.  When to Use: For datasets where similar observations can be identified to estimate missing values. 21 What is noisy data? Give examples of noise in data. Ans: Noisy data refers to data that contains random errors or variances that do not reflect the true values or patterns. Noise can obscure the underlying patterns in data and lead to inaccurate analysis or model performance. Examples of noise in data:  Measurement Errors: Example: A sensor recording temperature with slight deviations due to calibration issues, leading to inaccurate temperature readings.  Data Entry Errors: Example: Typographical errors in manually entered survey responses, such as "N/A" instead of "25" for age.  Outliers: Example: An unusually high income value recorded due to a data entry mistake, such as a value of $1,000,000 in a dataset where the maximum income is $100,000.  Duplicate Records: Example: Multiple entries for the same customer in a database due to system errors, leading to redundancy and confusion. 22 Explain the process of data cleaning. Ans: Data cleaning Preocess:-
  19. DATA MINING QUESTION BANK  Identify Missing Values: Detect gaps

    or null entries in the dataset.  Handle Missing Values: Choose methods like imputation, removal, or replacement.  Correct Errors: Fix inaccuracies, typos, and inconsistencies in the data.  Remove Duplicates: Eliminate duplicate records to avoid redundancy.  Standardize Data: Normalize formats, units, and scales for consistency.  Filter Outliers: Identify and manage extreme values that may skew results.  Validate Data: Ensure data conforms to expected ranges, types, and formats.  Integrate Data: Combine data from different sources, ensuring consistency and accuracy. 23 How can outliers affect data analysis? Ans: Skewed Results:  Effect: Outliers can distort statistical measures like mean and standard deviation, leading to inaccurate conclusions. Misleading Trends:  Effect: Outliers can create misleading trends or patterns in visualizations and analysis, affecting the interpretation of data. Model Performance:  Effect: Outliers can adversely affect the performance of predictive models, leading to poor accuracy or generalization. Increased Variability:  Effect: High variability introduced by outliers can make it harder to identify genuine patterns in the data. Distorted Relationships:  Effect: Relationships between variables can be skewed or misrepresented if outliers are not addressed. Invalid Assumptions:  Effect: Statistical tests and assumptions may become invalid if outliers are not considered, affecting the reliability of the analysis. 24 What is data integration? Ans: Data integration is the process of combining data from different sources into a unified and coherent dataset for analysis
  20. DATA MINING QUESTION BANK 25 What is the entity identification

    problem? How can it be resolved? Ans: Entity Identification Problem is the challenge of recognizing and matching different records that refer to the same real-world entity across diverse datasets. Resolution Steps:  Standardize Data: Normalize formats and values (e.g., address formats, names).  Use Unique Identifiers: Employ unique keys or IDs to link records.  Apply Matching Algorithms: Use algorithms for fuzzy matching and similarity comparisons.  Leverage Data Cleaning: Remove duplicates and correct errors before integration.  Manual Review: Validate matches through manual verification if needed. 26 How do you handle redundancy and correlation analysis in data integration? Ans: Handling Redundancy:  Identify Duplicates: Use algorithms or tools to find duplicate records.  Remove Duplicates: Eliminate or merge duplicate entries to avoid redundancy.  Consolidate Data: Combine redundant records, ensuring that no information is lost.  Standardize Records: Ensure consistency in data formats and values to facilitate accurate deduplication. Handling Correlation Analysis:  Analyse Correlations: Identify relationships between variables to understand dependencies.  Remove Highly Correlated Features: Consider eliminating redundant features that are highly correlated to reduce multicollinearity.  Feature Selection: Use techniques like Principal Component Analysis (PCA) to reduce dimensionality while retaining essential information.  Validate Models: Ensure that the integration process does not introduce misleading correlations that can affect model performance. 27 Explain tuple duplication and data value conflict detection. Ans: Tuple Duplication:  The use of denormalized tables (often done to improve performance by avoiding joins) is another source of data redundancy.  Inconsistencies often arise between various duplicates, due to inaccurate data entry or updating some but not all data occurrences Data Value conflict Detection and Resolution:  Attribute Values from different sources may differ. This may be due to differences in representation, scaling or encoding.  Ex- school curriculum (grading system)
  21. DATA MINING QUESTION BANK  Attributes may also differ on

    the abstraction level. Where an attribute in one system is recorded at, say, a lower abstraction level than the “same” attribute in another  Ex – Monthly total sales in a store & Monthly total sales from all stores in the region 28 How do you resolve data value conflicts? Ans: Resolve data value conflicts:-  Identify Conflicts: Detect discrepancies between data sources or records.  Assess Source Reliability: Evaluate the credibility and accuracy of each data source.  Determine Conflict Resolution Rules: Establish rules or criteria for choosing the correct value (e.g., most recent, most frequent).  Standardize Values: Normalize conflicting values to a consistent format or unit.  Merge Data: Integrate values based on resolution rules, ensuring no data loss.  Document Changes: Keep records of the changes made for transparency and future reference.  Validate Results: Verify that resolved data aligns with expected patterns and accuracy. 29 What is data reduction? Why is it necessary? Ans: Data Reduction:- Data reduction process reduces the size of data and makes it suitable and feasible for analysis.  In the reduction process, integrity of the data must be preserved and data volume is reduced Why it is Necessary:  Enhanced Performance: Reduces processing time and computational costs by minimizing the amount of data to analyze.  Improved Model Efficiency: Simplifies models, leading to faster training and better performance.  Storage Savings: Decreases the amount of storage required, which is crucial for handling large datasets.  Easier Visualization: Facilitates the visualization and interpretation of data by focusing on key features.  Reduced Noise: Helps in removing irrelevant or redundant data that can obscure patterns and insights. 30 Explain the concept of a histogram. How is it used in data reduction? Ans: A histogram is a graphical representation of the distribution of a dataset. It consists of bars where each bar represents the frequency (or count) of data points within a specific range or interval (bin). Components: 1. Bins: Intervals or ranges into which data is divided. 2. Frequency: The count of data points within each bin. 3. Bars: The height of each bar represents the frequency of data points in that bin.
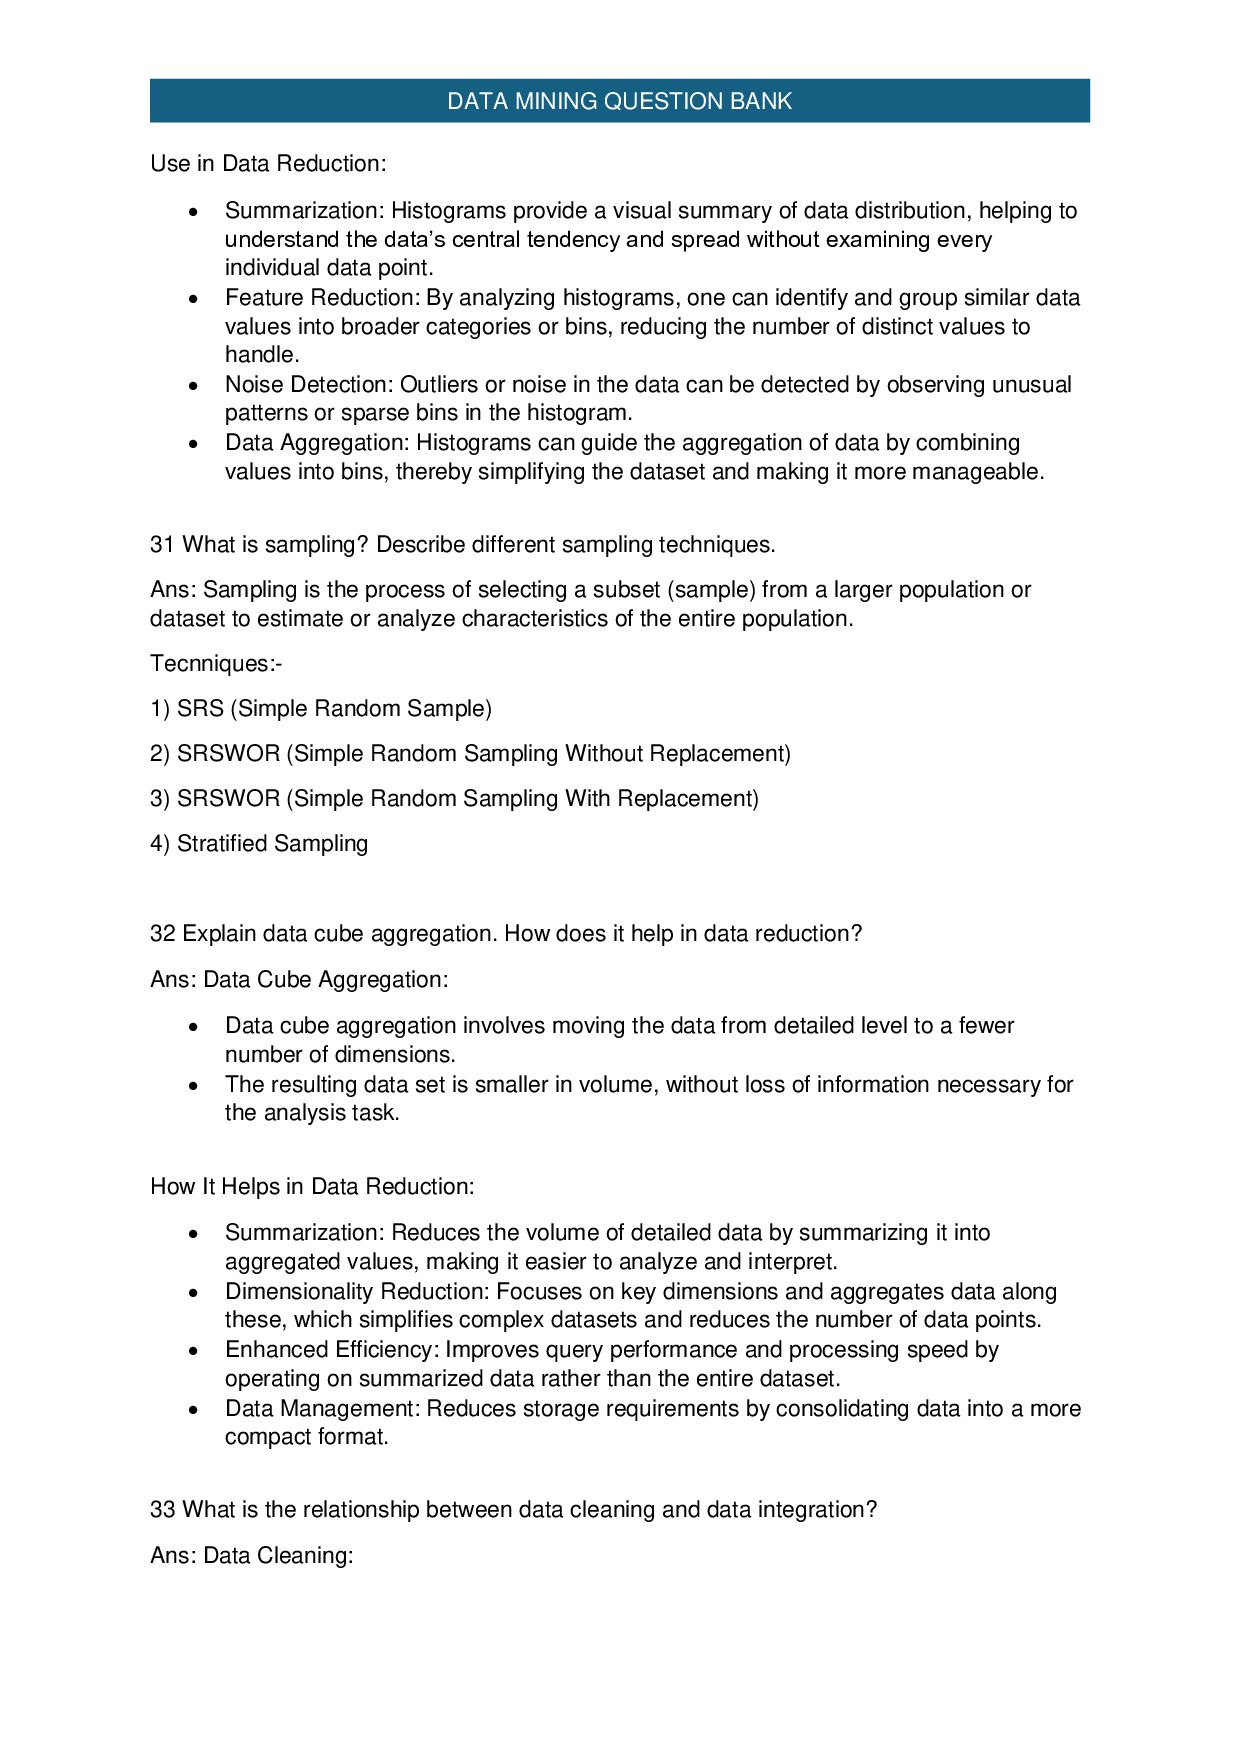
  22. DATA MINING QUESTION BANK Use in Data Reduction:  Summarization:

    Histograms provide a visual summary of data distribution, helping to understand the data’s central tendency and spread without examining every individual data point.  Feature Reduction: By analyzing histograms, one can identify and group similar data values into broader categories or bins, reducing the number of distinct values to handle.  Noise Detection: Outliers or noise in the data can be detected by observing unusual patterns or sparse bins in the histogram.  Data Aggregation: Histograms can guide the aggregation of data by combining values into bins, thereby simplifying the dataset and making it more manageable. 31 What is sampling? Describe different sampling techniques. Ans: Sampling is the process of selecting a subset (sample) from a larger population or dataset to estimate or analyze characteristics of the entire population. Tecnniques:- 1) SRS (Simple Random Sample) 2) SRSWOR (Simple Random Sampling Without Replacement) 3) SRSWOR (Simple Random Sampling With Replacement) 4) Stratified Sampling 32 Explain data cube aggregation. How does it help in data reduction? Ans: Data Cube Aggregation:  Data cube aggregation involves moving the data from detailed level to a fewer number of dimensions.  The resulting data set is smaller in volume, without loss of information necessary for the analysis task. How It Helps in Data Reduction:  Summarization: Reduces the volume of detailed data by summarizing it into aggregated values, making it easier to analyze and interpret.  Dimensionality Reduction: Focuses on key dimensions and aggregates data along these, which simplifies complex datasets and reduces the number of data points.  Enhanced Efficiency: Improves query performance and processing speed by operating on summarized data rather than the entire dataset.  Data Management: Reduces storage requirements by consolidating data into a more compact format. 33 What is the relationship between data cleaning and data integration? Ans: Data Cleaning:
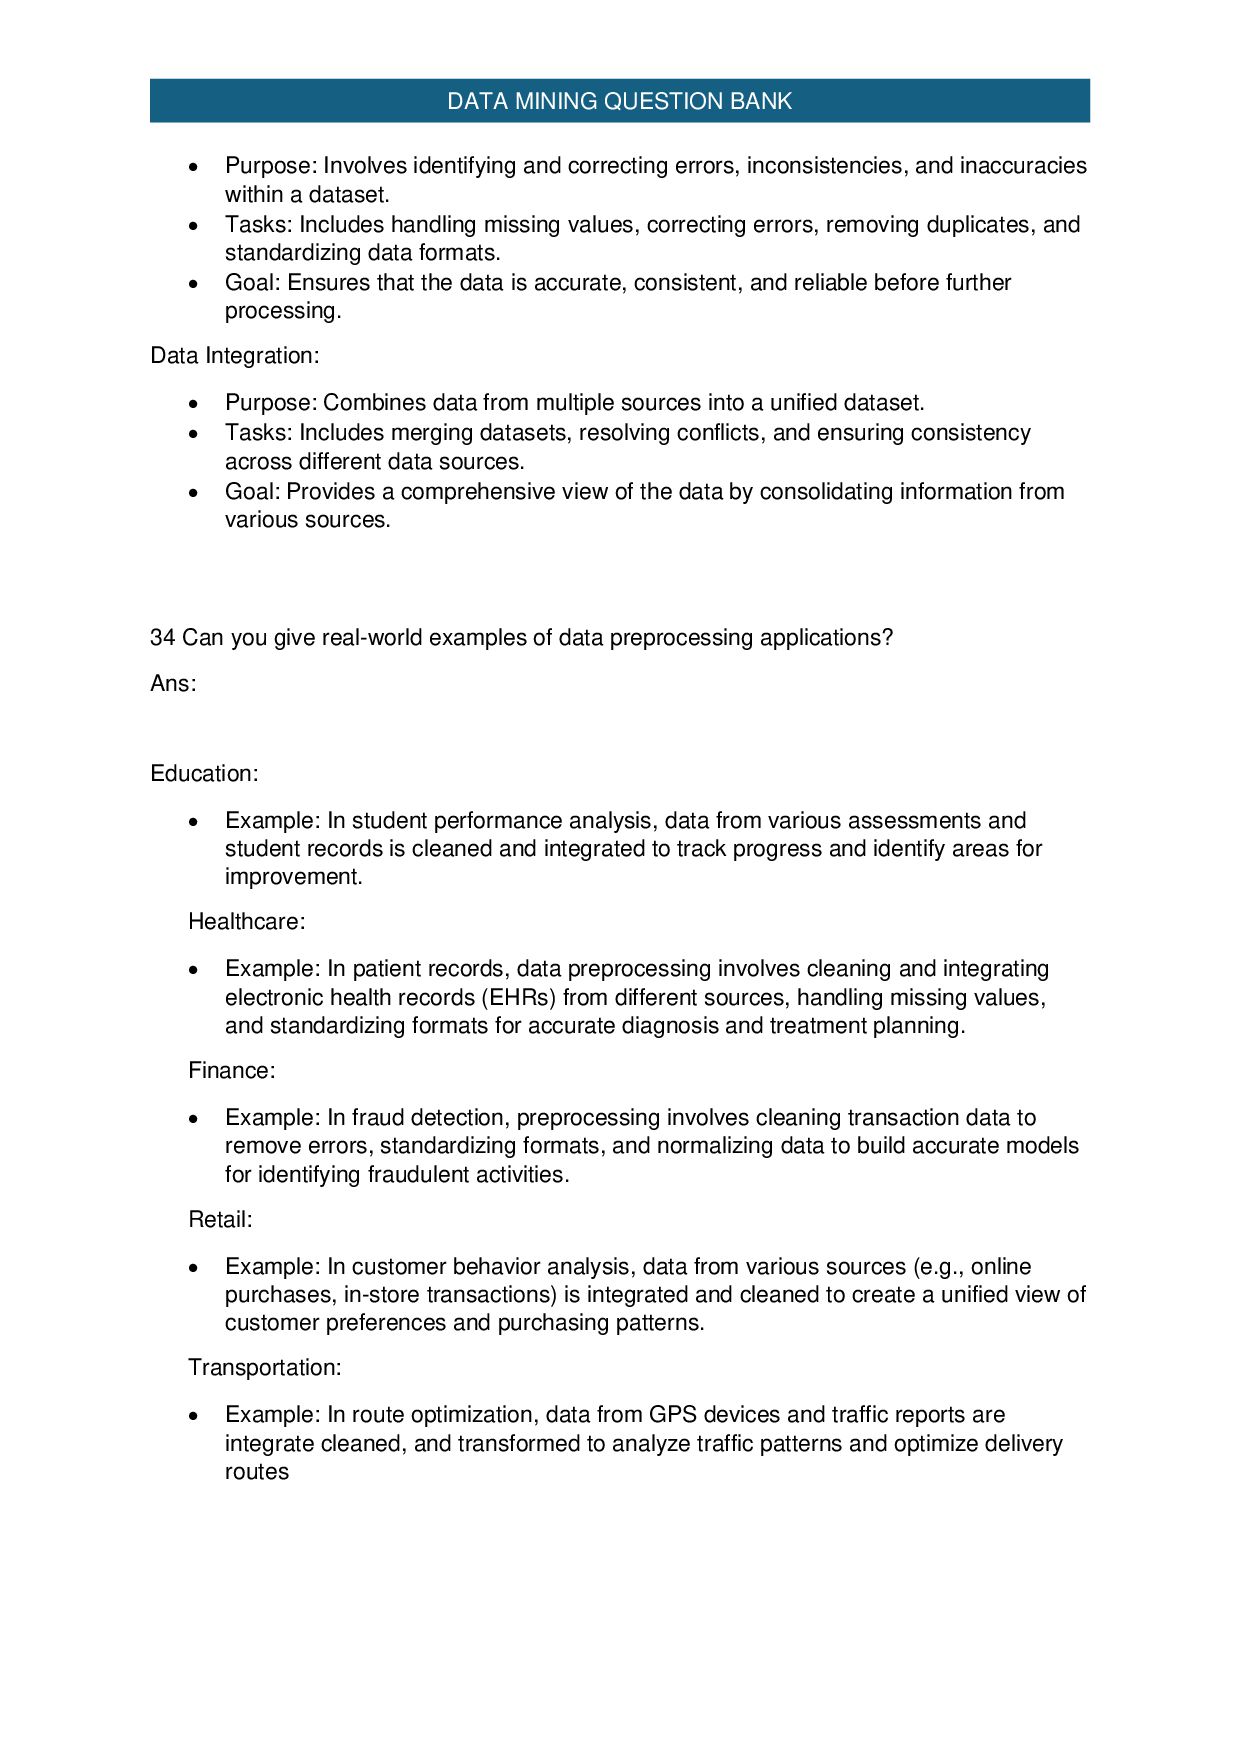
  23. DATA MINING QUESTION BANK  Purpose: Involves identifying and correcting

    errors, inconsistencies, and inaccuracies within a dataset.  Tasks: Includes handling missing values, correcting errors, removing duplicates, and standardizing data formats.  Goal: Ensures that the data is accurate, consistent, and reliable before further processing. Data Integration:  Purpose: Combines data from multiple sources into a unified dataset.  Tasks: Includes merging datasets, resolving conflicts, and ensuring consistency across different data sources.  Goal: Provides a comprehensive view of the data by consolidating information from various sources. 34 Can you give real-world examples of data preprocessing applications? Ans: Education:  Example: In student performance analysis, data from various assessments and student records is cleaned and integrated to track progress and identify areas for improvement. Healthcare:  Example: In patient records, data preprocessing involves cleaning and integrating electronic health records (EHRs) from different sources, handling missing values, and standardizing formats for accurate diagnosis and treatment planning. Finance:  Example: In fraud detection, preprocessing involves cleaning transaction data to remove errors, standardizing formats, and normalizing data to build accurate models for identifying fraudulent activities. Retail:  Example: In customer behavior analysis, data from various sources (e.g., online purchases, in-store transactions) is integrated and cleaned to create a unified view of customer preferences and purchasing patterns. Transportation:  Example: In route optimization, data from GPS devices and traffic reports are integrate cleaned, and transformed to analyze traffic patterns and optimize delivery routes
  24. DATA MINING QUESTION BANK Unit 3 : Data Warehouse 35

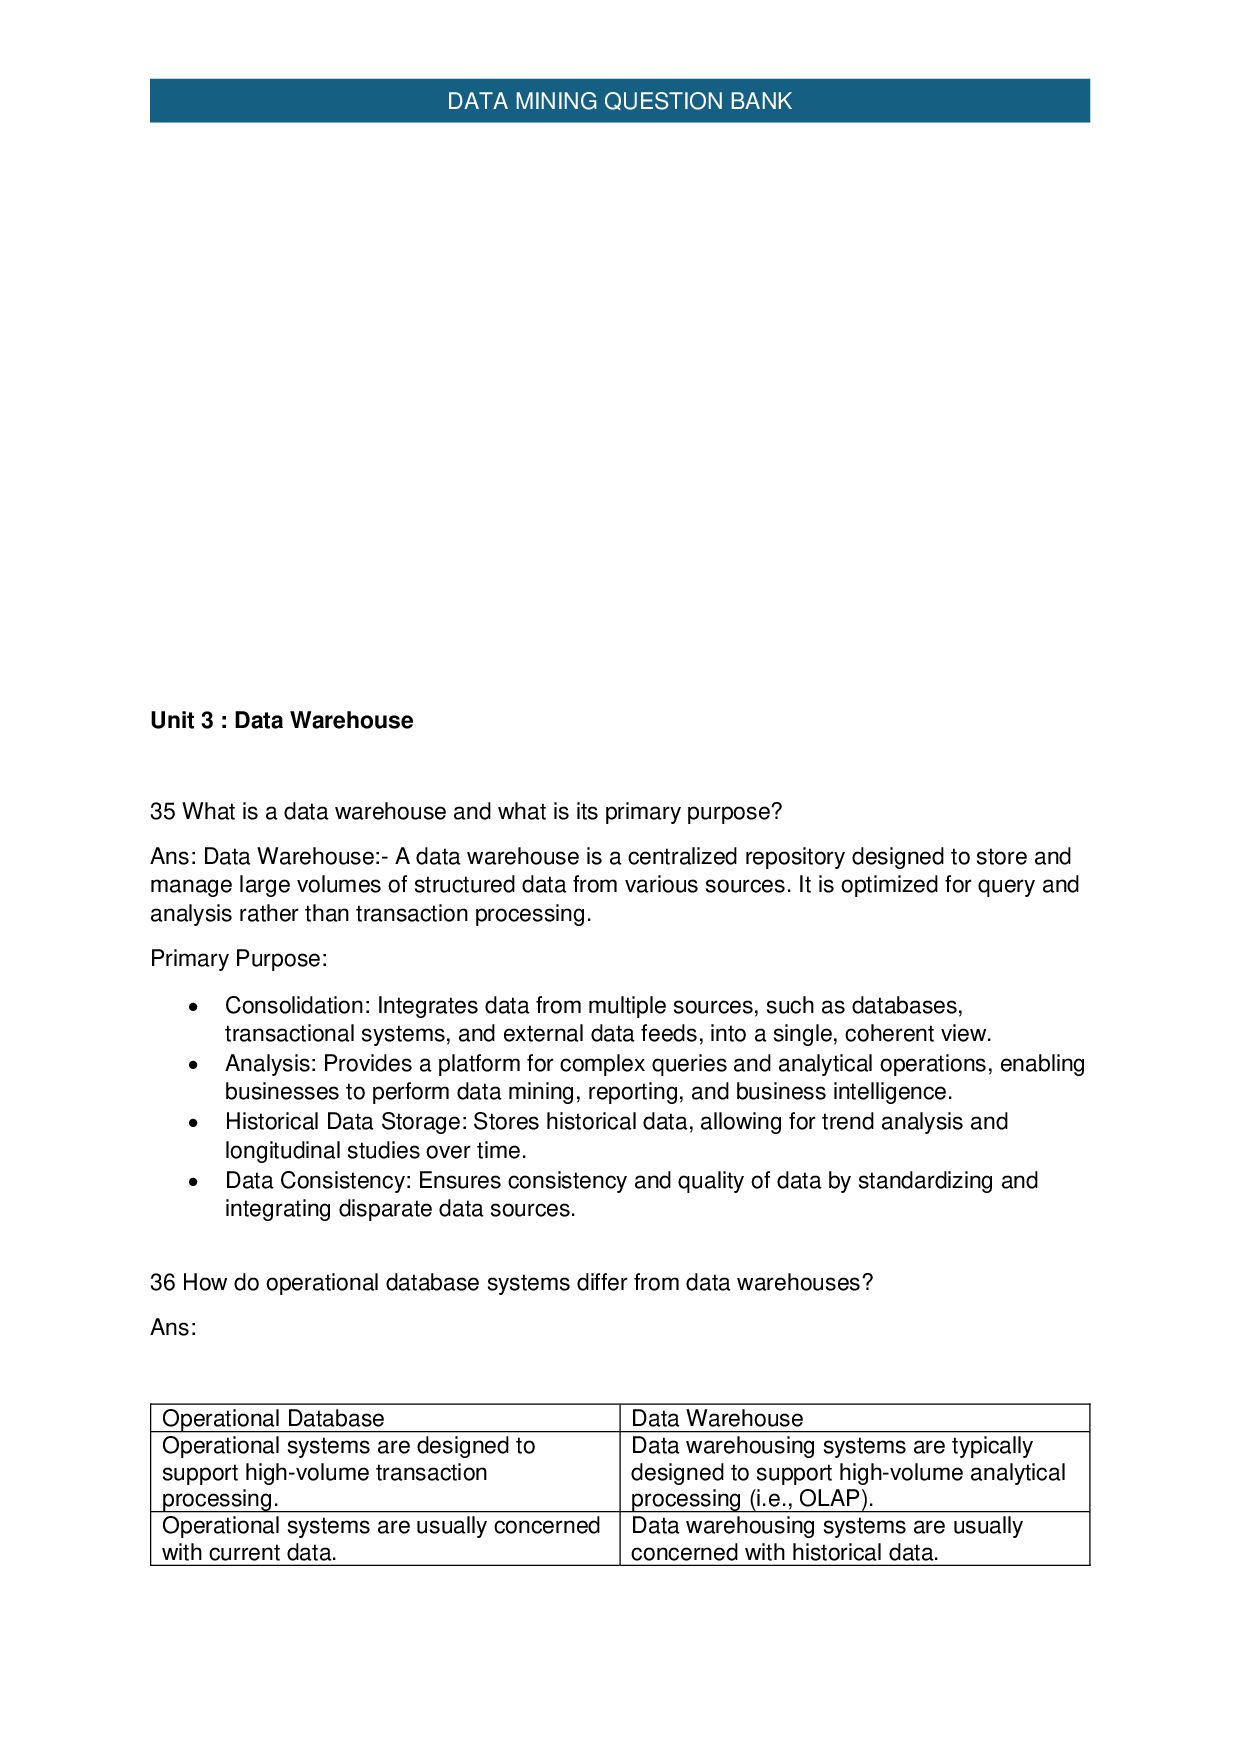
    What is a data warehouse and what is its primary purpose? Ans: Data Warehouse:- A data warehouse is a centralized repository designed to store and manage large volumes of structured data from various sources. It is optimized for query and analysis rather than transaction processing. Primary Purpose:  Consolidation: Integrates data from multiple sources, such as databases, transactional systems, and external data feeds, into a single, coherent view.  Analysis: Provides a platform for complex queries and analytical operations, enabling businesses to perform data mining, reporting, and business intelligence.  Historical Data Storage: Stores historical data, allowing for trend analysis and longitudinal studies over time.  Data Consistency: Ensures consistency and quality of data by standardizing and integrating disparate data sources. 36 How do operational database systems differ from data warehouses? Ans: Operational Database Data Warehouse Operational systems are designed to support high-volume transaction processing. Data warehousing systems are typically designed to support high-volume analytical processing (i.e., OLAP). Operational systems are usually concerned with current data. Data warehousing systems are usually concerned with historical data.
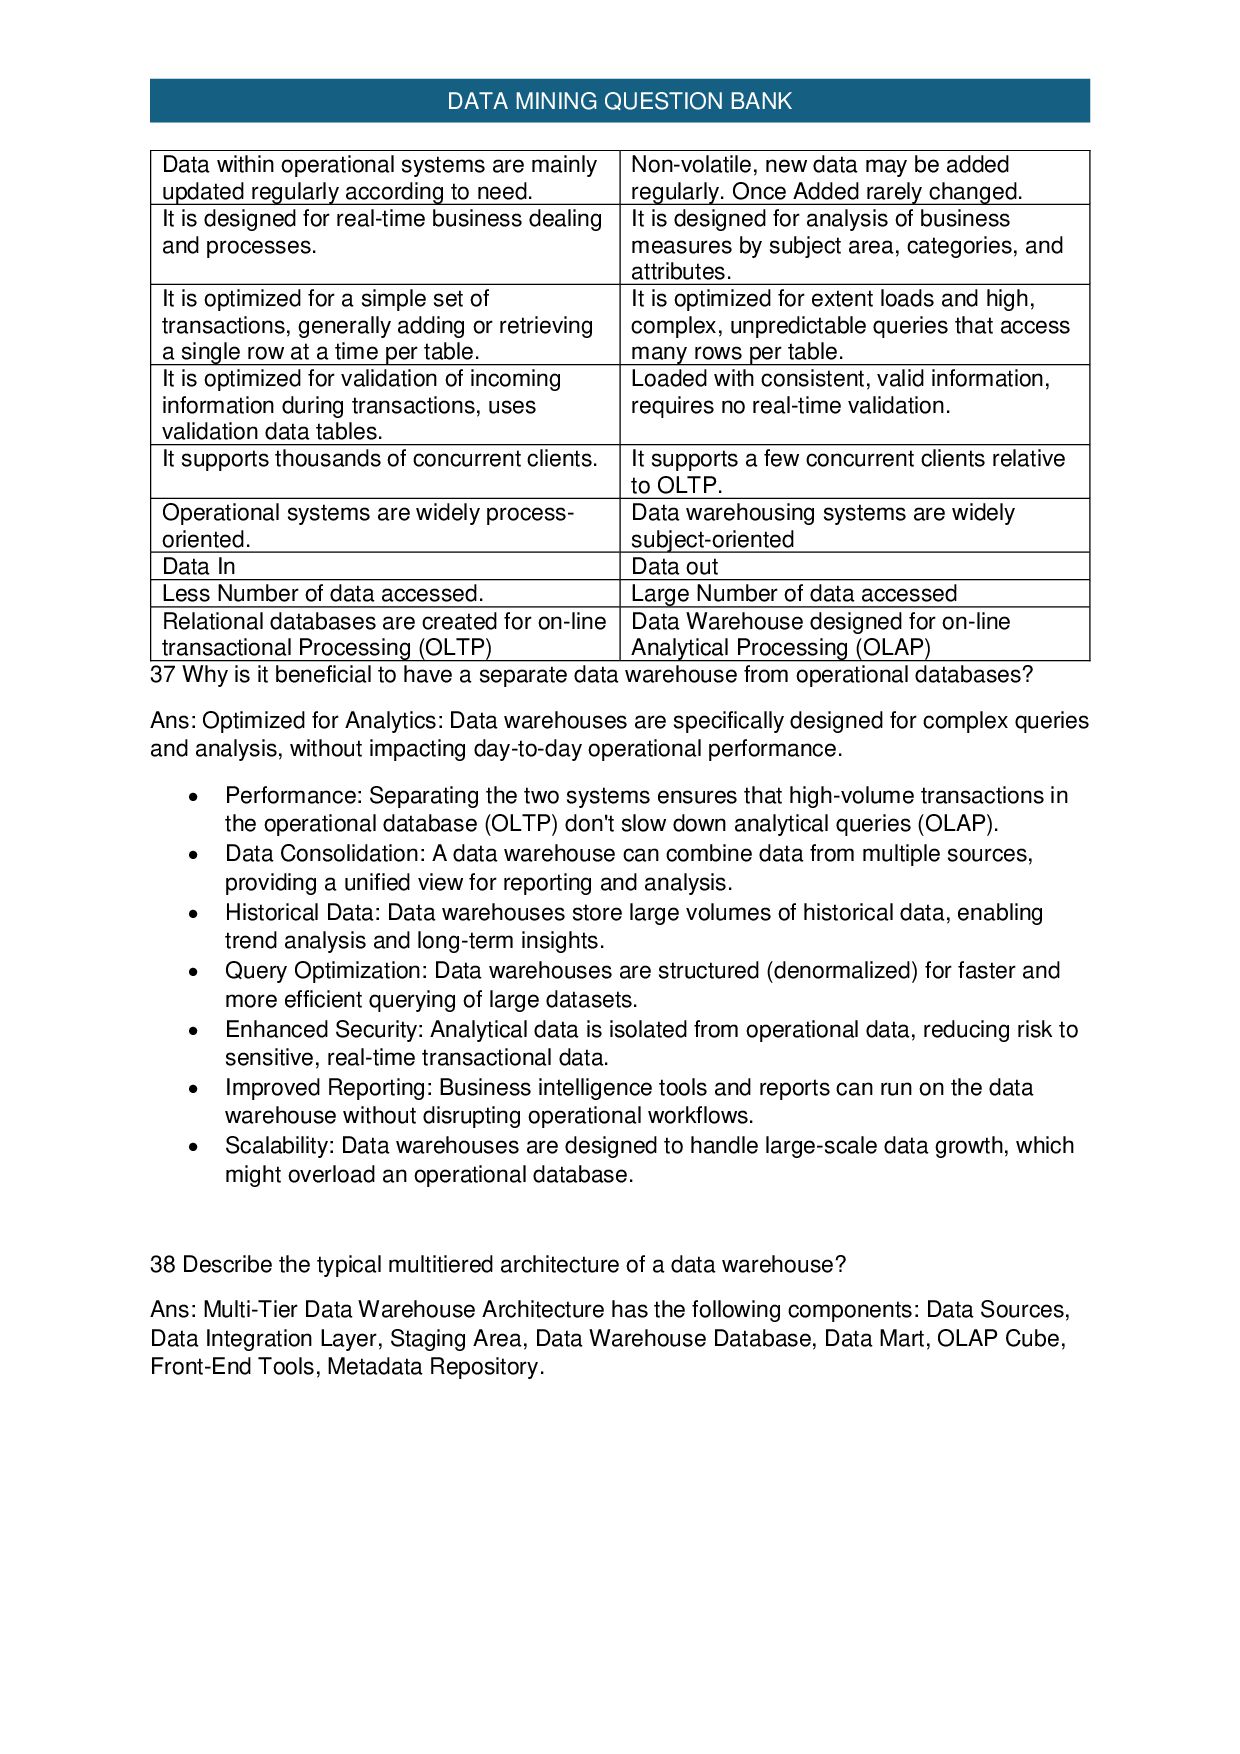
  25. DATA MINING QUESTION BANK Data within operational systems are mainly

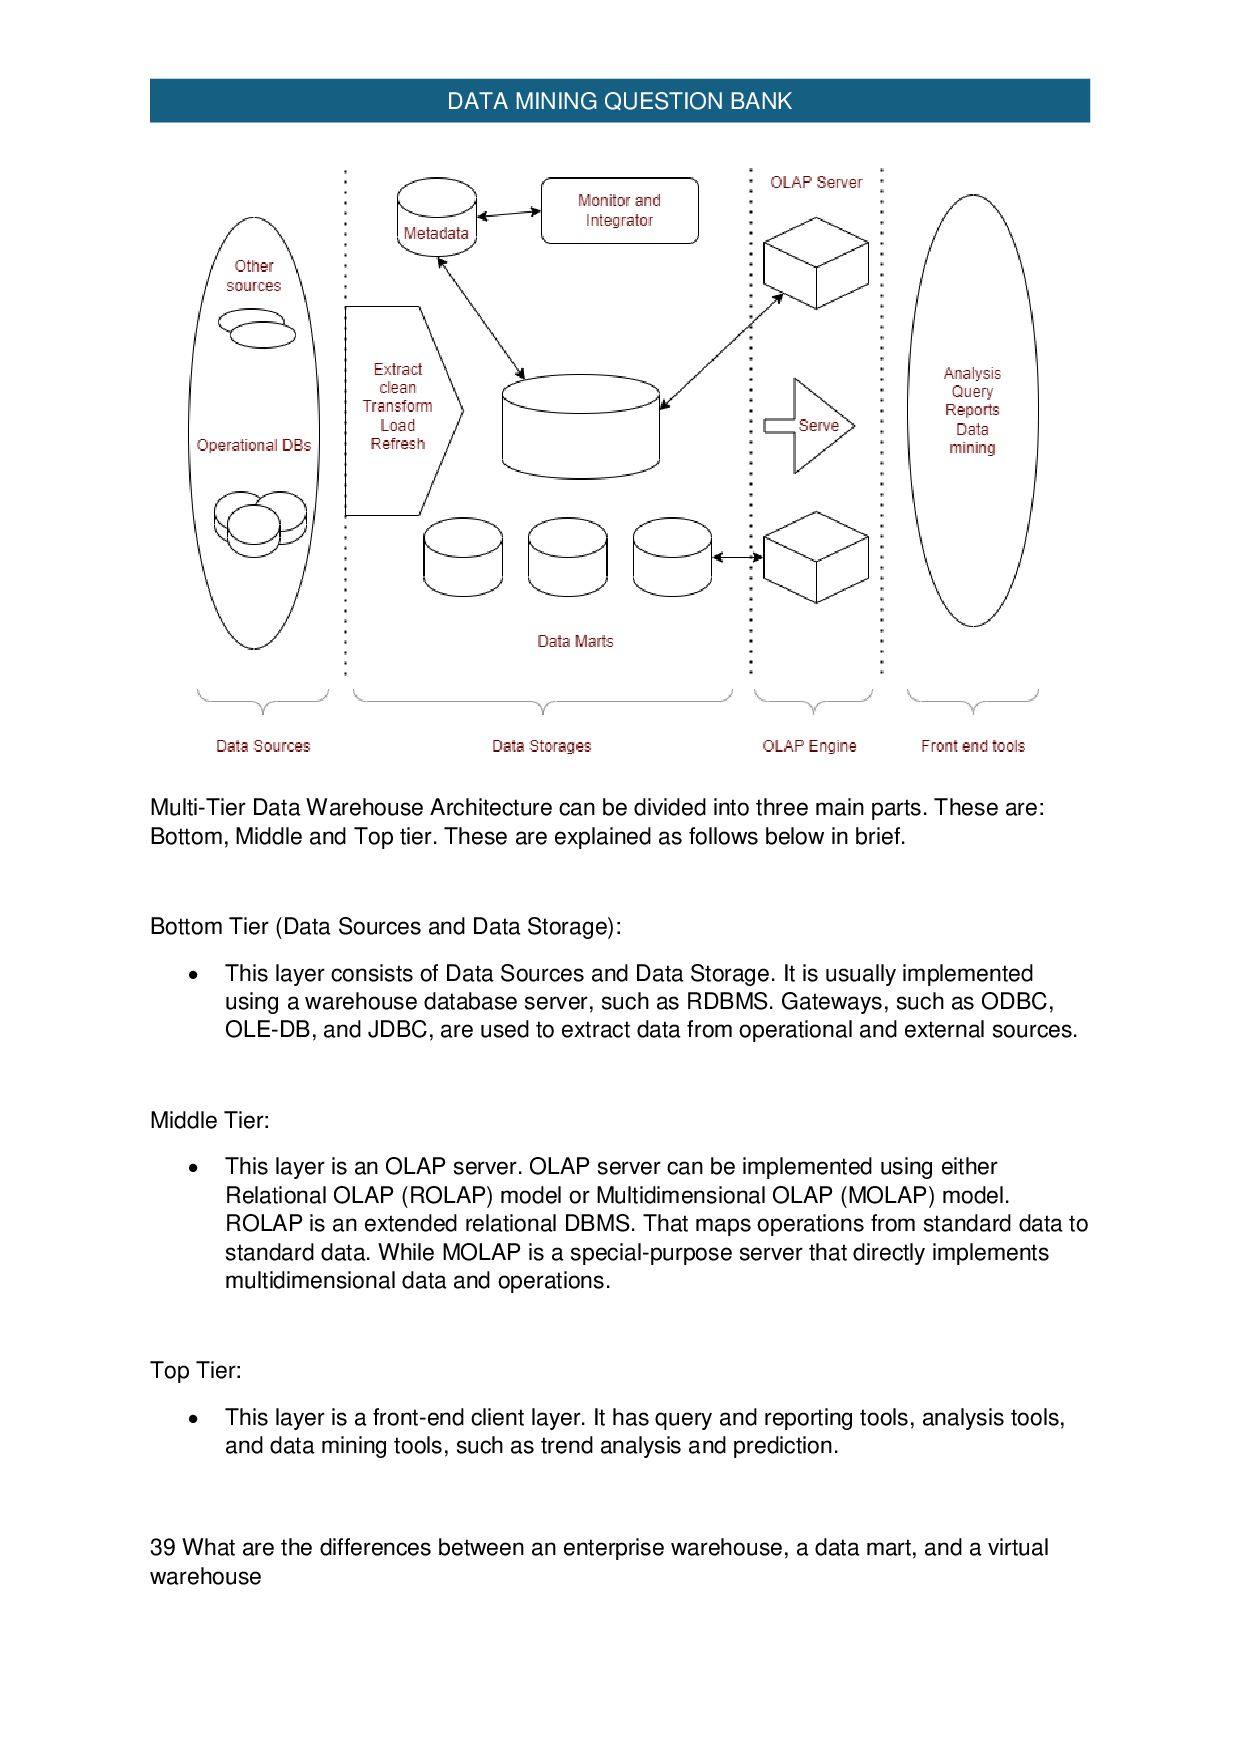
    updated regularly according to need. Non-volatile, new data may be added regularly. Once Added rarely changed. It is designed for real-time business dealing and processes. It is designed for analysis of business measures by subject area, categories, and attributes. It is optimized for a simple set of transactions, generally adding or retrieving a single row at a time per table. It is optimized for extent loads and high, complex, unpredictable queries that access many rows per table. It is optimized for validation of incoming information during transactions, uses validation data tables. Loaded with consistent, valid information, requires no real-time validation. It supports thousands of concurrent clients. It supports a few concurrent clients relative to OLTP. Operational systems are widely process- oriented. Data warehousing systems are widely subject-oriented Data In Data out Less Number of data accessed. Large Number of data accessed Relational databases are created for on-line transactional Processing (OLTP) Data Warehouse designed for on-line Analytical Processing (OLAP) 37 Why is it beneficial to have a separate data warehouse from operational databases? Ans: Optimized for Analytics: Data warehouses are specifically designed for complex queries and analysis, without impacting day-to-day operational performance.  Performance: Separating the two systems ensures that high-volume transactions in the operational database (OLTP) don't slow down analytical queries (OLAP).  Data Consolidation: A data warehouse can combine data from multiple sources, providing a unified view for reporting and analysis.  Historical Data: Data warehouses store large volumes of historical data, enabling trend analysis and long-term insights.  Query Optimization: Data warehouses are structured (denormalized) for faster and more efficient querying of large datasets.  Enhanced Security: Analytical data is isolated from operational data, reducing risk to sensitive, real-time transactional data.  Improved Reporting: Business intelligence tools and reports can run on the data warehouse without disrupting operational workflows.  Scalability: Data warehouses are designed to handle large-scale data growth, which might overload an operational database. 38 Describe the typical multitiered architecture of a data warehouse? Ans: Multi-Tier Data Warehouse Architecture has the following components: Data Sources, Data Integration Layer, Staging Area, Data Warehouse Database, Data Mart, OLAP Cube, Front-End Tools, Metadata Repository.
  26. DATA MINING QUESTION BANK Multi-Tier Data Warehouse Architecture can be

    divided into three main parts. These are: Bottom, Middle and Top tier. These are explained as follows below in brief. Bottom Tier (Data Sources and Data Storage):  This layer consists of Data Sources and Data Storage. It is usually implemented using a warehouse database server, such as RDBMS. Gateways, such as ODBC, OLE-DB, and JDBC, are used to extract data from operational and external sources. Middle Tier:  This layer is an OLAP server. OLAP server can be implemented using either Relational OLAP (ROLAP) model or Multidimensional OLAP (MOLAP) model. ROLAP is an extended relational DBMS. That maps operations from standard data to standard data. While MOLAP is a special-purpose server that directly implements multidimensional data and operations. Top Tier:  This layer is a front-end client layer. It has query and reporting tools, analysis tools, and data mining tools, such as trend analysis and prediction. 39 What are the differences between an enterprise warehouse, a data mart, and a virtual warehouse
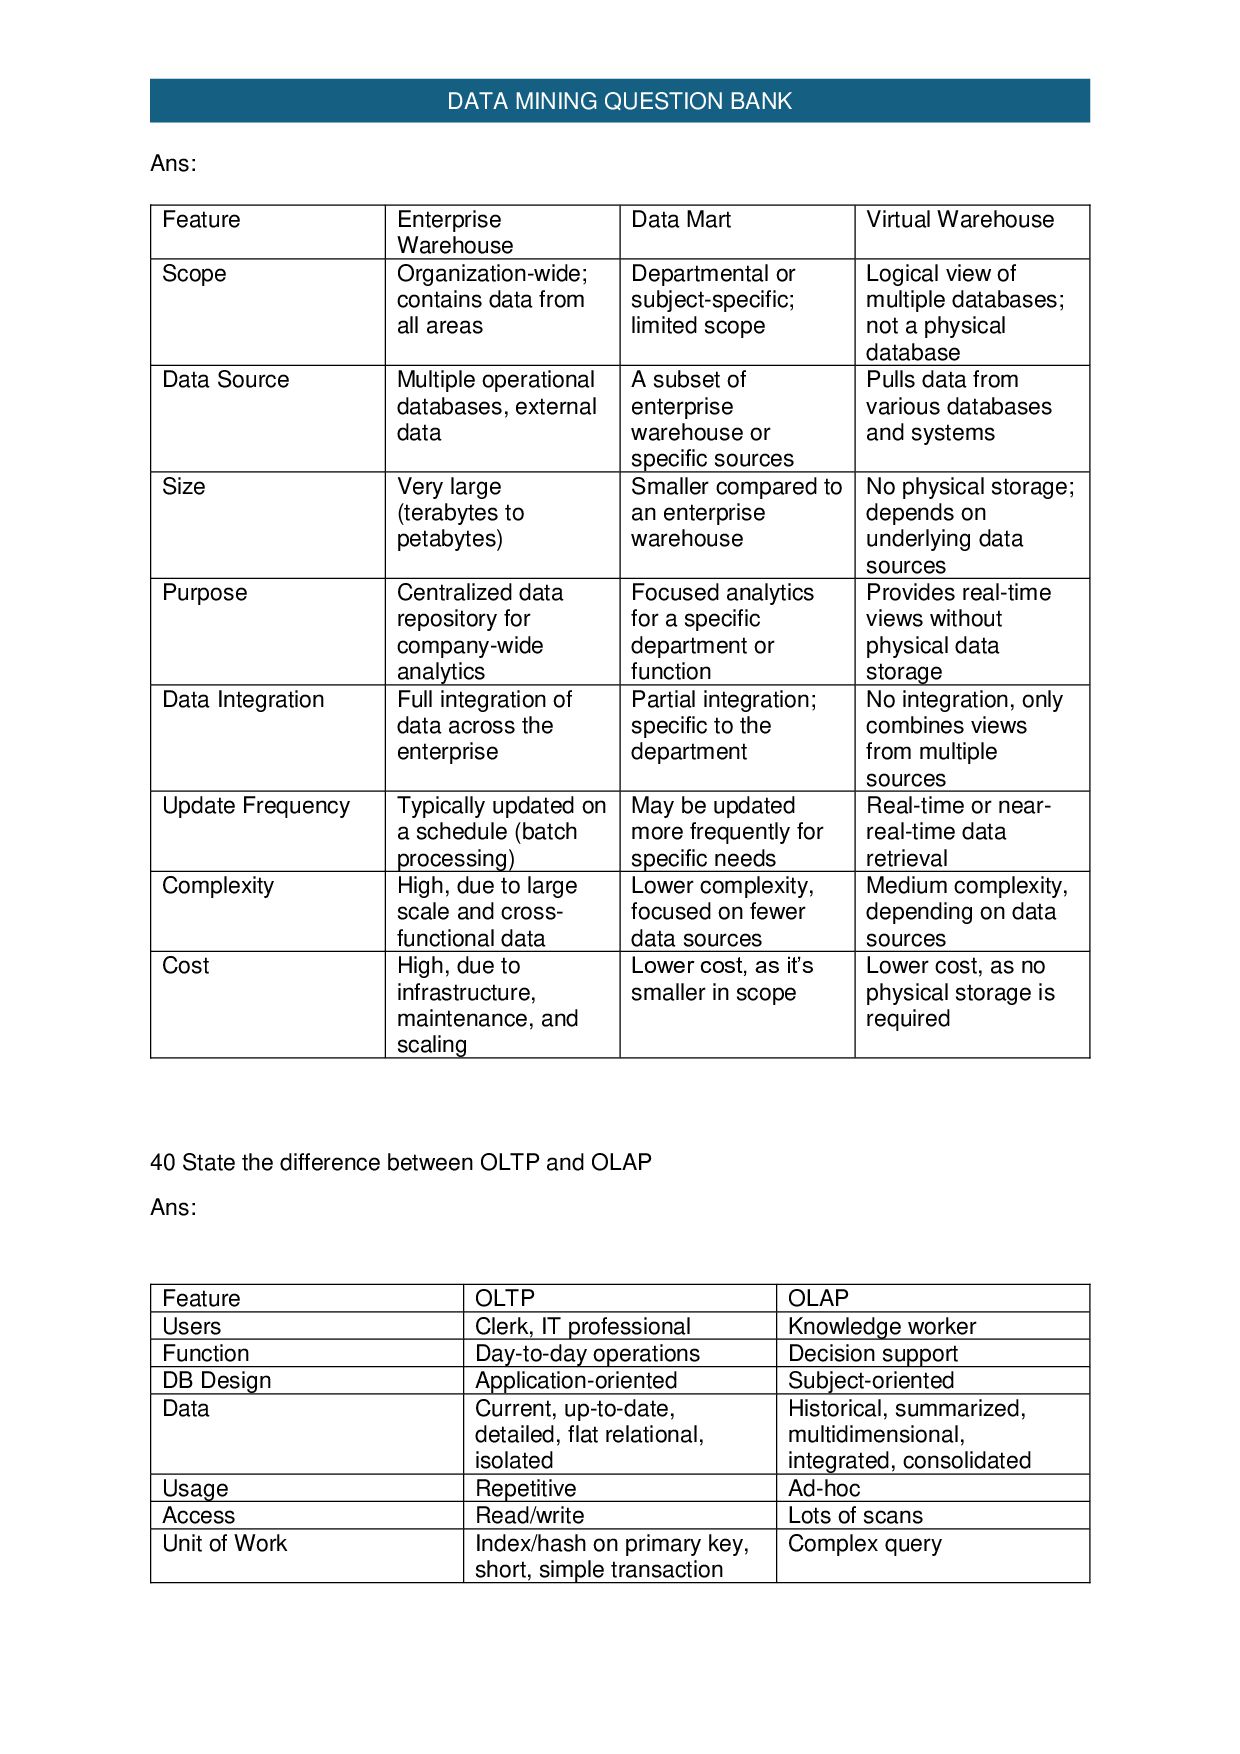
  27. DATA MINING QUESTION BANK Ans: 40 State the difference between

    OLTP and OLAP Ans: Feature OLTP OLAP Users Clerk, IT professional Knowledge worker Function Day-to-day operations Decision support DB Design Application-oriented Subject-oriented Data Current, up-to-date, detailed, flat relational, isolated Historical, summarized, multidimensional, integrated, consolidated Usage Repetitive Ad-hoc Access Read/write Lots of scans Unit of Work Index/hash on primary key, short, simple transaction Complex query Feature Enterprise Warehouse Data Mart Virtual Warehouse Scope Organization-wide; contains data from all areas Departmental or subject-specific; limited scope Logical view of multiple databases; not a physical database Data Source Multiple operational databases, external data A subset of enterprise warehouse or specific sources Pulls data from various databases and systems Size Very large (terabytes to petabytes) Smaller compared to an enterprise warehouse No physical storage; depends on underlying data sources Purpose Centralized data repository for company-wide analytics Focused analytics for a specific department or function Provides real-time views without physical data storage Data Integration Full integration of data across the enterprise Partial integration; specific to the department No integration, only combines views from multiple sources Update Frequency Typically updated on a schedule (batch processing) May be updated more frequently for specific needs Real-time or near- real-time data retrieval Complexity High, due to large scale and cross- functional data Lower complexity, focused on fewer data sources Medium complexity, depending on data sources Cost High, due to infrastructure, maintenance, and scaling Lower cost, as it’s smaller in scope Lower cost, as no physical storage is required
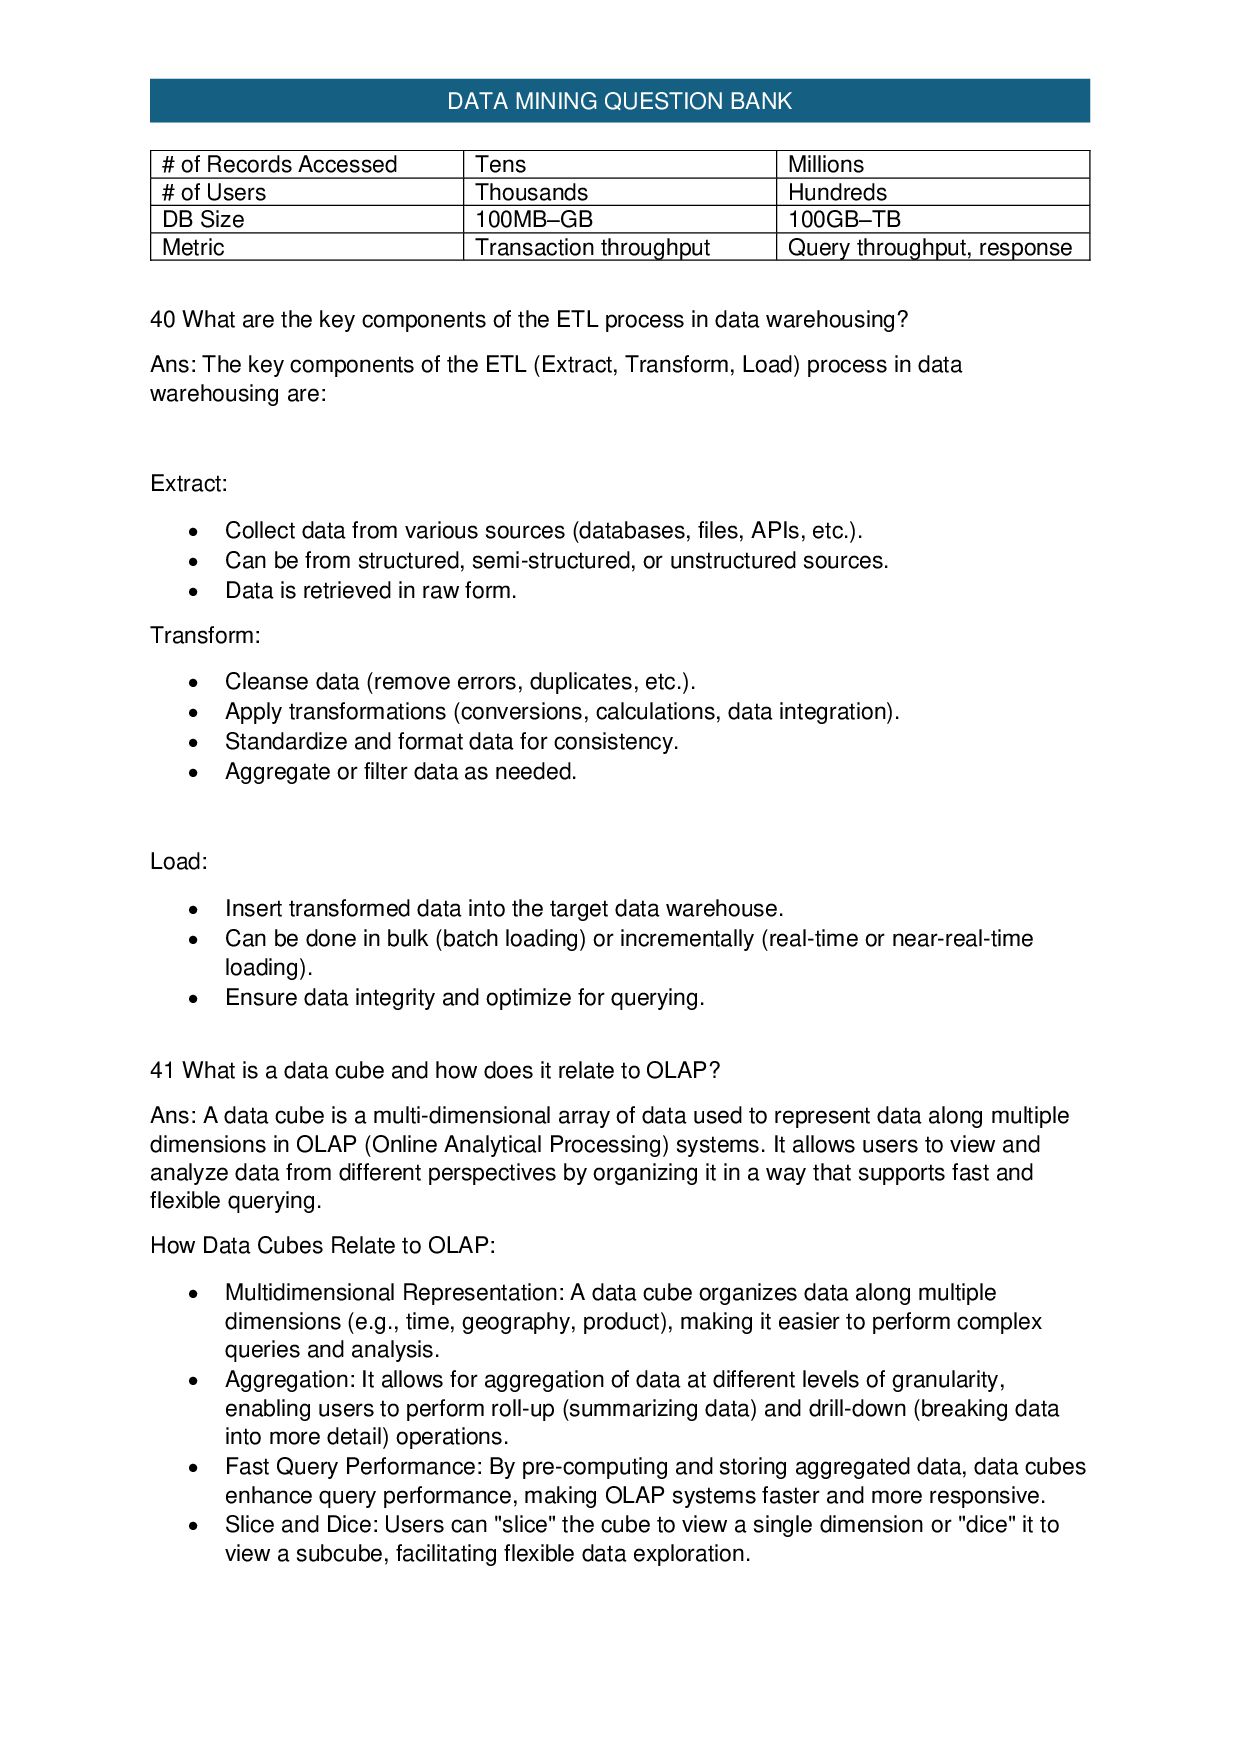
  28. DATA MINING QUESTION BANK # of Records Accessed Tens Millions

    # of Users Thousands Hundreds DB Size 100MB–GB 100GB–TB Metric Transaction throughput Query throughput, response 40 What are the key components of the ETL process in data warehousing? Ans: The key components of the ETL (Extract, Transform, Load) process in data warehousing are: Extract:  Collect data from various sources (databases, files, APIs, etc.).  Can be from structured, semi-structured, or unstructured sources.  Data is retrieved in raw form. Transform:  Cleanse data (remove errors, duplicates, etc.).  Apply transformations (conversions, calculations, data integration).  Standardize and format data for consistency.  Aggregate or filter data as needed. Load:  Insert transformed data into the target data warehouse.  Can be done in bulk (batch loading) or incrementally (real-time or near-real-time loading).  Ensure data integrity and optimize for querying. 41 What is a data cube and how does it relate to OLAP? Ans: A data cube is a multi-dimensional array of data used to represent data along multiple dimensions in OLAP (Online Analytical Processing) systems. It allows users to view and analyze data from different perspectives by organizing it in a way that supports fast and flexible querying. How Data Cubes Relate to OLAP:  Multidimensional Representation: A data cube organizes data along multiple dimensions (e.g., time, geography, product), making it easier to perform complex queries and analysis.  Aggregation: It allows for aggregation of data at different levels of granularity, enabling users to perform roll-up (summarizing data) and drill-down (breaking data into more detail) operations.  Fast Query Performance: By pre-computing and storing aggregated data, data cubes enhance query performance, making OLAP systems faster and more responsive.  Slice and Dice: Users can "slice" the cube to view a single dimension or "dice" it to view a subcube, facilitating flexible data exploration.
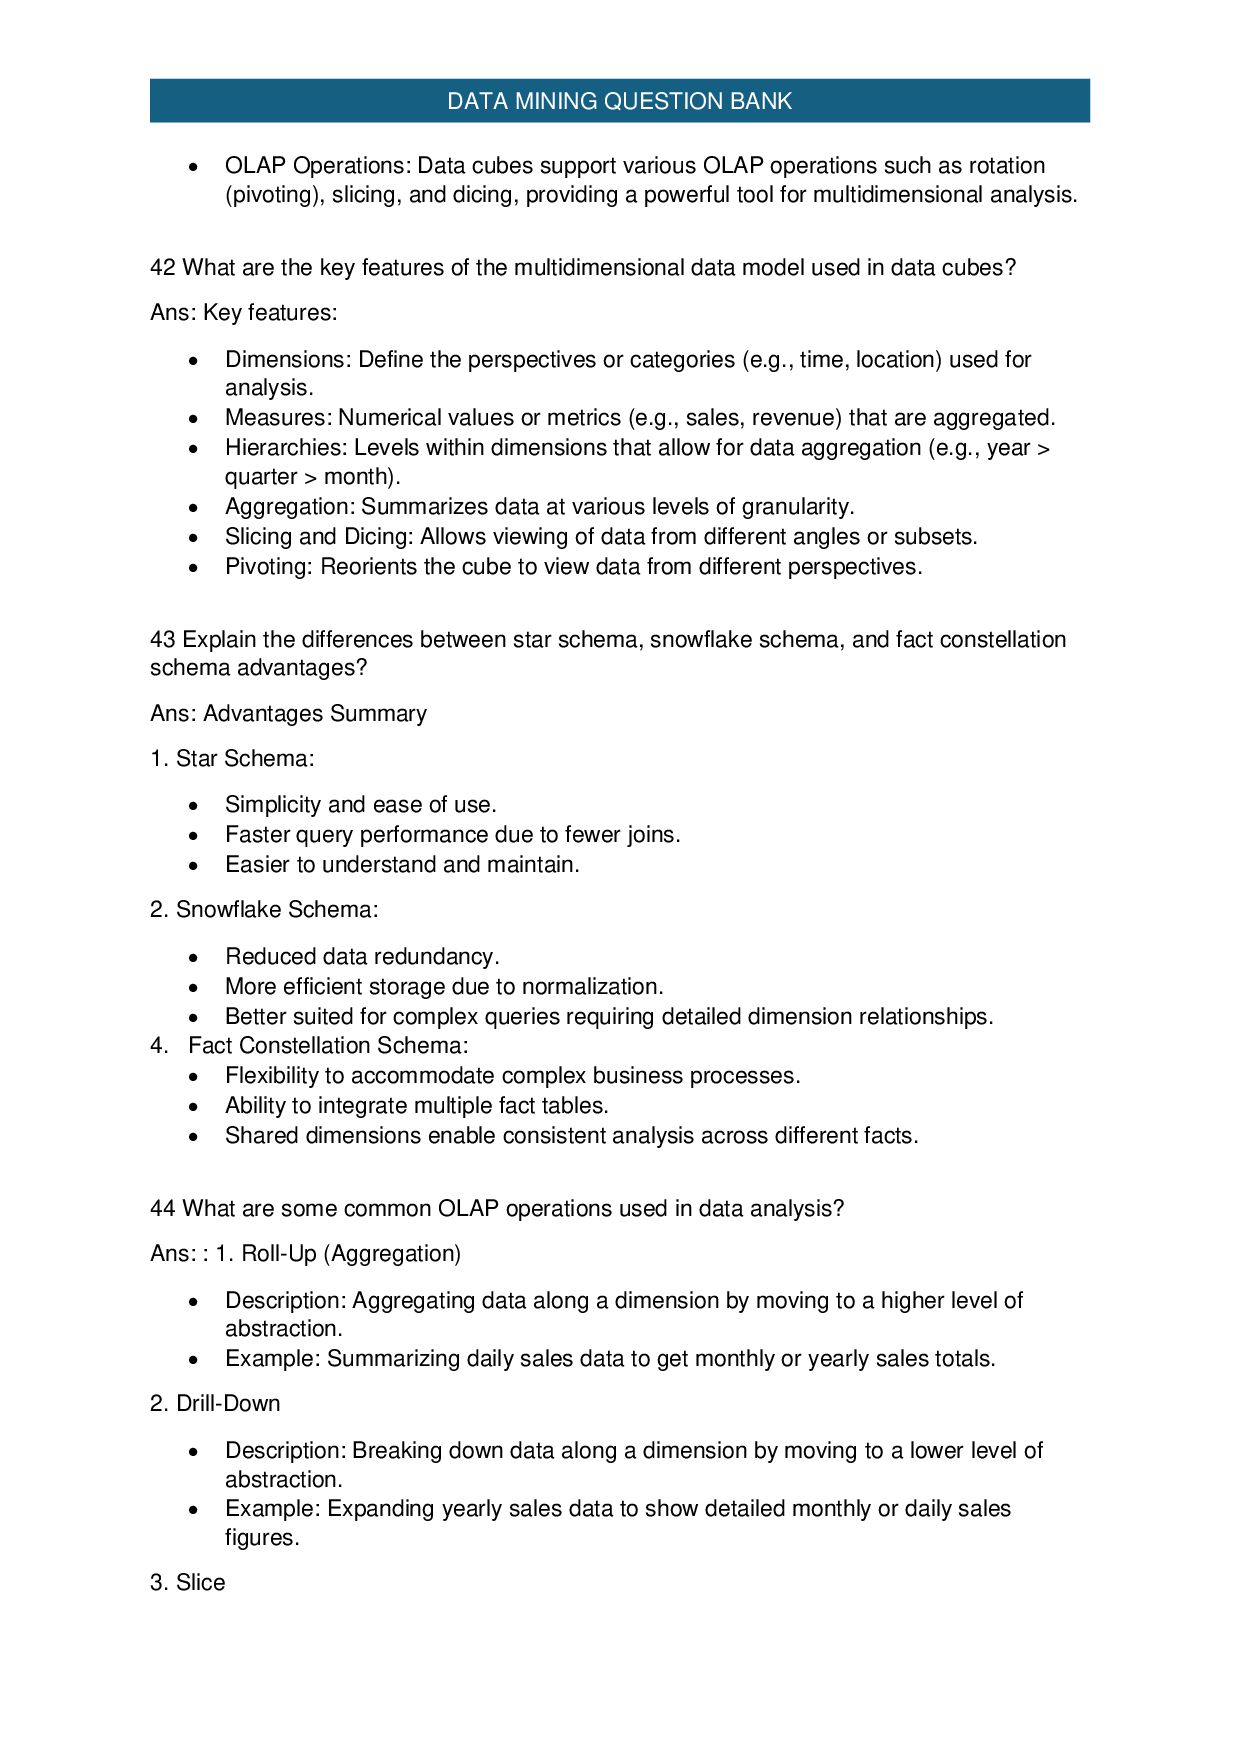
  29. DATA MINING QUESTION BANK  OLAP Operations: Data cubes support

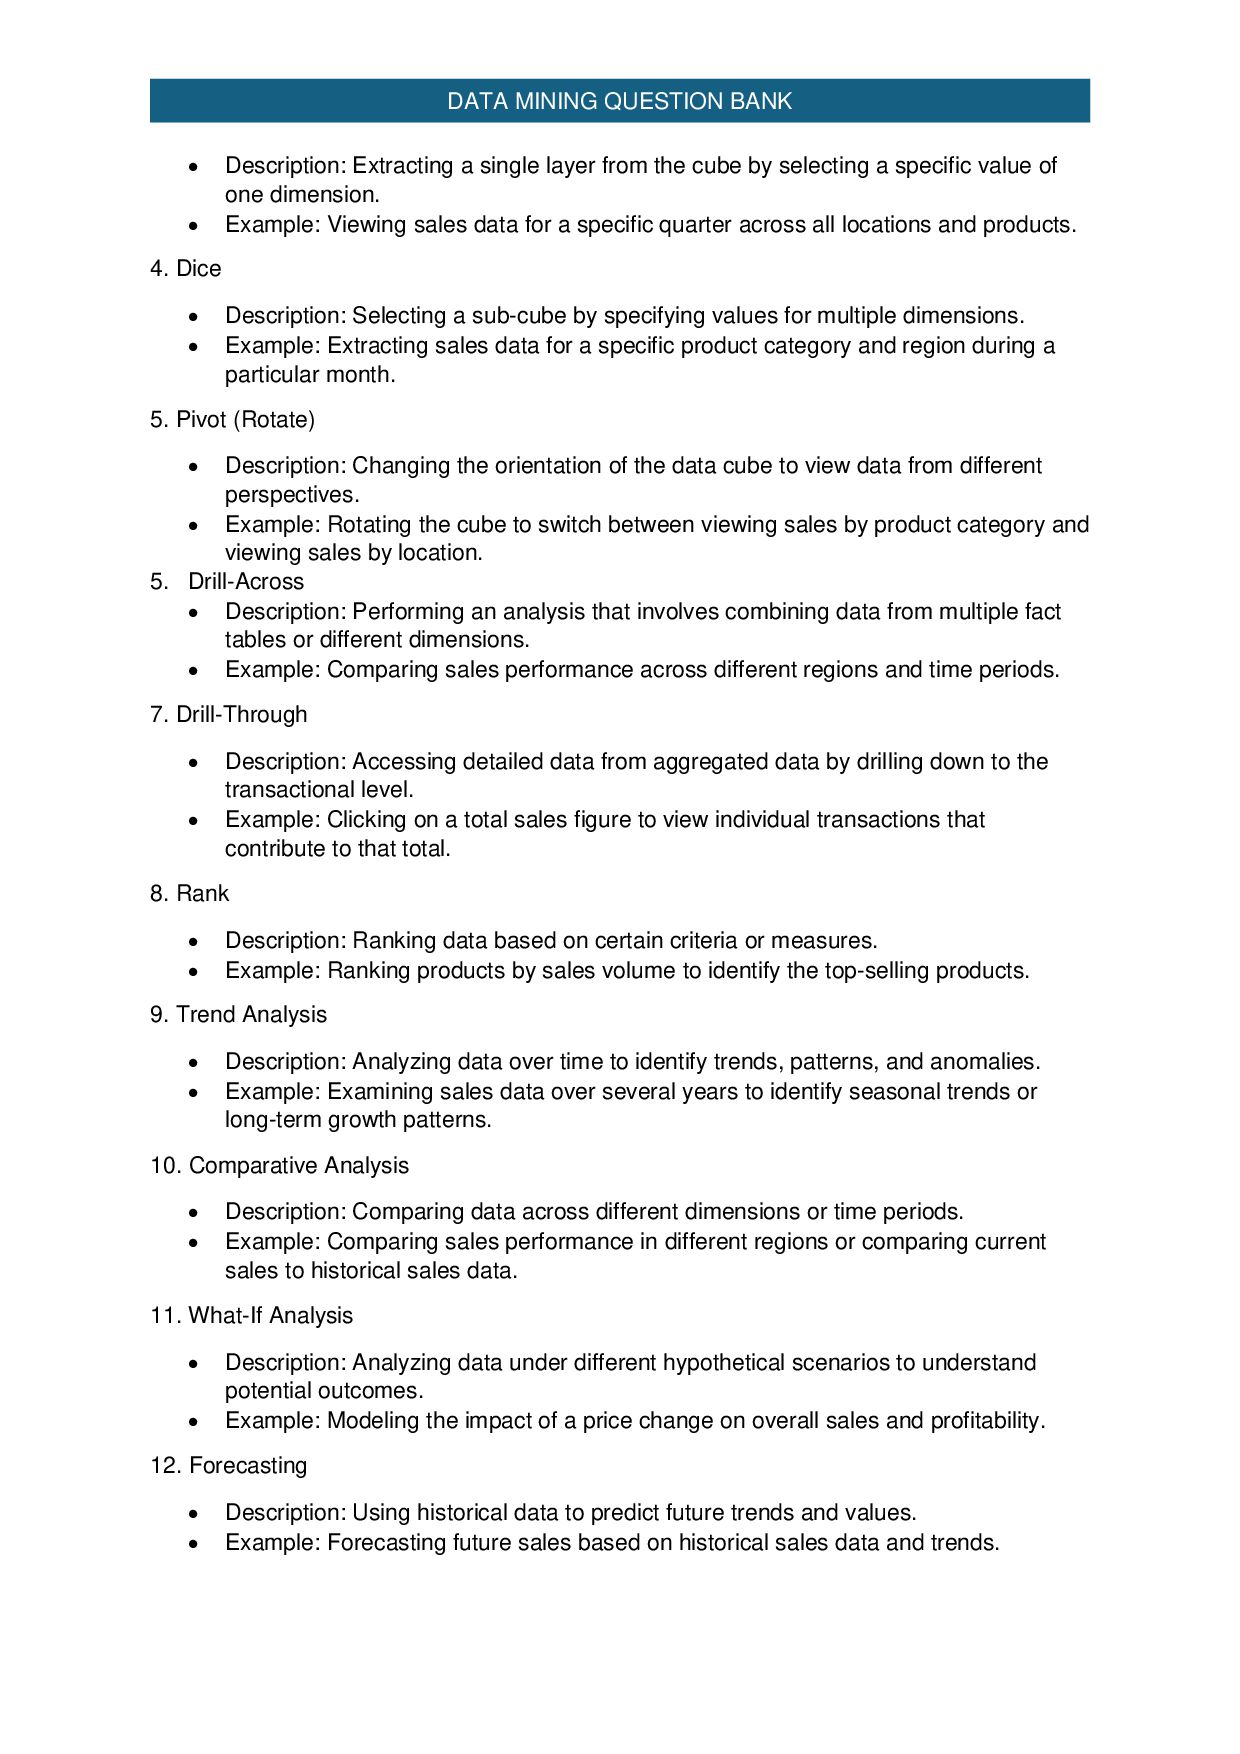
    various OLAP operations such as rotation (pivoting), slicing, and dicing, providing a powerful tool for multidimensional analysis. 42 What are the key features of the multidimensional data model used in data cubes? Ans: Key features:  Dimensions: Define the perspectives or categories (e.g., time, location) used for analysis.  Measures: Numerical values or metrics (e.g., sales, revenue) that are aggregated.  Hierarchies: Levels within dimensions that allow for data aggregation (e.g., year > quarter > month).  Aggregation: Summarizes data at various levels of granularity.  Slicing and Dicing: Allows viewing of data from different angles or subsets.  Pivoting: Reorients the cube to view data from different perspectives. 43 Explain the differences between star schema, snowflake schema, and fact constellation schema advantages? Ans: Advantages Summary 1. Star Schema:  Simplicity and ease of use.  Faster query performance due to fewer joins.  Easier to understand and maintain. 2. Snowflake Schema:  Reduced data redundancy.  More efficient storage due to normalization.  Better suited for complex queries requiring detailed dimension relationships. 4. Fact Constellation Schema:  Flexibility to accommodate complex business processes.  Ability to integrate multiple fact tables.  Shared dimensions enable consistent analysis across different facts. 44 What are some common OLAP operations used in data analysis? Ans: : 1. Roll-Up (Aggregation)  Description: Aggregating data along a dimension by moving to a higher level of abstraction.  Example: Summarizing daily sales data to get monthly or yearly sales totals. 2. Drill-Down  Description: Breaking down data along a dimension by moving to a lower level of abstraction.  Example: Expanding yearly sales data to show detailed monthly or daily sales figures. 3. Slice
  30. DATA MINING QUESTION BANK  Description: Extracting a single layer

    from the cube by selecting a specific value of one dimension.  Example: Viewing sales data for a specific quarter across all locations and products. 4. Dice  Description: Selecting a sub-cube by specifying values for multiple dimensions.  Example: Extracting sales data for a specific product category and region during a particular month. 5. Pivot (Rotate)  Description: Changing the orientation of the data cube to view data from different perspectives.  Example: Rotating the cube to switch between viewing sales by product category and viewing sales by location. 5. Drill-Across  Description: Performing an analysis that involves combining data from multiple fact tables or different dimensions.  Example: Comparing sales performance across different regions and time periods. 7. Drill-Through  Description: Accessing detailed data from aggregated data by drilling down to the transactional level.  Example: Clicking on a total sales figure to view individual transactions that contribute to that total. 8. Rank  Description: Ranking data based on certain criteria or measures.  Example: Ranking products by sales volume to identify the top-selling products. 9. Trend Analysis  Description: Analyzing data over time to identify trends, patterns, and anomalies.  Example: Examining sales data over several years to identify seasonal trends or long-term growth patterns. 10. Comparative Analysis  Description: Comparing data across different dimensions or time periods.  Example: Comparing sales performance in different regions or comparing current sales to historical sales data. 11. What-If Analysis  Description: Analyzing data under different hypothetical scenarios to understand potential outcomes.  Example: Modeling the impact of a price change on overall sales and profitability. 12. Forecasting  Description: Using historical data to predict future trends and values.  Example: Forecasting future sales based on historical sales data and trends.
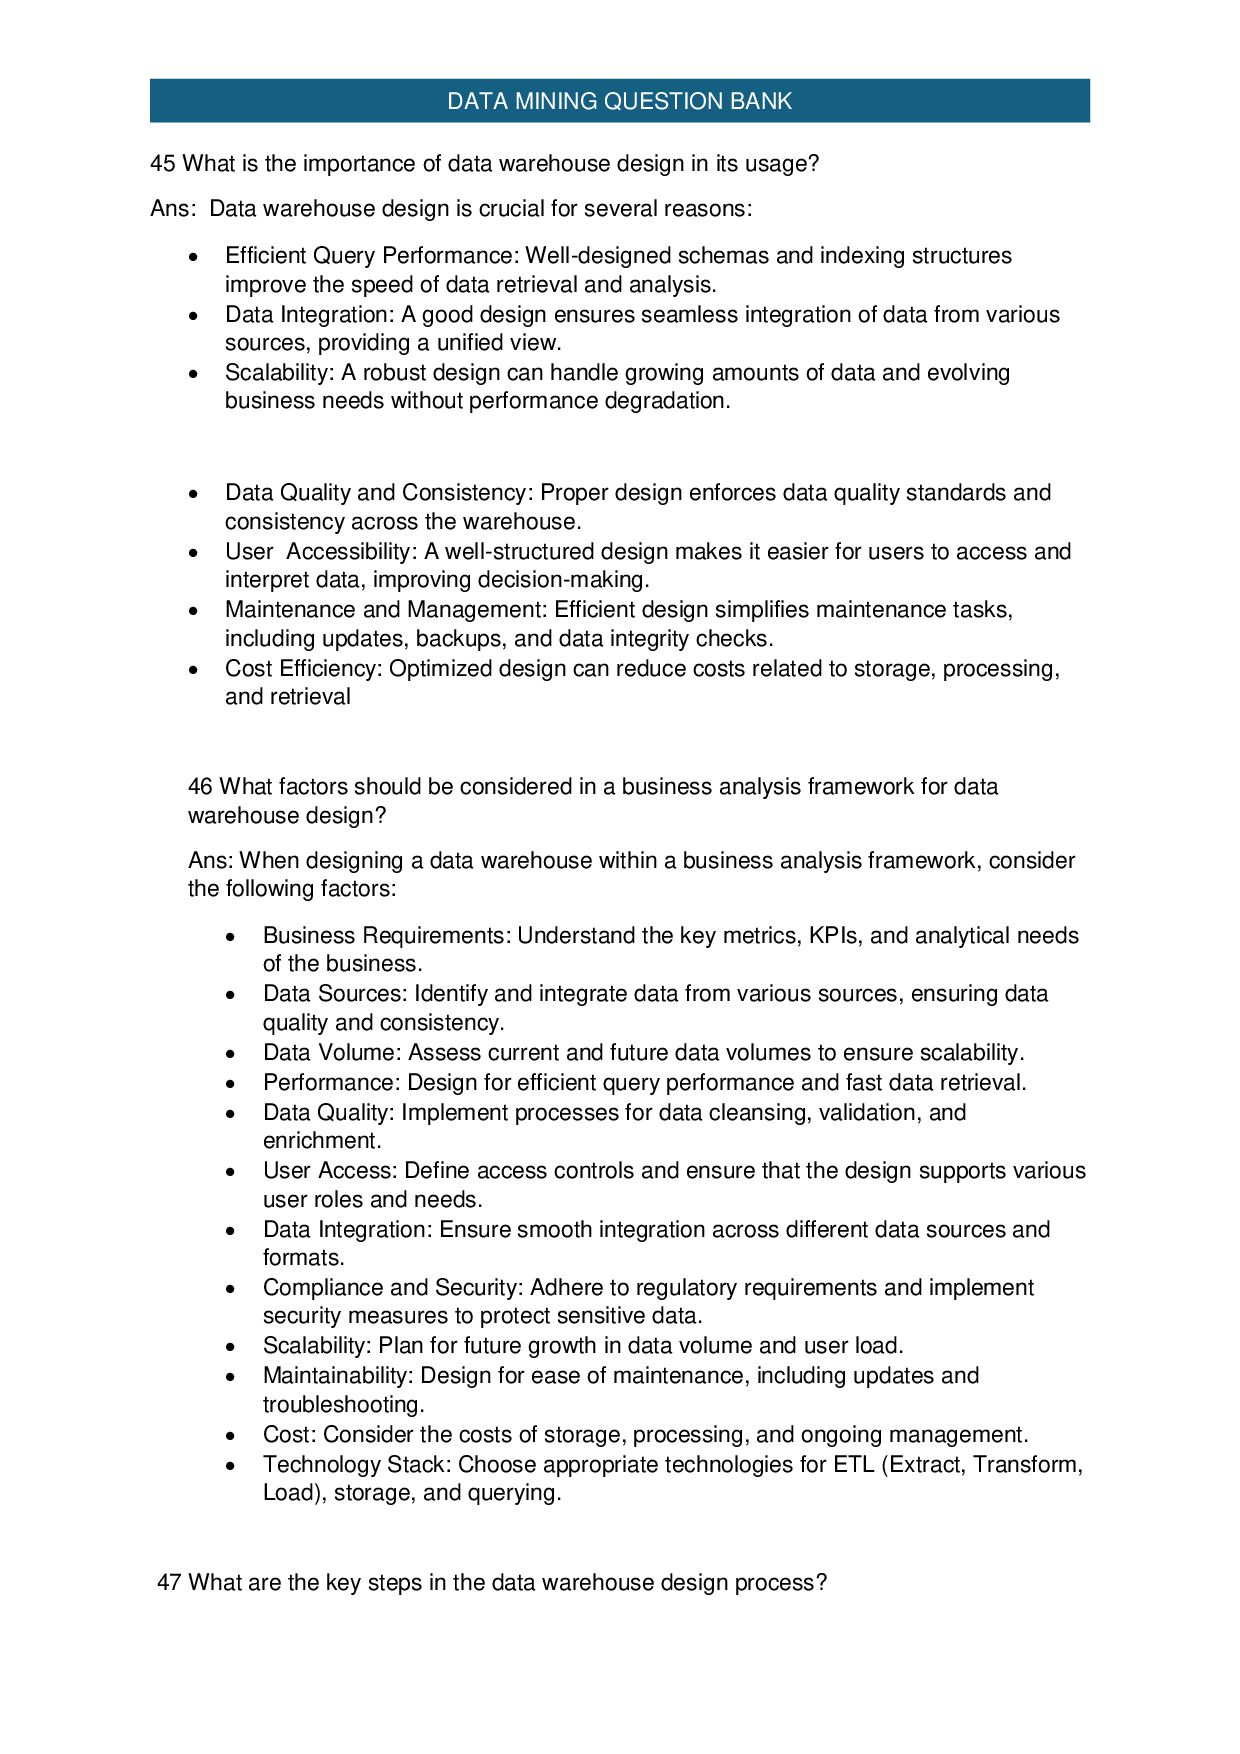
  31. DATA MINING QUESTION BANK 45 What is the importance of

    data warehouse design in its usage? Ans: Data warehouse design is crucial for several reasons:  Efficient Query Performance: Well-designed schemas and indexing structures improve the speed of data retrieval and analysis.  Data Integration: A good design ensures seamless integration of data from various sources, providing a unified view.  Scalability: A robust design can handle growing amounts of data and evolving business needs without performance degradation.  Data Quality and Consistency: Proper design enforces data quality standards and consistency across the warehouse.  User Accessibility: A well-structured design makes it easier for users to access and interpret data, improving decision-making.  Maintenance and Management: Efficient design simplifies maintenance tasks, including updates, backups, and data integrity checks.  Cost Efficiency: Optimized design can reduce costs related to storage, processing, and retrieval 46 What factors should be considered in a business analysis framework for data warehouse design? Ans: When designing a data warehouse within a business analysis framework, consider the following factors:  Business Requirements: Understand the key metrics, KPIs, and analytical needs of the business.  Data Sources: Identify and integrate data from various sources, ensuring data quality and consistency.  Data Volume: Assess current and future data volumes to ensure scalability.  Performance: Design for efficient query performance and fast data retrieval.  Data Quality: Implement processes for data cleansing, validation, and enrichment.  User Access: Define access controls and ensure that the design supports various user roles and needs.  Data Integration: Ensure smooth integration across different data sources and formats.  Compliance and Security: Adhere to regulatory requirements and implement security measures to protect sensitive data.  Scalability: Plan for future growth in data volume and user load.  Maintainability: Design for ease of maintenance, including updates and troubleshooting.  Cost: Consider the costs of storage, processing, and ongoing management.  Technology Stack: Choose appropriate technologies for ETL (Extract, Transform, Load), storage, and querying. 47 What are the key steps in the data warehouse design process?
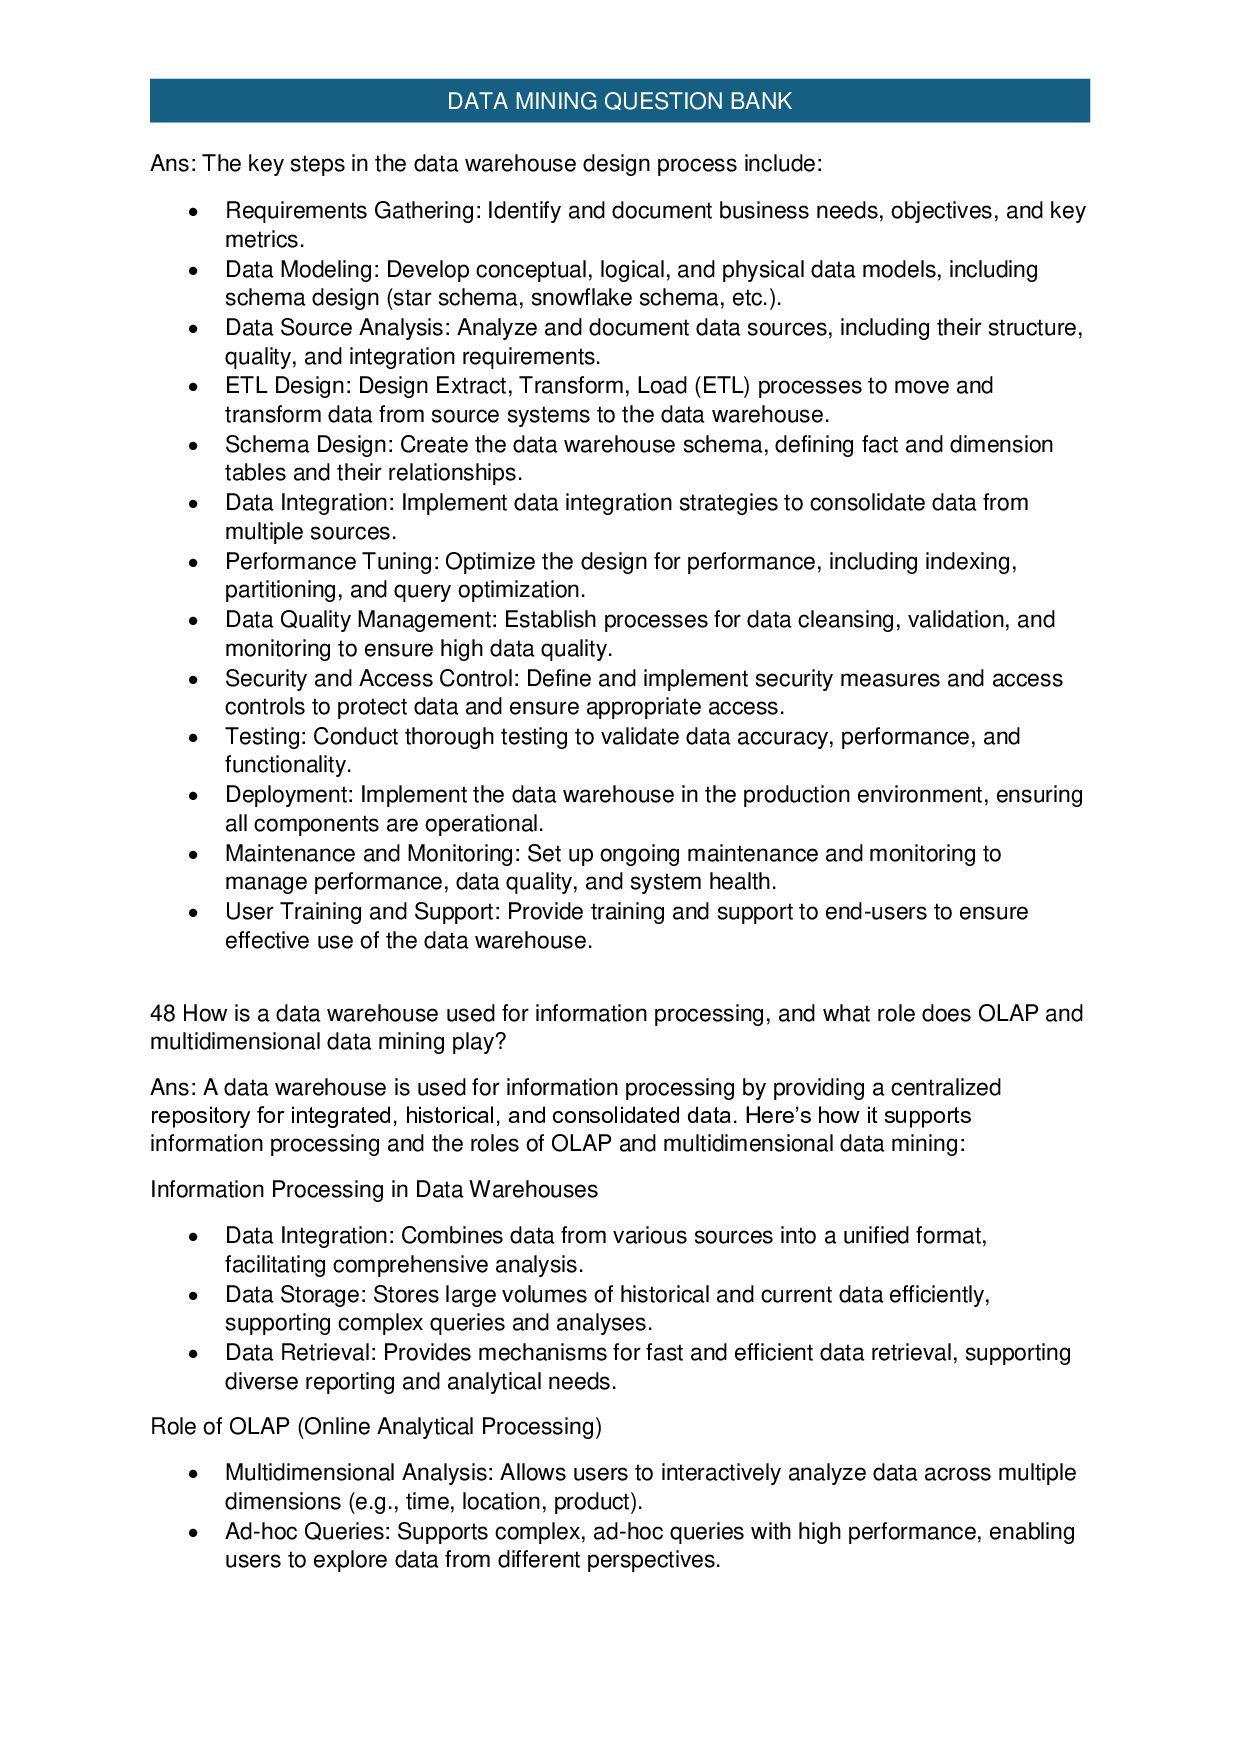
  32. DATA MINING QUESTION BANK Ans: The key steps in the

    data warehouse design process include:  Requirements Gathering: Identify and document business needs, objectives, and key metrics.  Data Modeling: Develop conceptual, logical, and physical data models, including schema design (star schema, snowflake schema, etc.).  Data Source Analysis: Analyze and document data sources, including their structure, quality, and integration requirements.  ETL Design: Design Extract, Transform, Load (ETL) processes to move and transform data from source systems to the data warehouse.  Schema Design: Create the data warehouse schema, defining fact and dimension tables and their relationships.  Data Integration: Implement data integration strategies to consolidate data from multiple sources.  Performance Tuning: Optimize the design for performance, including indexing, partitioning, and query optimization.  Data Quality Management: Establish processes for data cleansing, validation, and monitoring to ensure high data quality.  Security and Access Control: Define and implement security measures and access controls to protect data and ensure appropriate access.  Testing: Conduct thorough testing to validate data accuracy, performance, and functionality.  Deployment: Implement the data warehouse in the production environment, ensuring all components are operational.  Maintenance and Monitoring: Set up ongoing maintenance and monitoring to manage performance, data quality, and system health.  User Training and Support: Provide training and support to end-users to ensure effective use of the data warehouse. 48 How is a data warehouse used for information processing, and what role does OLAP and multidimensional data mining play? Ans: A data warehouse is used for information processing by providing a centralized repository for integrated, historical, and consolidated data. Here’s how it supports information processing and the roles of OLAP and multidimensional data mining: Information Processing in Data Warehouses  Data Integration: Combines data from various sources into a unified format, facilitating comprehensive analysis.  Data Storage: Stores large volumes of historical and current data efficiently, supporting complex queries and analyses.  Data Retrieval: Provides mechanisms for fast and efficient data retrieval, supporting diverse reporting and analytical needs. Role of OLAP (Online Analytical Processing)  Multidimensional Analysis: Allows users to interactively analyze data across multiple dimensions (e.g., time, location, product).  Ad-hoc Queries: Supports complex, ad-hoc queries with high performance, enabling users to explore data from different perspectives.
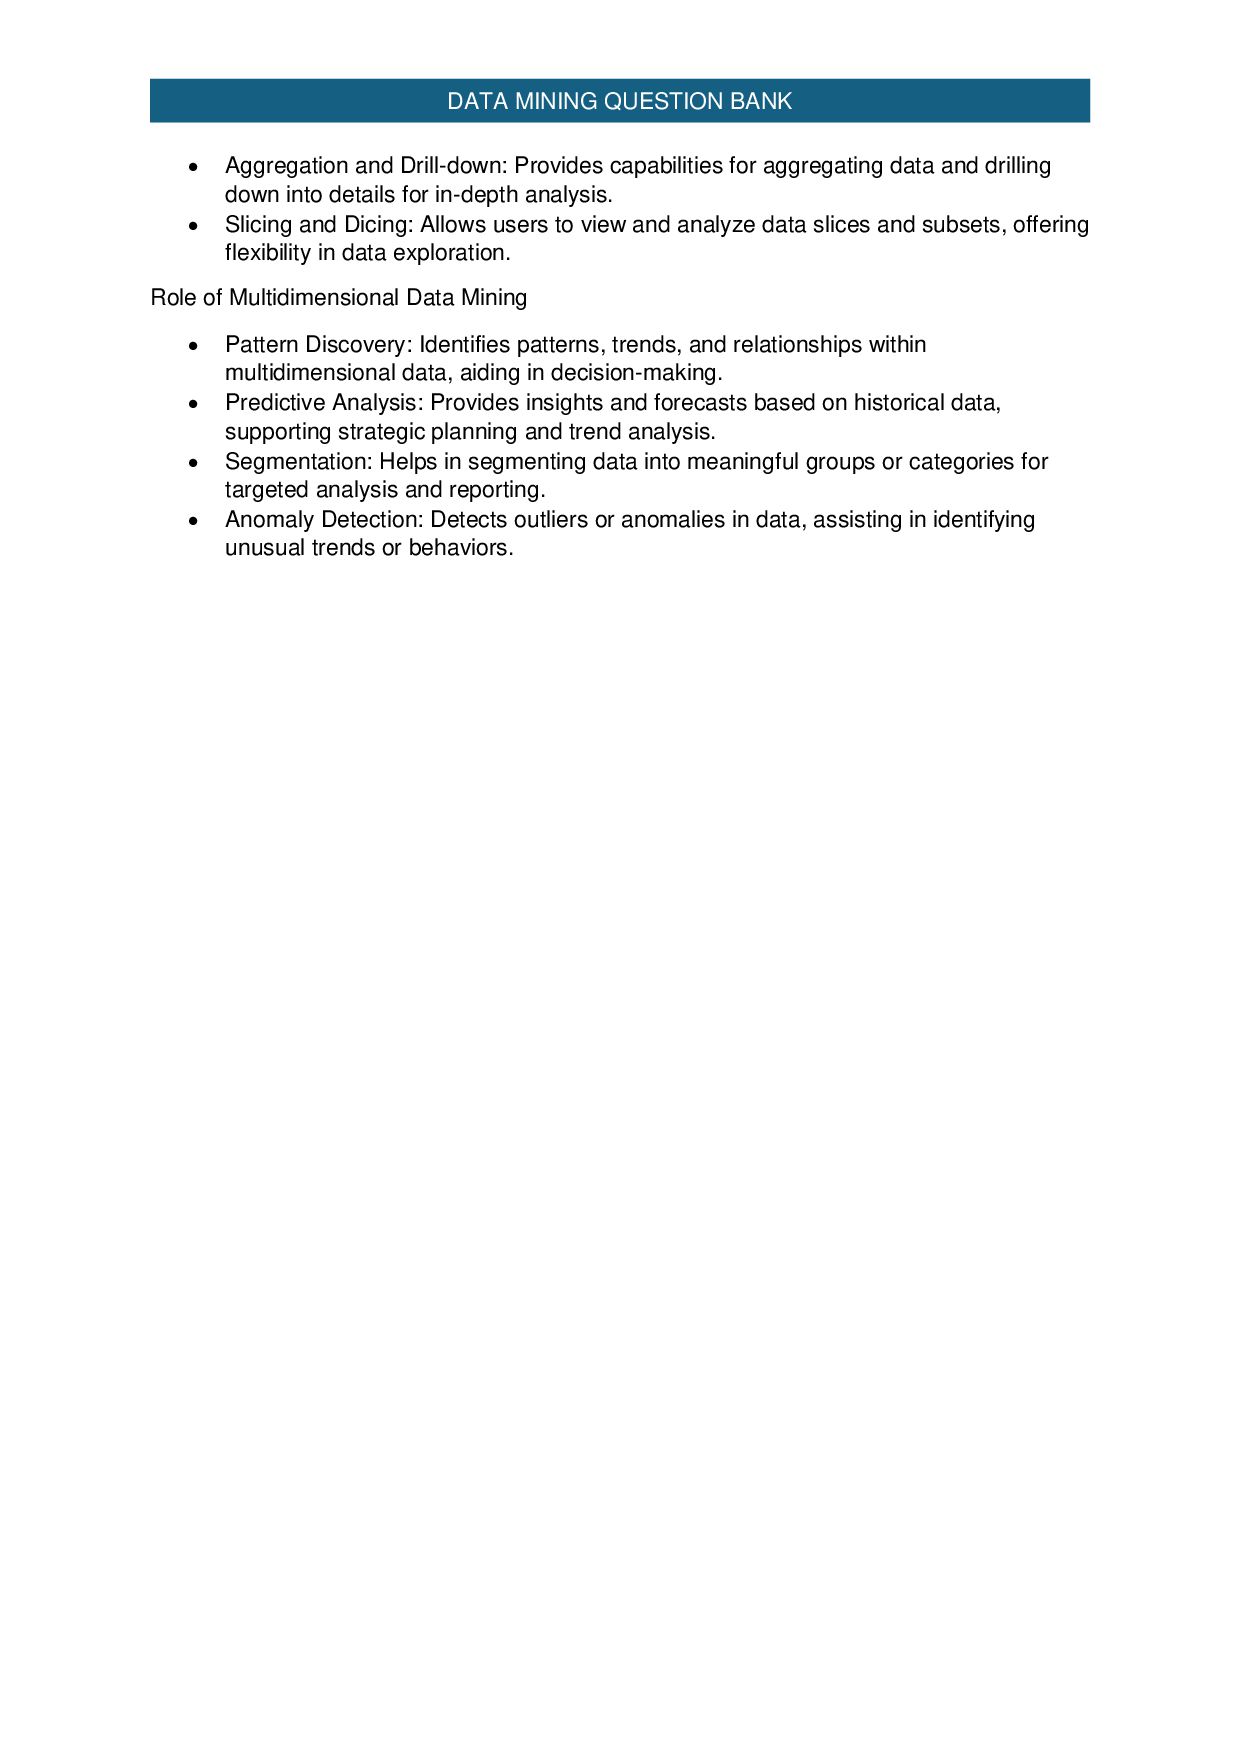
  33. DATA MINING QUESTION BANK  Aggregation and Drill-down: Provides capabilities

    for aggregating data and drilling down into details for in-depth analysis.  Slicing and Dicing: Allows users to view and analyze data slices and subsets, offering flexibility in data exploration. Role of Multidimensional Data Mining  Pattern Discovery: Identifies patterns, trends, and relationships within multidimensional data, aiding in decision-making.  Predictive Analysis: Provides insights and forecasts based on historical data, supporting strategic planning and trend analysis.  Segmentation: Helps in segmenting data into meaningful groups or categories for targeted analysis and reporting.  Anomaly Detection: Detects outliers or anomalies in data, assisting in identifying unusual trends or behaviors.
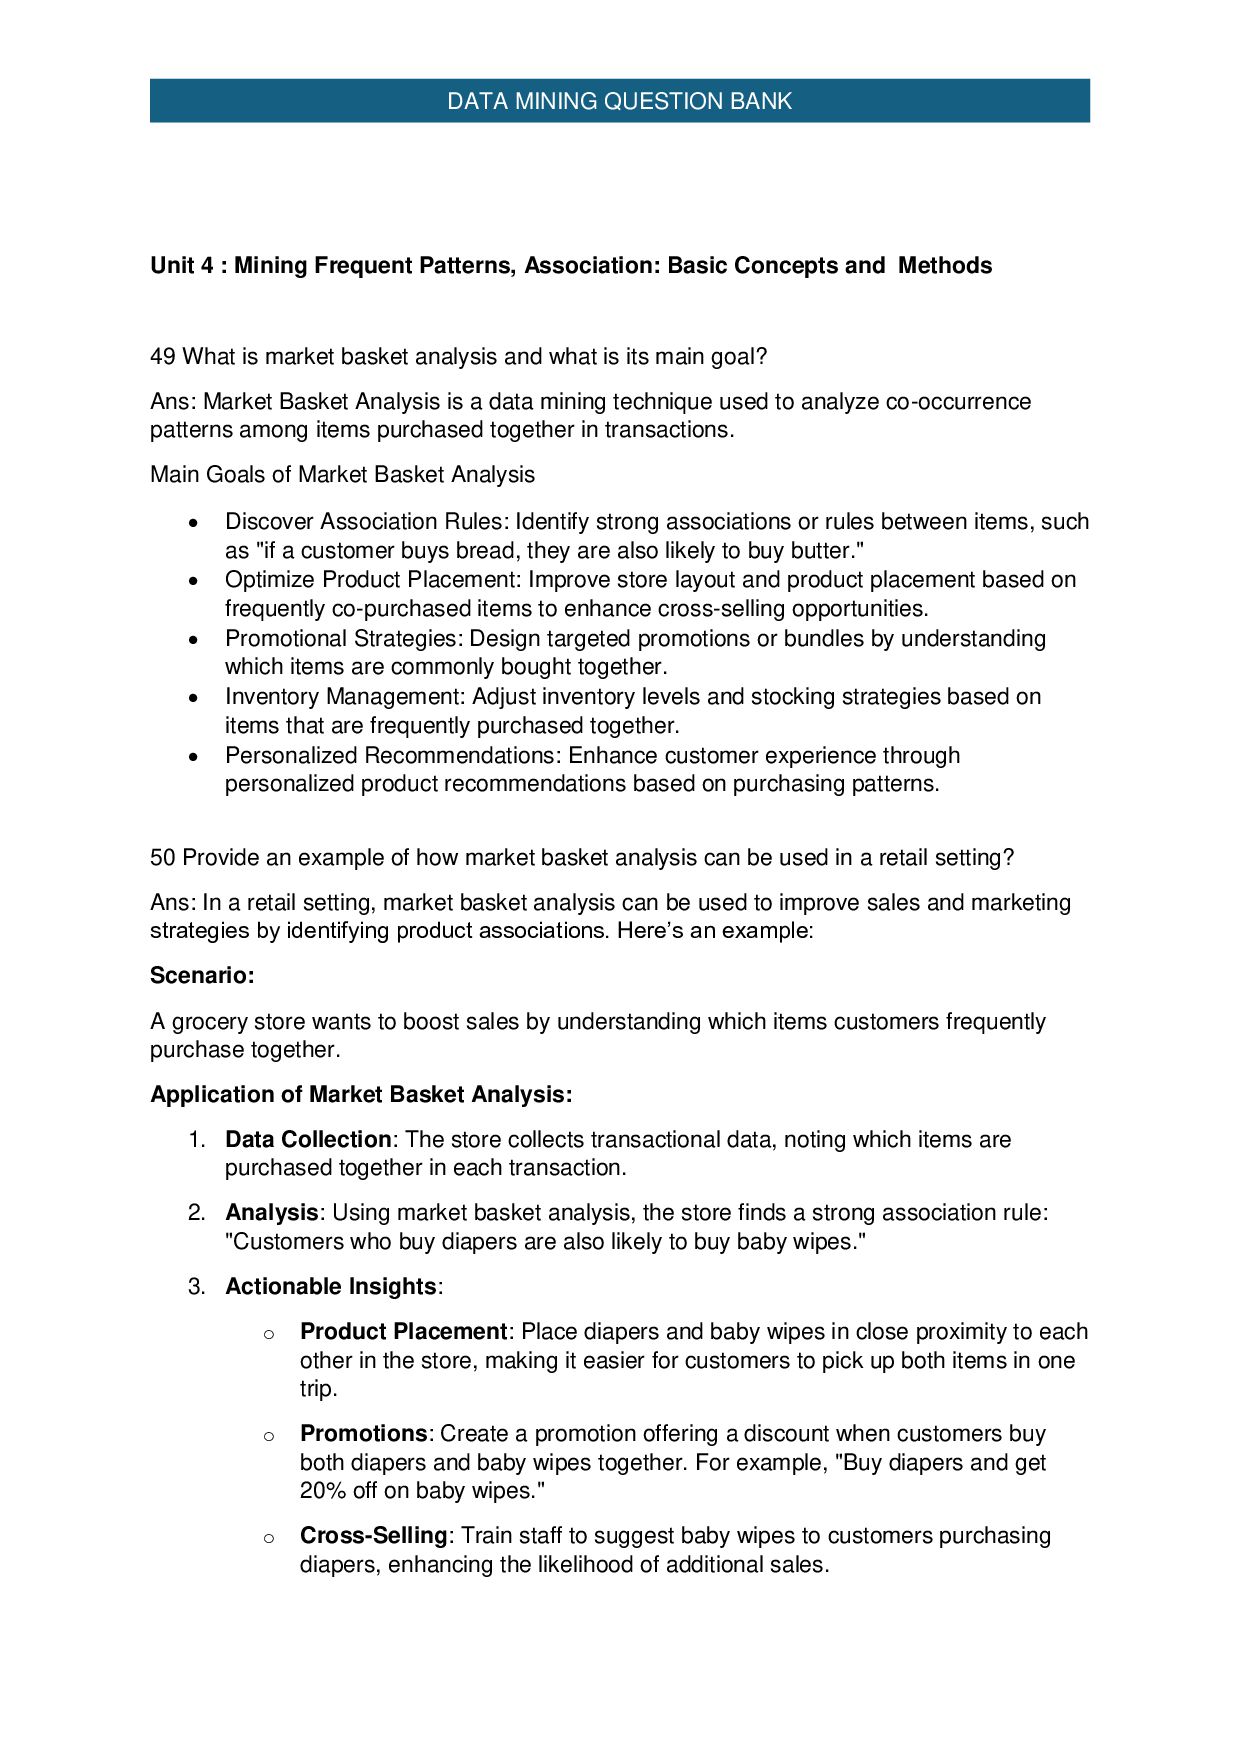
  34. DATA MINING QUESTION BANK Unit 4 : Mining Frequent Patterns,

    Association: Basic Concepts and Methods 49 What is market basket analysis and what is its main goal? Ans: Market Basket Analysis is a data mining technique used to analyze co-occurrence patterns among items purchased together in transactions. Main Goals of Market Basket Analysis  Discover Association Rules: Identify strong associations or rules between items, such as "if a customer buys bread, they are also likely to buy butter."  Optimize Product Placement: Improve store layout and product placement based on frequently co-purchased items to enhance cross-selling opportunities.  Promotional Strategies: Design targeted promotions or bundles by understanding which items are commonly bought together.  Inventory Management: Adjust inventory levels and stocking strategies based on items that are frequently purchased together.  Personalized Recommendations: Enhance customer experience through personalized product recommendations based on purchasing patterns. 50 Provide an example of how market basket analysis can be used in a retail setting? Ans: In a retail setting, market basket analysis can be used to improve sales and marketing strategies by identifying product associations. Here’s an example: Scenario: A grocery store wants to boost sales by understanding which items customers frequently purchase together. Application of Market Basket Analysis: 1. Data Collection: The store collects transactional data, noting which items are purchased together in each transaction. 2. Analysis: Using market basket analysis, the store finds a strong association rule: "Customers who buy diapers are also likely to buy baby wipes." 3. Actionable Insights: o Product Placement: Place diapers and baby wipes in close proximity to each other in the store, making it easier for customers to pick up both items in one trip. o Promotions: Create a promotion offering a discount when customers buy both diapers and baby wipes together. For example, "Buy diapers and get 20% off on baby wipes." o Cross-Selling: Train staff to suggest baby wipes to customers purchasing diapers, enhancing the likelihood of additional sales.
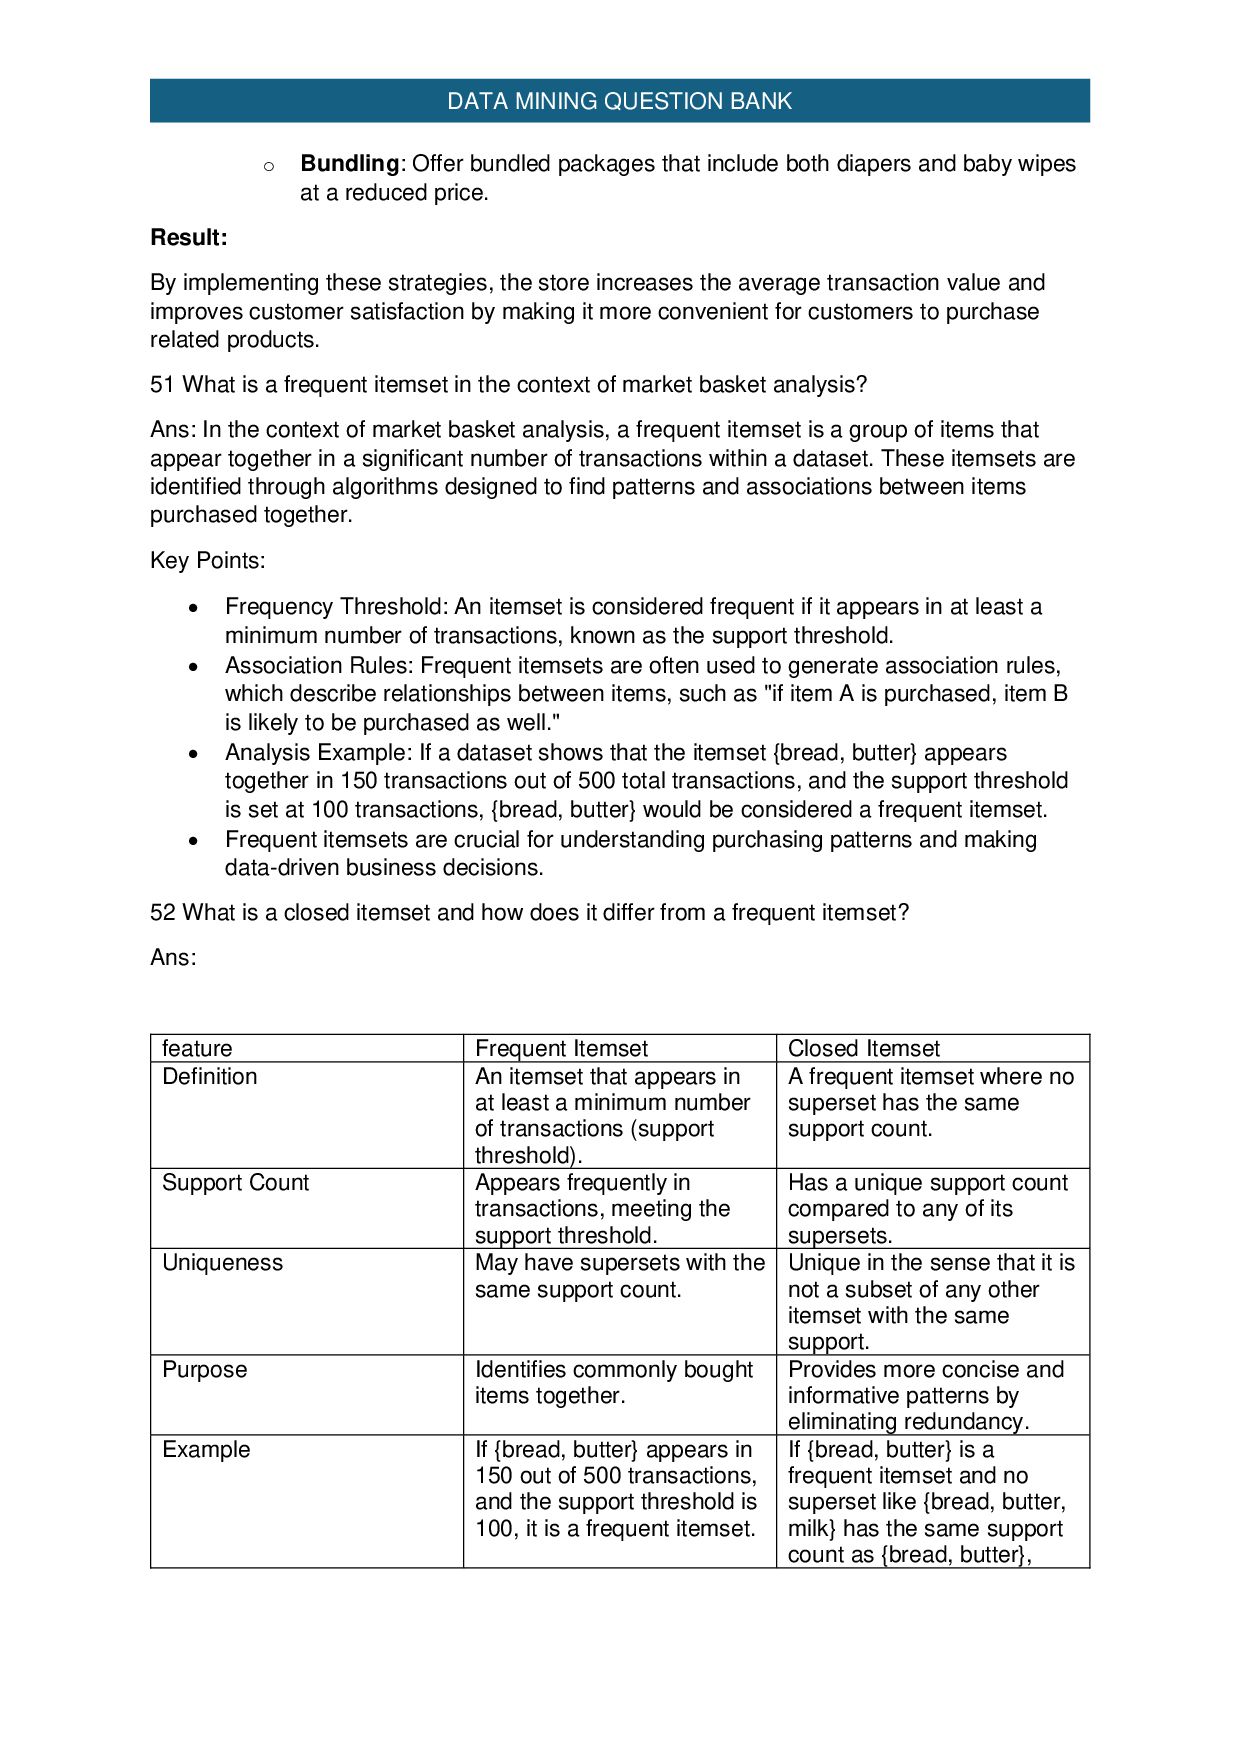
  35. DATA MINING QUESTION BANK o Bundling: Offer bundled packages that

    include both diapers and baby wipes at a reduced price. Result: By implementing these strategies, the store increases the average transaction value and improves customer satisfaction by making it more convenient for customers to purchase related products. 51 What is a frequent itemset in the context of market basket analysis? Ans: In the context of market basket analysis, a frequent itemset is a group of items that appear together in a significant number of transactions within a dataset. These itemsets are identified through algorithms designed to find patterns and associations between items purchased together. Key Points:  Frequency Threshold: An itemset is considered frequent if it appears in at least a minimum number of transactions, known as the support threshold.  Association Rules: Frequent itemsets are often used to generate association rules, which describe relationships between items, such as "if item A is purchased, item B is likely to be purchased as well."  Analysis Example: If a dataset shows that the itemset {bread, butter} appears together in 150 transactions out of 500 total transactions, and the support threshold is set at 100 transactions, {bread, butter} would be considered a frequent itemset.  Frequent itemsets are crucial for understanding purchasing patterns and making data-driven business decisions. 52 What is a closed itemset and how does it differ from a frequent itemset? Ans: feature Frequent Itemset Closed Itemset Definition An itemset that appears in at least a minimum number of transactions (support threshold). A frequent itemset where no superset has the same support count. Support Count Appears frequently in transactions, meeting the support threshold. Has a unique support count compared to any of its supersets. Uniqueness May have supersets with the same support count. Unique in the sense that it is not a subset of any other itemset with the same support. Purpose Identifies commonly bought items together. Provides more concise and informative patterns by eliminating redundancy. Example If {bread, butter} appears in 150 out of 500 transactions, and the support threshold is 100, it is a frequent itemset. If {bread, butter} is a frequent itemset and no superset like {bread, butter, milk} has the same support count as {bread, butter},
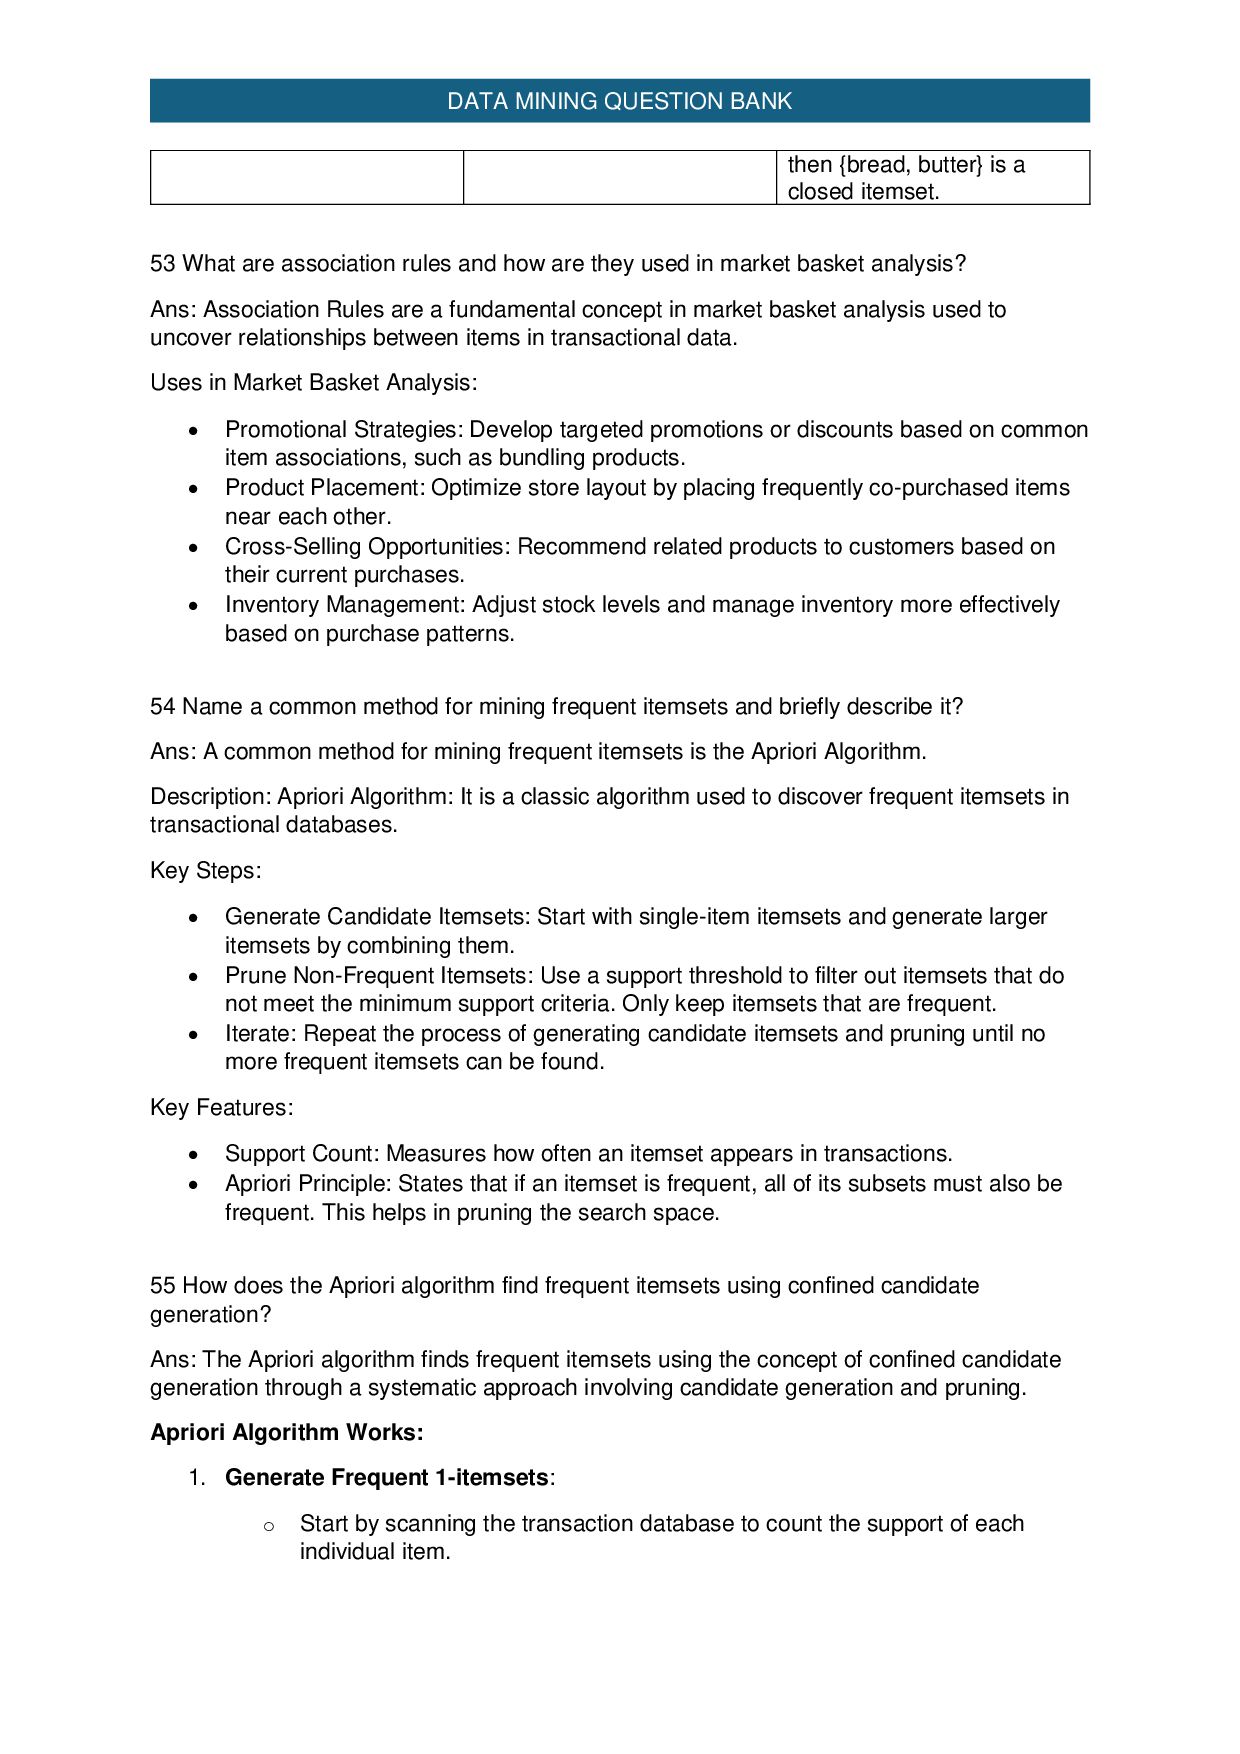
  36. DATA MINING QUESTION BANK then {bread, butter} is a closed

    itemset. 53 What are association rules and how are they used in market basket analysis? Ans: Association Rules are a fundamental concept in market basket analysis used to uncover relationships between items in transactional data. Uses in Market Basket Analysis:  Promotional Strategies: Develop targeted promotions or discounts based on common item associations, such as bundling products.  Product Placement: Optimize store layout by placing frequently co-purchased items near each other.  Cross-Selling Opportunities: Recommend related products to customers based on their current purchases.  Inventory Management: Adjust stock levels and manage inventory more effectively based on purchase patterns. 54 Name a common method for mining frequent itemsets and briefly describe it? Ans: A common method for mining frequent itemsets is the Apriori Algorithm. Description: Apriori Algorithm: It is a classic algorithm used to discover frequent itemsets in transactional databases. Key Steps:  Generate Candidate Itemsets: Start with single-item itemsets and generate larger itemsets by combining them.  Prune Non-Frequent Itemsets: Use a support threshold to filter out itemsets that do not meet the minimum support criteria. Only keep itemsets that are frequent.  Iterate: Repeat the process of generating candidate itemsets and pruning until no more frequent itemsets can be found. Key Features:  Support Count: Measures how often an itemset appears in transactions.  Apriori Principle: States that if an itemset is frequent, all of its subsets must also be frequent. This helps in pruning the search space. 55 How does the Apriori algorithm find frequent itemsets using confined candidate generation? Ans: The Apriori algorithm finds frequent itemsets using the concept of confined candidate generation through a systematic approach involving candidate generation and pruning. Apriori Algorithm Works: 1. Generate Frequent 1-itemsets: o Start by scanning the transaction database to count the support of each individual item.
  37. DATA MINING QUESTION BANK o Items that meet the minimum

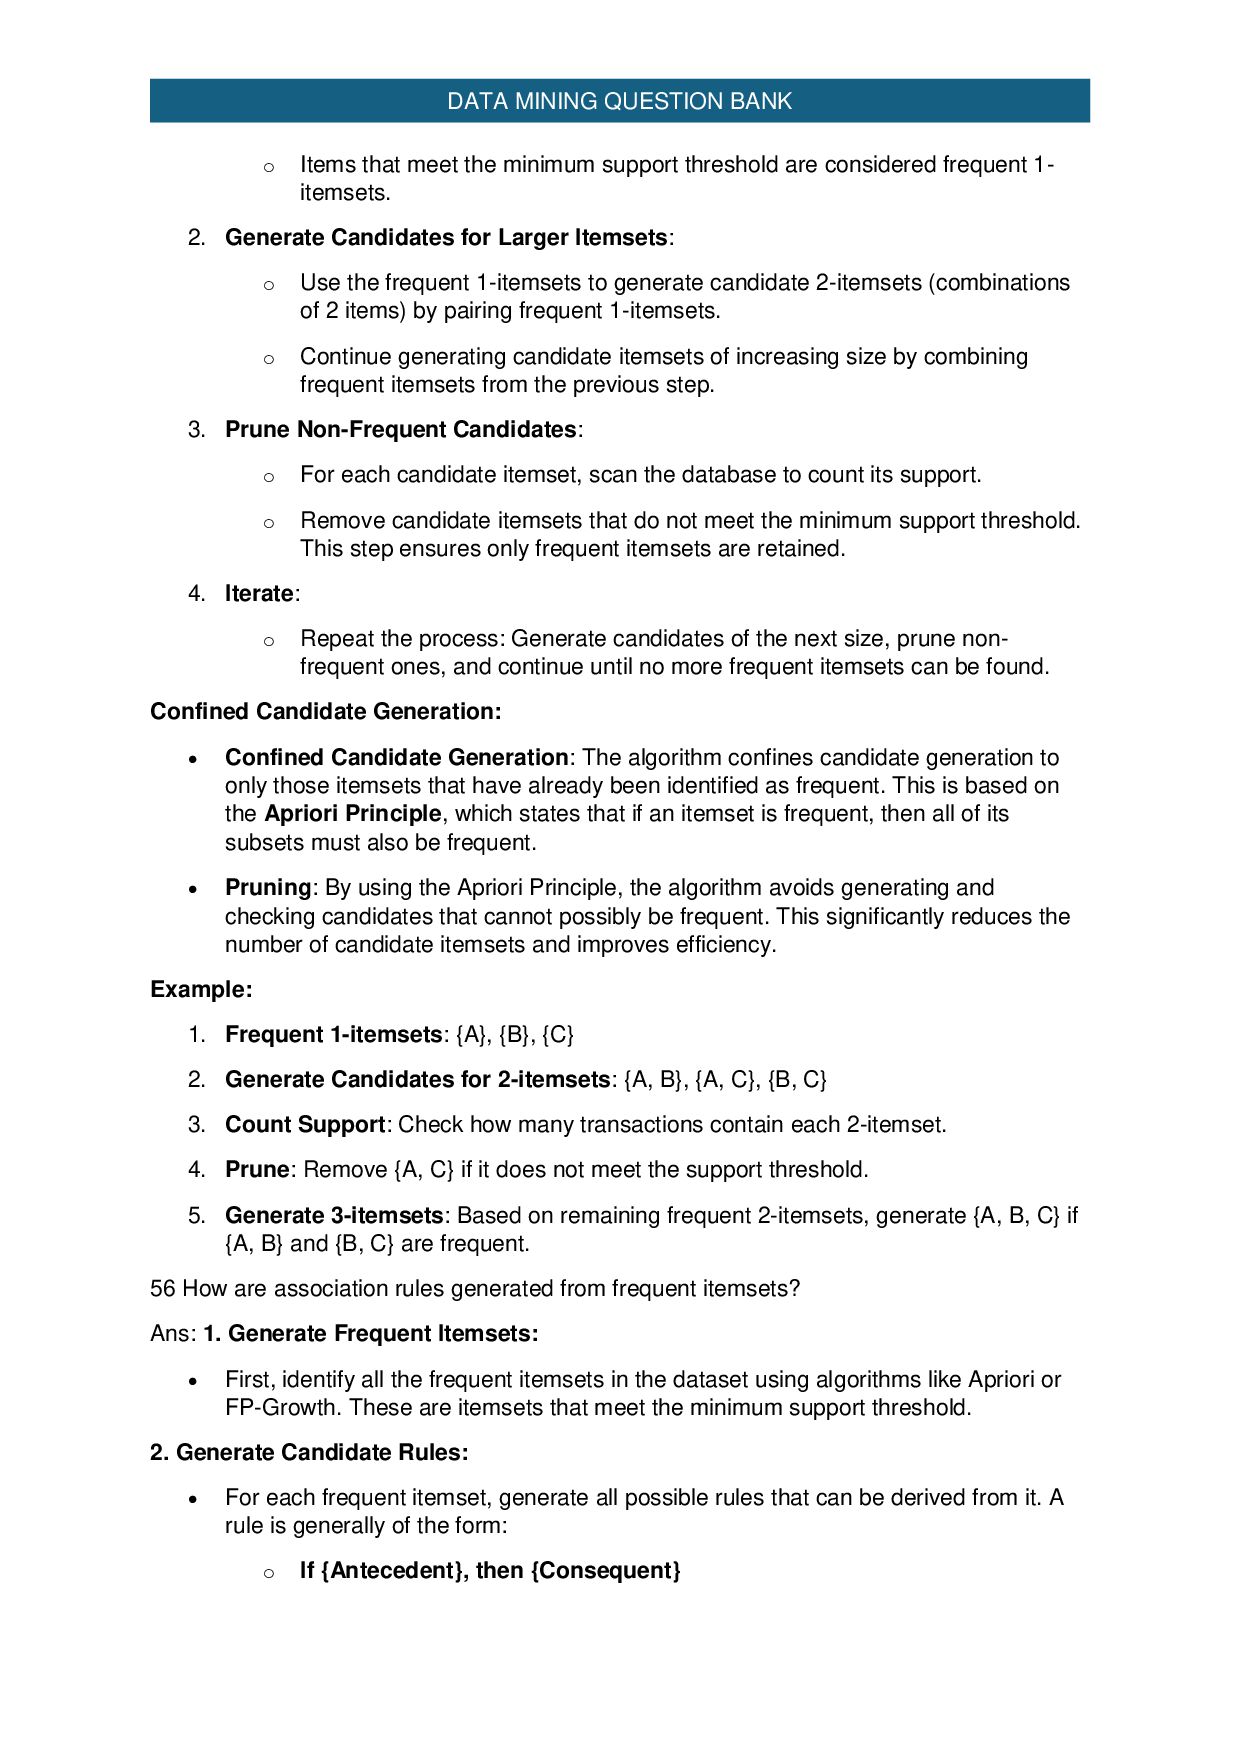
    support threshold are considered frequent 1- itemsets. 2. Generate Candidates for Larger Itemsets: o Use the frequent 1-itemsets to generate candidate 2-itemsets (combinations of 2 items) by pairing frequent 1-itemsets. o Continue generating candidate itemsets of increasing size by combining frequent itemsets from the previous step. 3. Prune Non-Frequent Candidates: o For each candidate itemset, scan the database to count its support. o Remove candidate itemsets that do not meet the minimum support threshold. This step ensures only frequent itemsets are retained. 4. Iterate: o Repeat the process: Generate candidates of the next size, prune non- frequent ones, and continue until no more frequent itemsets can be found. Confined Candidate Generation:  Confined Candidate Generation: The algorithm confines candidate generation to only those itemsets that have already been identified as frequent. This is based on the Apriori Principle, which states that if an itemset is frequent, then all of its subsets must also be frequent.  Pruning: By using the Apriori Principle, the algorithm avoids generating and checking candidates that cannot possibly be frequent. This significantly reduces the number of candidate itemsets and improves efficiency. Example: 1. Frequent 1-itemsets: {A}, {B}, {C} 2. Generate Candidates for 2-itemsets: {A, B}, {A, C}, {B, C} 3. Count Support: Check how many transactions contain each 2-itemset. 4. Prune: Remove {A, C} if it does not meet the support threshold. 5. Generate 3-itemsets: Based on remaining frequent 2-itemsets, generate {A, B, C} if {A, B} and {B, C} are frequent. 56 How are association rules generated from frequent itemsets? Ans: 1. Generate Frequent Itemsets:  First, identify all the frequent itemsets in the dataset using algorithms like Apriori or FP-Growth. These are itemsets that meet the minimum support threshold. 2. Generate Candidate Rules:  For each frequent itemset, generate all possible rules that can be derived from it. A rule is generally of the form: o If {Antecedent}, then {Consequent}
  38. DATA MINING QUESTION BANK  For a frequent itemset {A,

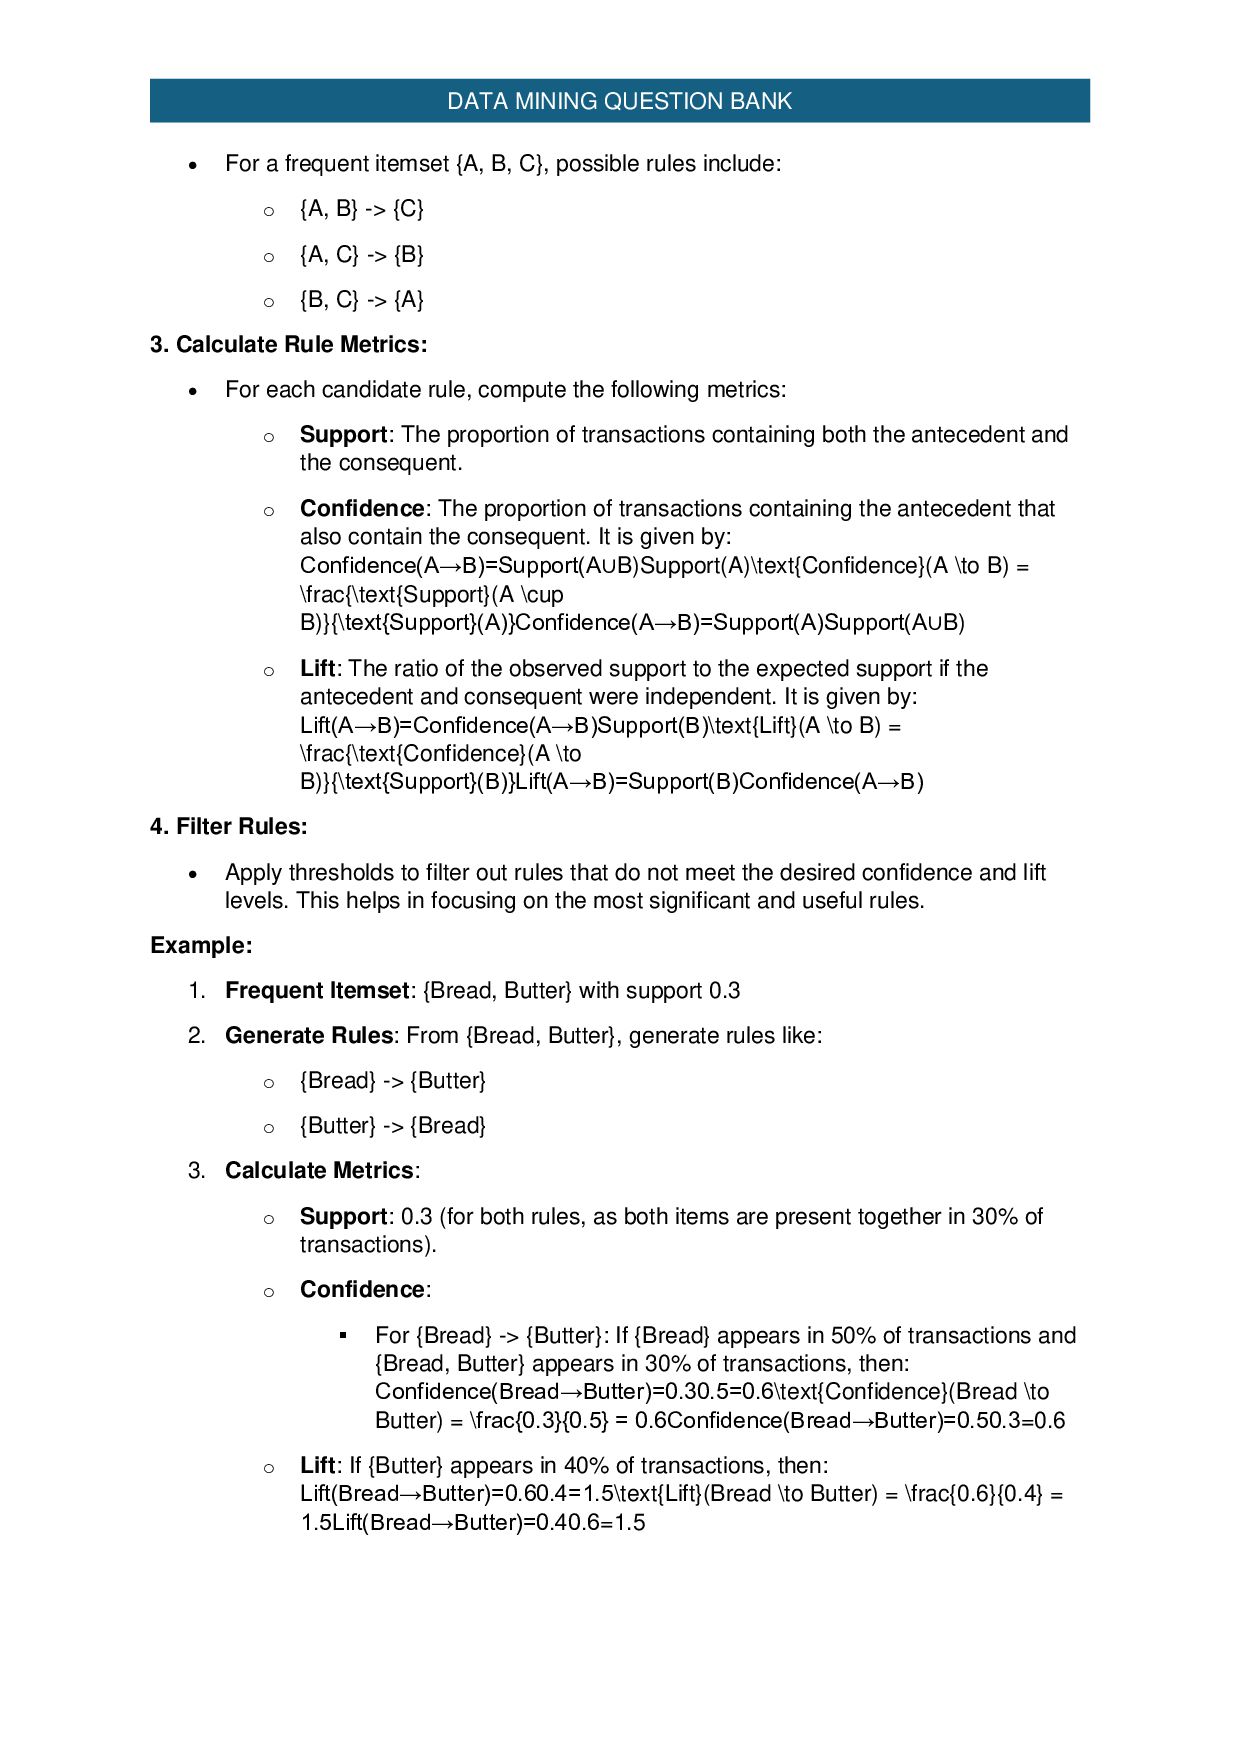
    B, C}, possible rules include: o {A, B} -> {C} o {A, C} -> {B} o {B, C} -> {A} 3. Calculate Rule Metrics:  For each candidate rule, compute the following metrics: o Support: The proportion of transactions containing both the antecedent and the consequent. o Confidence: The proportion of transactions containing the antecedent that also contain the consequent. It is given by: Confidence(A→B)=Support(A∪B)Support(A)\text{Confidence}(A \to B) = \frac{\text{Support}(A \cup B)}{\text{Support}(A)}Confidence(A→B)=Support(A)Support(A∪B) o Lift: The ratio of the observed support to the expected support if the antecedent and consequent were independent. It is given by: Lift(A→B)=Confidence(A→B)Support(B)\text{Lift}(A \to B) = \frac{\text{Confidence}(A \to B)}{\text{Support}(B)}Lift(A→B)=Support(B)Confidence(A→B) 4. Filter Rules:  Apply thresholds to filter out rules that do not meet the desired confidence and lift levels. This helps in focusing on the most significant and useful rules. Example: 1. Frequent Itemset: {Bread, Butter} with support 0.3 2. Generate Rules: From {Bread, Butter}, generate rules like: o {Bread} -> {Butter} o {Butter} -> {Bread} 3. Calculate Metrics: o Support: 0.3 (for both rules, as both items are present together in 30% of transactions). o Confidence:  For {Bread} -> {Butter}: If {Bread} appears in 50% of transactions and {Bread, Butter} appears in 30% of transactions, then: Confidence(Bread→Butter)=0.30.5=0.6\text{Confidence}(Bread \to Butter) = \frac{0.3}{0.5} = 0.6Confidence(Bread→Butter)=0.50.3=0.6 o Lift: If {Butter} appears in 40% of transactions, then: Lift(Bread→Butter)=0.60.4=1.5\text{Lift}(Bread \to Butter) = \frac{0.6}{0.4} = 1.5Lift(Bread→Butter)=0.40.6=1.5
  39. DATA MINING QUESTION BANK 57 What methods are used to

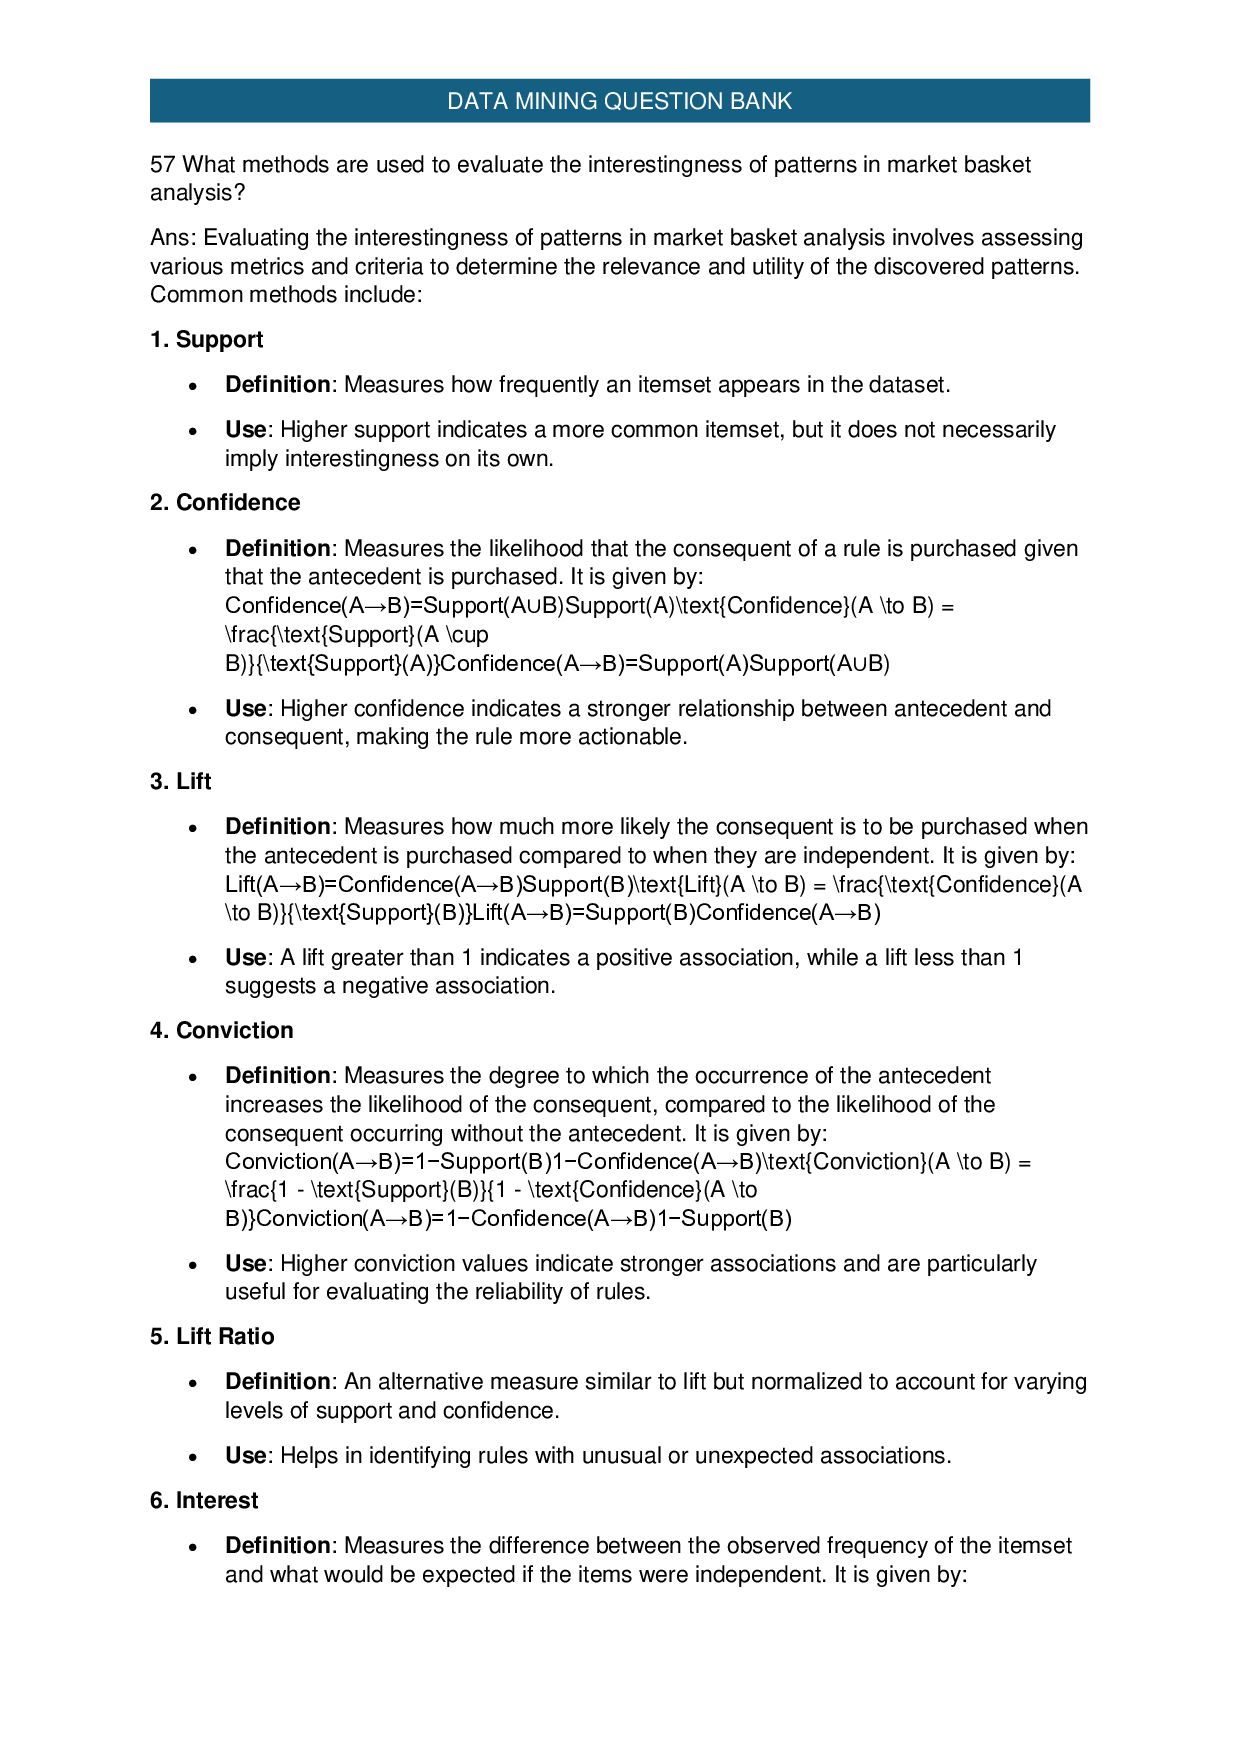
    evaluate the interestingness of patterns in market basket analysis? Ans: Evaluating the interestingness of patterns in market basket analysis involves assessing various metrics and criteria to determine the relevance and utility of the discovered patterns. Common methods include: 1. Support  Definition: Measures how frequently an itemset appears in the dataset.  Use: Higher support indicates a more common itemset, but it does not necessarily imply interestingness on its own. 2. Confidence  Definition: Measures the likelihood that the consequent of a rule is purchased given that the antecedent is purchased. It is given by: Confidence(A→B)=Support(A∪B)Support(A)\text{Confidence}(A \to B) = \frac{\text{Support}(A \cup B)}{\text{Support}(A)}Confidence(A→B)=Support(A)Support(A∪B)  Use: Higher confidence indicates a stronger relationship between antecedent and consequent, making the rule more actionable. 3. Lift  Definition: Measures how much more likely the consequent is to be purchased when the antecedent is purchased compared to when they are independent. It is given by: Lift(A→B)=Confidence(A→B)Support(B)\text{Lift}(A \to B) = \frac{\text{Confidence}(A \to B)}{\text{Support}(B)}Lift(A→B)=Support(B)Confidence(A→B)  Use: A lift greater than 1 indicates a positive association, while a lift less than 1 suggests a negative association. 4. Conviction  Definition: Measures the degree to which the occurrence of the antecedent increases the likelihood of the consequent, compared to the likelihood of the consequent occurring without the antecedent. It is given by: Conviction(A→B)=1−Support(B)1−Confidence(A→B)\text{Conviction}(A \to B) = \frac{1 - \text{Support}(B)}{1 - \text{Confidence}(A \to B)}Conviction(A→B)=1−Confidence(A→B)1−Support(B)  Use: Higher conviction values indicate stronger associations and are particularly useful for evaluating the reliability of rules. 5. Lift Ratio  Definition: An alternative measure similar to lift but normalized to account for varying levels of support and confidence.  Use: Helps in identifying rules with unusual or unexpected associations. 6. Interest  Definition: Measures the difference between the observed frequency of the itemset and what would be expected if the items were independent. It is given by:
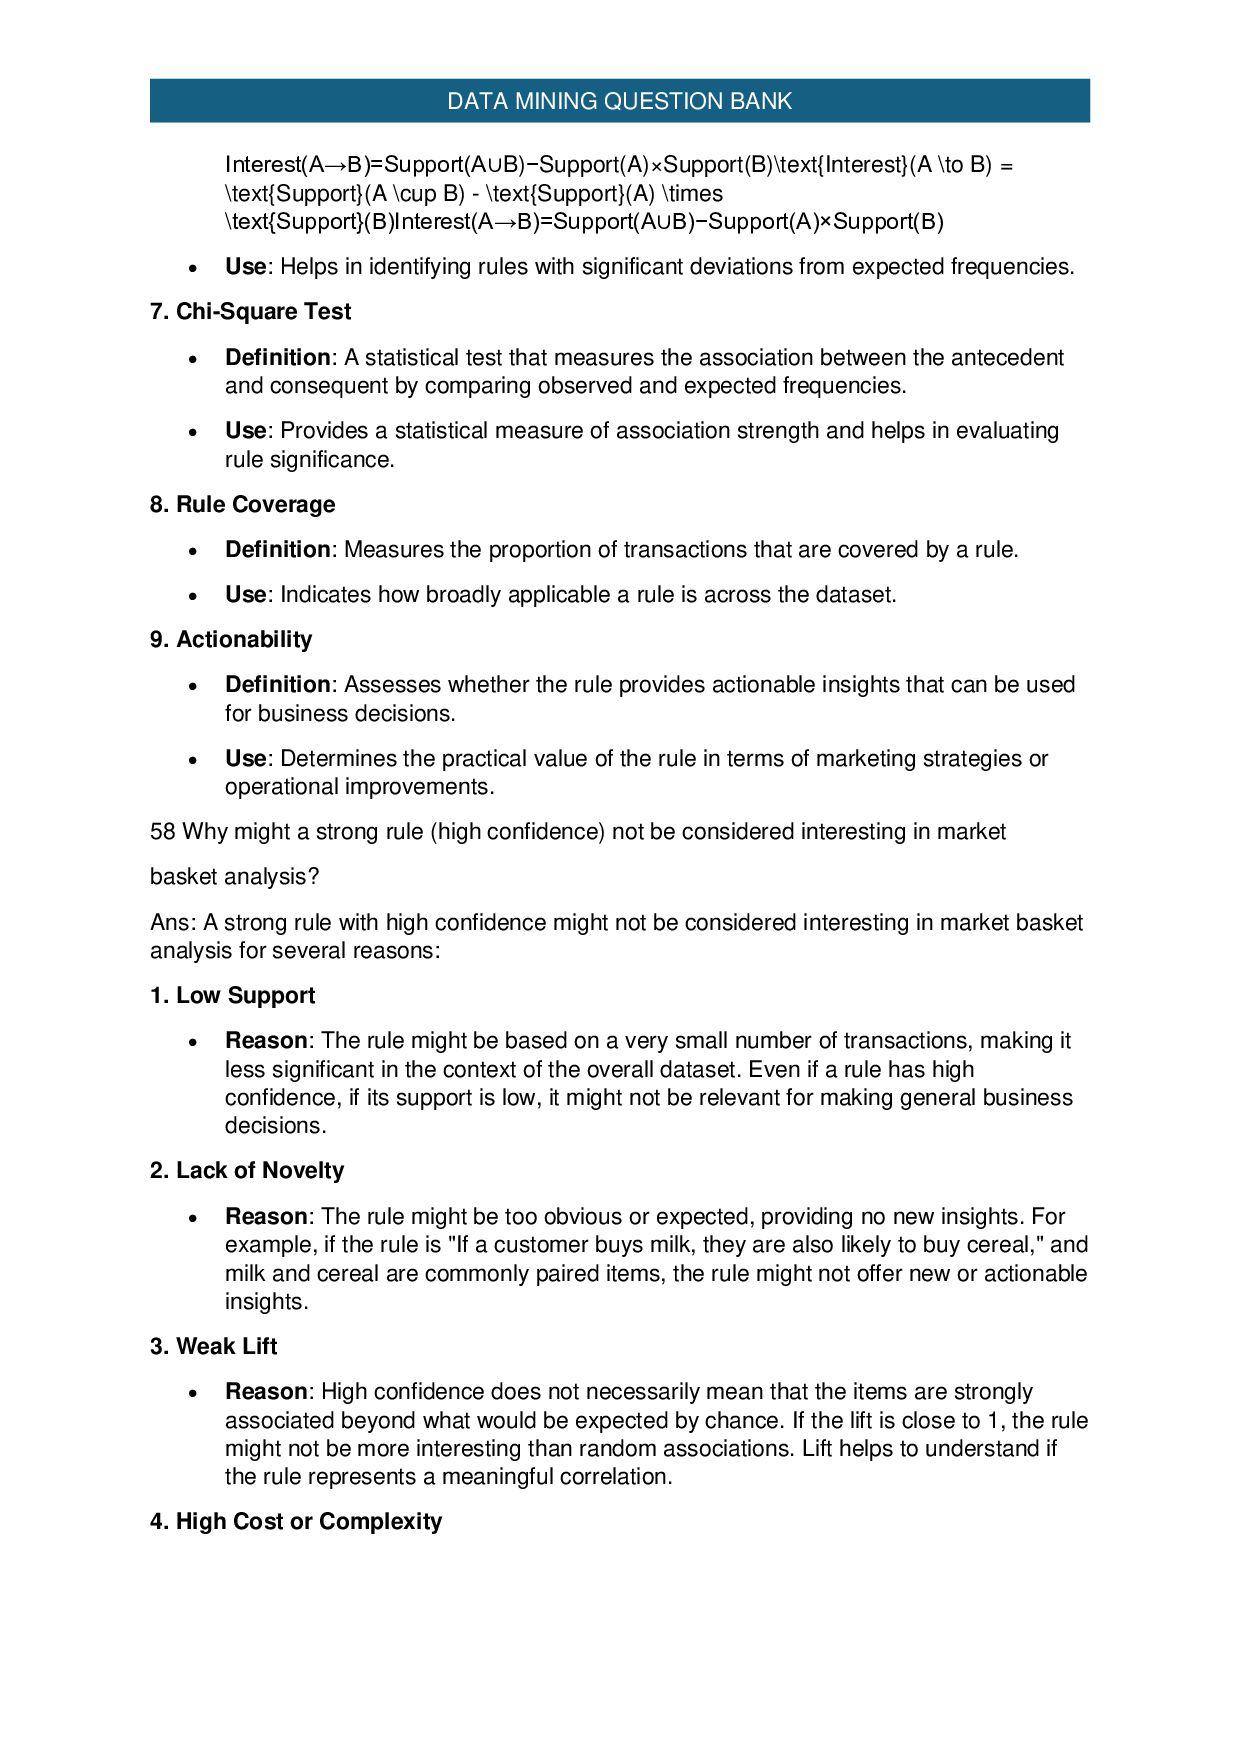
  40. DATA MINING QUESTION BANK Interest(A→B)=Support(A∪B)−Support(A)×Support(B)\text{Interest}(A \to B) = \text{Support}(A \cup

    B) - \text{Support}(A) \times \text{Support}(B)Interest(A→B)=Support(A∪B)−Support(A)×Support(B)  Use: Helps in identifying rules with significant deviations from expected frequencies. 7. Chi-Square Test  Definition: A statistical test that measures the association between the antecedent and consequent by comparing observed and expected frequencies.  Use: Provides a statistical measure of association strength and helps in evaluating rule significance. 8. Rule Coverage  Definition: Measures the proportion of transactions that are covered by a rule.  Use: Indicates how broadly applicable a rule is across the dataset. 9. Actionability  Definition: Assesses whether the rule provides actionable insights that can be used for business decisions.  Use: Determines the practical value of the rule in terms of marketing strategies or operational improvements. 58 Why might a strong rule (high confidence) not be considered interesting in market basket analysis? Ans: A strong rule with high confidence might not be considered interesting in market basket analysis for several reasons: 1. Low Support  Reason: The rule might be based on a very small number of transactions, making it less significant in the context of the overall dataset. Even if a rule has high confidence, if its support is low, it might not be relevant for making general business decisions. 2. Lack of Novelty  Reason: The rule might be too obvious or expected, providing no new insights. For example, if the rule is "If a customer buys milk, they are also likely to buy cereal," and milk and cereal are commonly paired items, the rule might not offer new or actionable insights. 3. Weak Lift  Reason: High confidence does not necessarily mean that the items are strongly associated beyond what would be expected by chance. If the lift is close to 1, the rule might not be more interesting than random associations. Lift helps to understand if the rule represents a meaningful correlation. 4. High Cost or Complexity
  41. DATA MINING QUESTION BANK  Reason: Implementing actions based on

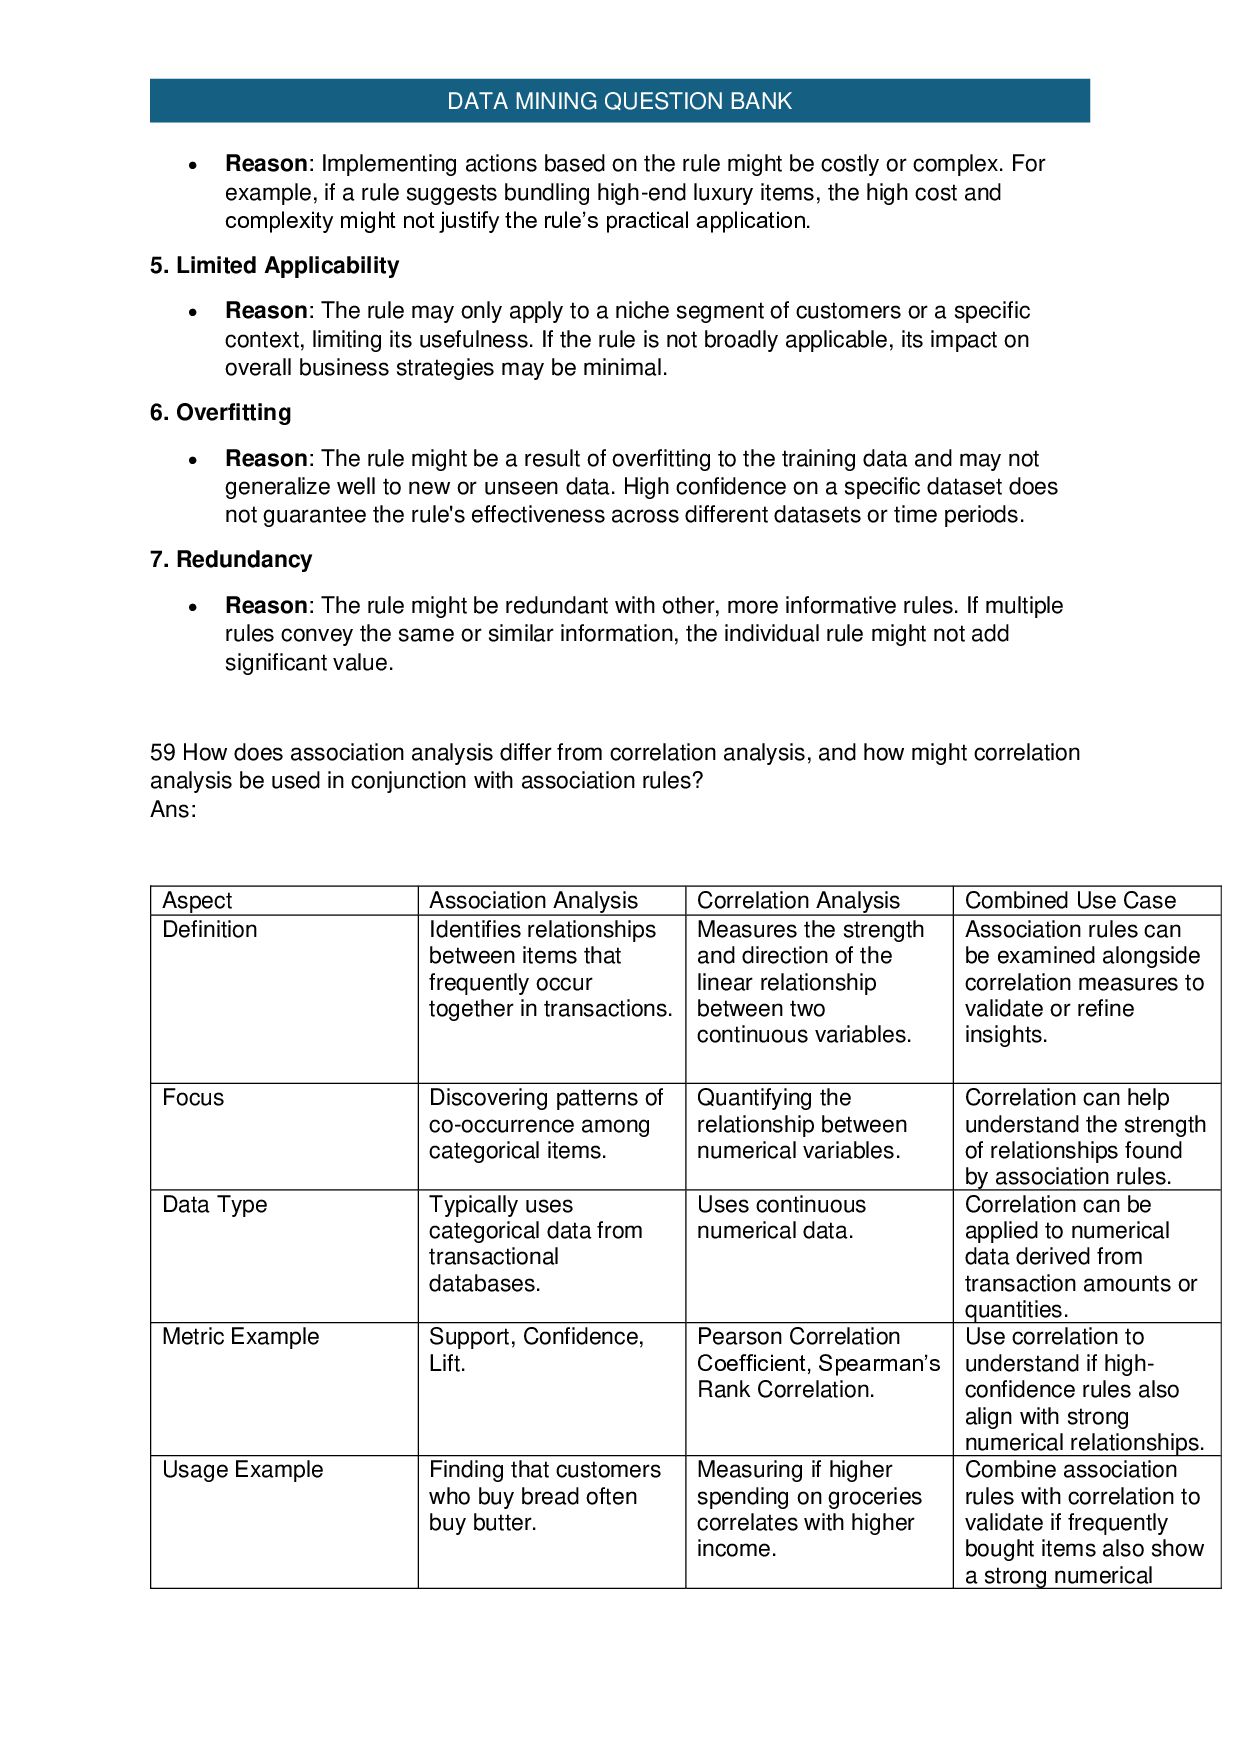
    the rule might be costly or complex. For example, if a rule suggests bundling high-end luxury items, the high cost and complexity might not justify the rule’s practical application. 5. Limited Applicability  Reason: The rule may only apply to a niche segment of customers or a specific context, limiting its usefulness. If the rule is not broadly applicable, its impact on overall business strategies may be minimal. 6. Overfitting  Reason: The rule might be a result of overfitting to the training data and may not generalize well to new or unseen data. High confidence on a specific dataset does not guarantee the rule's effectiveness across different datasets or time periods. 7. Redundancy  Reason: The rule might be redundant with other, more informative rules. If multiple rules convey the same or similar information, the individual rule might not add significant value. 59 How does association analysis differ from correlation analysis, and how might correlation analysis be used in conjunction with association rules? Ans: Aspect Association Analysis Correlation Analysis Combined Use Case Definition Identifies relationships between items that frequently occur together in transactions. Measures the strength and direction of the linear relationship between two continuous variables. Association rules can be examined alongside correlation measures to validate or refine insights. Focus Discovering patterns of co-occurrence among categorical items. Quantifying the relationship between numerical variables. Correlation can help understand the strength of relationships found by association rules. Data Type Typically uses categorical data from transactional databases. Uses continuous numerical data. Correlation can be applied to numerical data derived from transaction amounts or quantities. Metric Example Support, Confidence, Lift. Pearson Correlation Coefficient, Spearman’s Rank Correlation. Use correlation to understand if high- confidence rules also align with strong numerical relationships. Usage Example Finding that customers who buy bread often buy butter. Measuring if higher spending on groceries correlates with higher income. Combine association rules with correlation to validate if frequently bought items also show a strong numerical
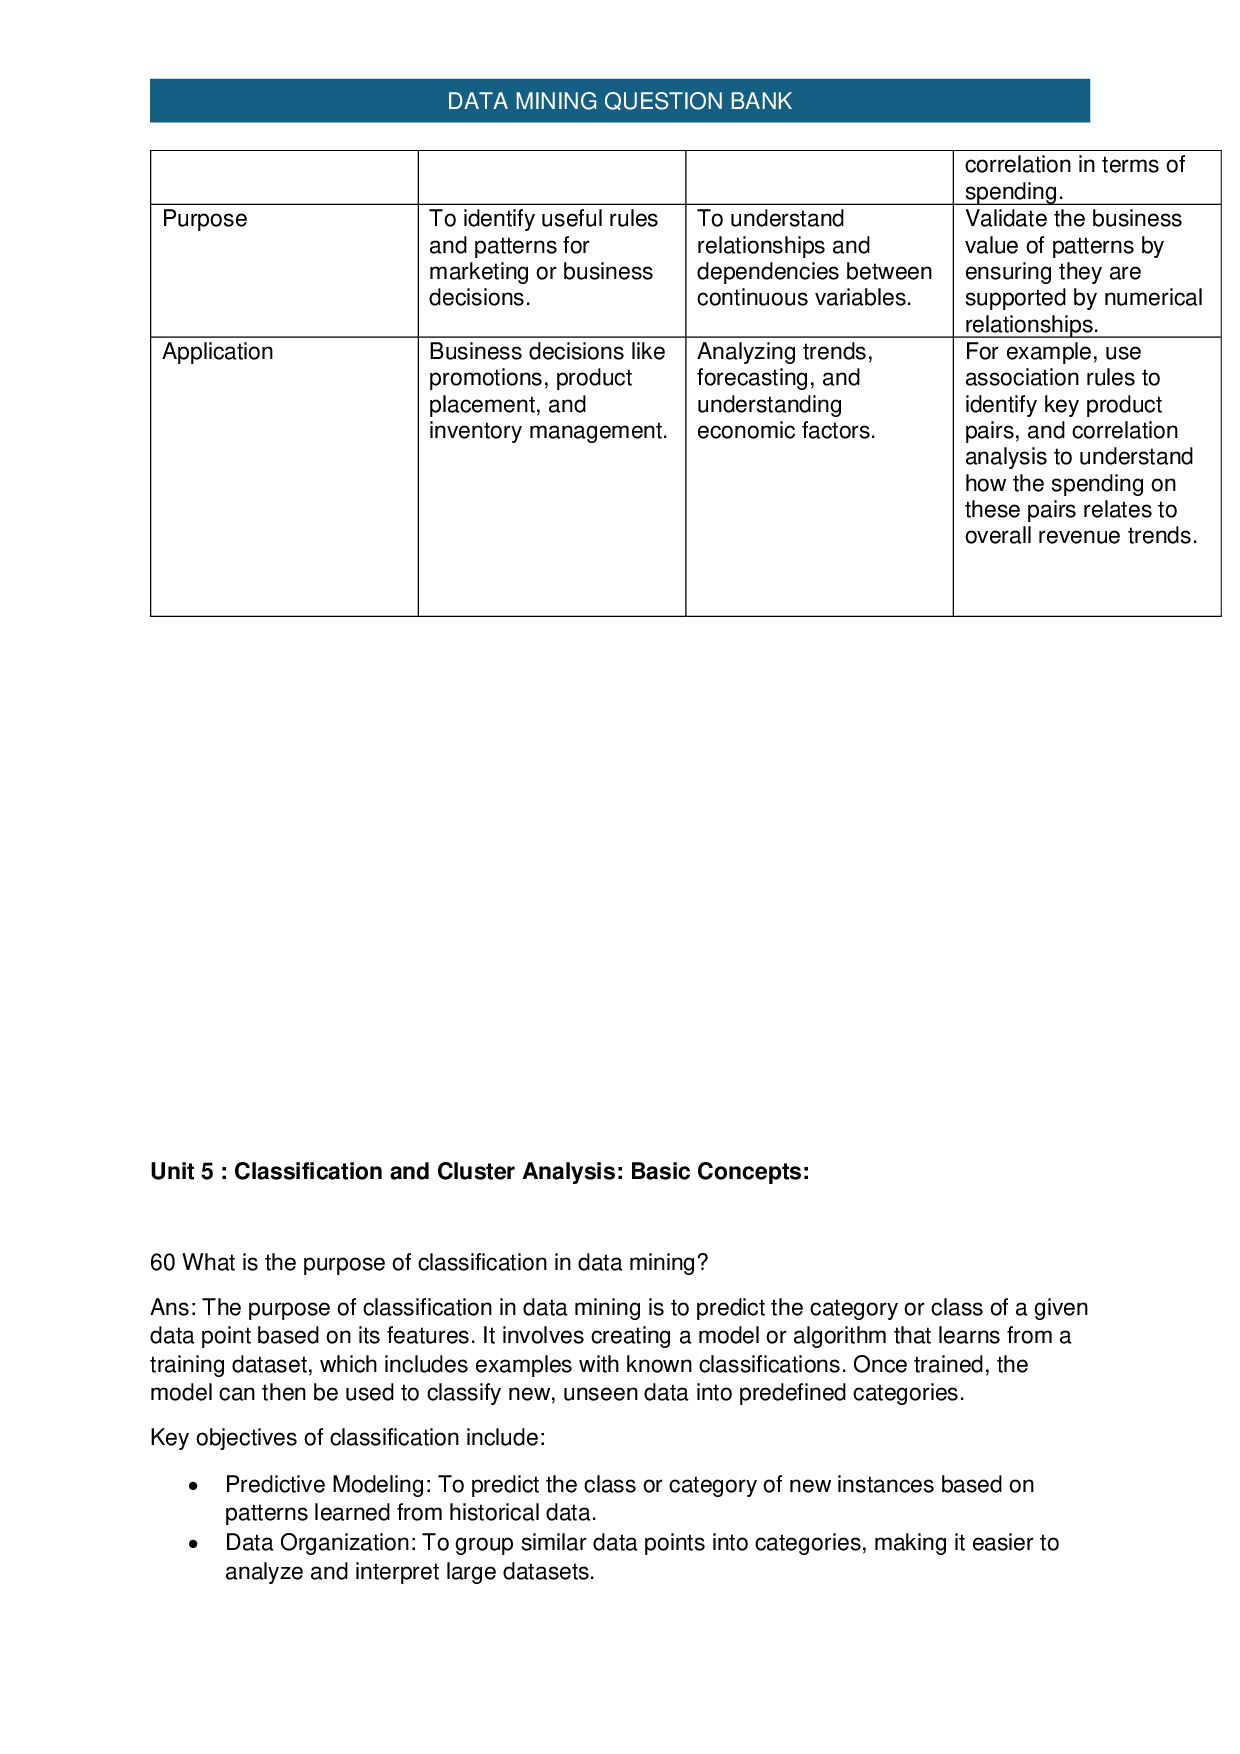
  42. DATA MINING QUESTION BANK correlation in terms of spending. Purpose

    To identify useful rules and patterns for marketing or business decisions. To understand relationships and dependencies between continuous variables. Validate the business value of patterns by ensuring they are supported by numerical relationships. Application Business decisions like promotions, product placement, and inventory management. Analyzing trends, forecasting, and understanding economic factors. For example, use association rules to identify key product pairs, and correlation analysis to understand how the spending on these pairs relates to overall revenue trends. Unit 5 : Classification and Cluster Analysis: Basic Concepts: 60 What is the purpose of classification in data mining? Ans: The purpose of classification in data mining is to predict the category or class of a given data point based on its features. It involves creating a model or algorithm that learns from a training dataset, which includes examples with known classifications. Once trained, the model can then be used to classify new, unseen data into predefined categories. Key objectives of classification include:  Predictive Modeling: To predict the class or category of new instances based on patterns learned from historical data.  Data Organization: To group similar data points into categories, making it easier to analyze and interpret large datasets.
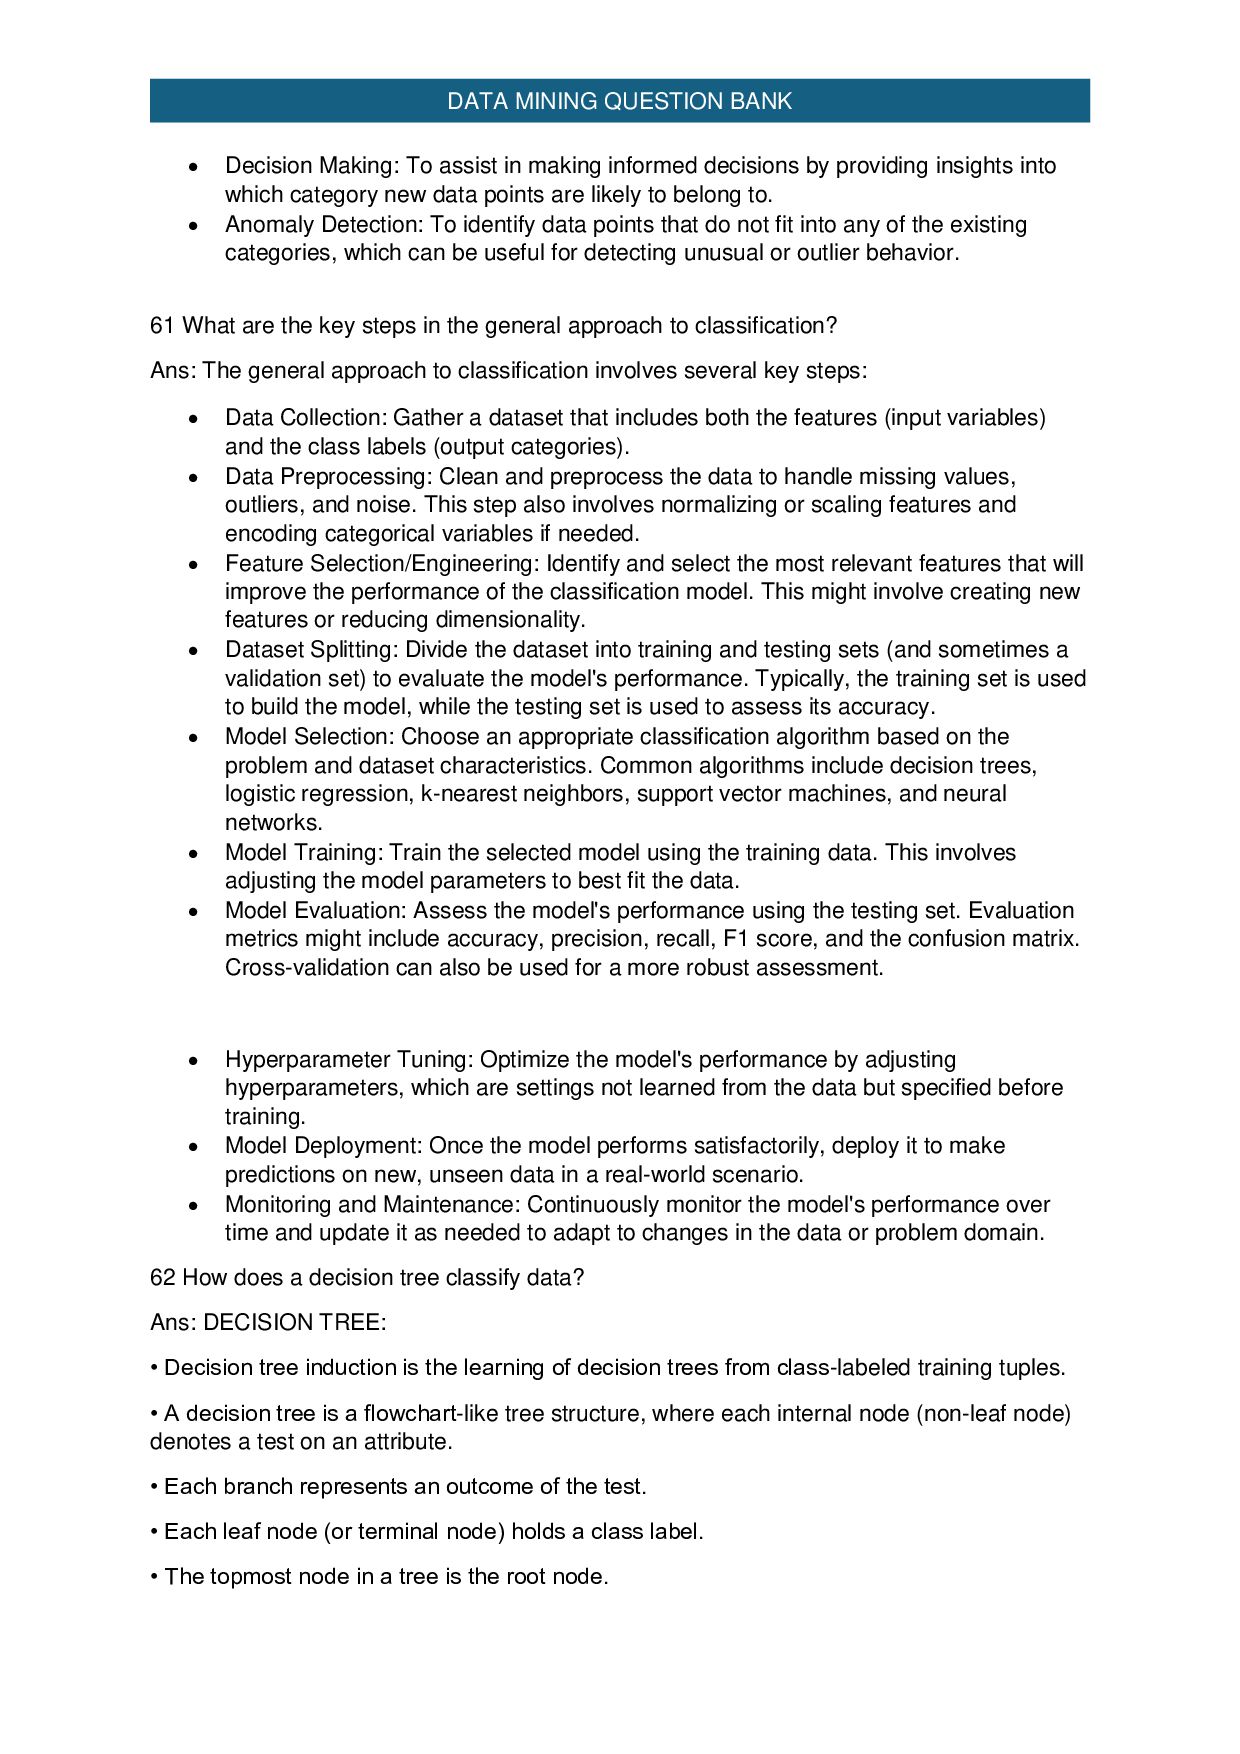
  43. DATA MINING QUESTION BANK  Decision Making: To assist in

    making informed decisions by providing insights into which category new data points are likely to belong to.  Anomaly Detection: To identify data points that do not fit into any of the existing categories, which can be useful for detecting unusual or outlier behavior. 61 What are the key steps in the general approach to classification? Ans: The general approach to classification involves several key steps:  Data Collection: Gather a dataset that includes both the features (input variables) and the class labels (output categories).  Data Preprocessing: Clean and preprocess the data to handle missing values, outliers, and noise. This step also involves normalizing or scaling features and encoding categorical variables if needed.  Feature Selection/Engineering: Identify and select the most relevant features that will improve the performance of the classification model. This might involve creating new features or reducing dimensionality.  Dataset Splitting: Divide the dataset into training and testing sets (and sometimes a validation set) to evaluate the model's performance. Typically, the training set is used to build the model, while the testing set is used to assess its accuracy.  Model Selection: Choose an appropriate classification algorithm based on the problem and dataset characteristics. Common algorithms include decision trees, logistic regression, k-nearest neighbors, support vector machines, and neural networks.  Model Training: Train the selected model using the training data. This involves adjusting the model parameters to best fit the data.  Model Evaluation: Assess the model's performance using the testing set. Evaluation metrics might include accuracy, precision, recall, F1 score, and the confusion matrix. Cross-validation can also be used for a more robust assessment.  Hyperparameter Tuning: Optimize the model's performance by adjusting hyperparameters, which are settings not learned from the data but specified before training.  Model Deployment: Once the model performs satisfactorily, deploy it to make predictions on new, unseen data in a real-world scenario.  Monitoring and Maintenance: Continuously monitor the model's performance over time and update it as needed to adapt to changes in the data or problem domain. 62 How does a decision tree classify data? Ans: DECISION TREE: • Decision tree induction is the learning of decision trees from class-labeled training tuples. • A decision tree is a flowchart-like tree structure, where each internal node (non-leaf node) denotes a test on an attribute. • Each branch represents an outcome of the test. • Each leaf node (or terminal node) holds a class label. • The topmost node in a tree is the root node.
  44. DATA MINING QUESTION BANK • Decision Tree represents the concept

    buys_computer, i.e. it predicts whether a customer at AllElectronics is likely to purchase a computer. 63 What does decision tree induction involve? Ans: Data Preparation: Gather and prepare a dataset with input features and corresponding class labels. Feature Selection: At each node of the tree, choose the feature that best separates the data into different classes. This involves calculating metrics such as Gini impurity or information gain. Splitting: Split the data based on the selected feature. This creates branches in the tree representing different possible values or ranges for that feature. Recursive Partitioning: Apply the same process recursively to each subset of data, creating further branches and nodes until certain stopping criteria are met. Stopping Criteria: The recursion stops when:  All data points in a node belong to the same class.  A predefined tree depth is reached.  Further splits do not significantly improve classification.  A minimum number of samples per node is reached. Tree Construction: The result is a tree with nodes representing decisions based on features, and leaf nodes representing class labels or outcomes. 64 What is the principle behind Bayes classification? Ans: Bayes Principle: Bayes’ Theorem: Bayes' theorem states that the probability of a class CCC given the features XXX (denoted P(C∣X)P(C|X)P(C∣X)) can be computed using the following formula: P(C∣X)=P(X∣C)⋅P(C)P(X)P(C|X) = \frac{P(X|C) \cdot P(C)}{P(X)}P(C∣X)=P(X)P(X∣C)⋅P(C) where:  P(C∣X)P(C|X)P(C∣X) is the posterior probability of the class CCC given the features XXX.  P(X∣C)P(X|C)P(X∣C) is the likelihood of the features XXX given the class CCC.  P(C)P(C)P(C) is the prior probability of the class CCC.  P(X)P(X)P(X) is the marginal probability of the features XXX.
  45. DATA MINING QUESTION BANK Classifying Data: To classify a new

    data point, the algorithm calculates the posterior probability for each possible class based on the given features and assigns the class with the highest probability. Naive Bayes Assumption: In many practical applications, such as the Naive Bayes classifier, an assumption is made that features are conditionally independent given the class. This simplifies the computation of P(X∣C)P(X|C)P(X∣C) as the product of the individual feature probabilities: P(X∣C)=∏iP(xi∣C)P(X|C) = \prod_{i} P(x_i|C)P(X∣C)=i∏P(xi∣C) where xix_ixi represents each individual feature. Decision Rule: The data point is assigned to the class that maximizes the posterior probability P(C∣X)P(C|X)P(C∣X). 65 What is the goal of cluster analysis? Ans: The goal of cluster analysis is to group a set of data points into clusters or groups such that points within the same cluster are more similar to each other than to points in other clusters. Identify Natural Groupings: Discover inherent patterns and groupings within the data without prior knowledge of class labels. Data Simplification: Reduce the complexity of data by summarizing it into clusters, which can make it easier to analyze and interpret. Anomaly Detection: Identify outliers or unusual data points that do not fit into any cluster, which may indicate special cases or errors. Feature Understanding: Gain insights into the underlying structure of the data by analyzing the characteristics and relationships within and between clusters. Pattern Recognition: Detect patterns and trends that can be useful for decision-making, prediction, or further analysis. 66 What are the main requirements for effective cluster analysis? Ans: Meaningful Features: Ensure that the features used for clustering are relevant and provide useful information about the data. For small datasets, each feature's contribution can be more critical. Appropriate Clustering Algorithm: Choose a clustering algorithm suited to the data's nature and size. For small datasets, algorithms that are sensitive to noise and outliers may need to be used cautiously. Distance Metric: Select an appropriate distance or similarity metric that accurately reflects the relationships between data points. Common metrics include Euclidean distance, Manhattan distance, or cosine similarity. Cluster Validity: Use metrics or methods to validate the quality and effectiveness of the clustering results. For small datasets, visual inspection, silhouette scores, or domain knowledge can be helpful.
  46. DATA MINING QUESTION BANK Preprocessing: Ensure that data is preprocessed

    correctly. This might involve normalization, handling missing values, and removing noise, which can be especially important with limited data. Cluster Interpretability: Ensure that the clusters formed are interpretable and meaningful in the context of the data. For small datasets, understanding and validating the clusters' relevance to the problem at hand is crucial. Handling Overfitting: Be cautious of overfitting, where the algorithm might create too many clusters or overly specific clusters due to the small size of the dataset. 67 Name and briefly describe a few basic clustering methods Ans: K-Means Clustering:  Description: K-Means is a partition-based clustering algorithm that aims to divide a dataset into kkk clusters, where kkk is a user-specified number. It works by iteratively assigning data points to the nearest cluster center and then updating the cluster centers based on the assigned points.  Characteristics: It requires the number of clusters to be specified in advance and is sensitive to the initial placement of cluster centers. Hierarchical Clustering:  Description: Hierarchical clustering builds a hierarchy of clusters either through an agglomerative approach (bottom-up) or a divisive approach (top-down). In agglomerative clustering, each data point starts as its own cluster and merges with others based on similarity. In divisive clustering, all data points start in a single cluster and are recursively split.  Characteristics: It produces a dendrogram (a tree-like diagram) that shows the arrangement of clusters at different levels. It does not require the number of clusters to be specified in advance. DBSCAN (Density-Based Spatial Clustering of Applications with Noise):  Description: DBSCAN is a density-based clustering algorithm that groups together points that are closely packed together while marking points in low-density regions as outliers. It requires two parameters: the maximum distance between points in a cluster (epsilon) and the minimum number of points required to form a dense region (minPts).  Characteristics: It can identify clusters of arbitrary shapes and is robust to noise and outliers. It does not require specifying the number of clusters in advance. Mean Shift Clustering:  Description: Mean Shift is a centroid-based clustering algorithm that iteratively shifts the centroid of a cluster to the mean of the data points within a given radius. This process continues until convergence, resulting in the detection of modes in the data distribution.
  47. DATA MINING QUESTION BANK  Characteristics: It does not require

    specifying the number of clusters in advance and can find clusters of varying shapes and sizes. Gaussian Mixture Models (GMM):  Description: GMM is a probabilistic model that assumes the data is generated from a mixture of several Gaussian distributions. It estimates the parameters of these distributions using algorithms like Expectation-Maximization (EM) to assign data points to clusters based on probability.  Characteristics: It can model clusters with different shapes and sizes, and it provides probabilistic cluster assignments. 68 How do partitioning methods work in clustering? Ans: how partitioning methods work: 1. Define Number of Clusters: The user specifies the number of clusters kkk to be created. This is a critical step as it determines how the data will be divided. 2. Initialize Clusters: The algorithm begins by initializing the cluster centroids or cluster centers. This can be done randomly or using specific methods (e.g., K-Means++ for improved initialization). 3. Assign Data Points: Each data point is assigned to the nearest cluster center based on a distance metric (e.g., Euclidean distance). This step forms the initial clusters. 4. Update Cluster Centers: After assigning data points, the cluster centers are recalculated as the mean of all points assigned to each cluster. This step updates the positions of the cluster centers. 5. Iterate: Steps 3 and 4 are repeated iteratively. Data points are reassigned to the nearest cluster center, and the cluster centers are updated accordingly. This process continues until the cluster assignments no longer change significantly or until a predefined number of iterations is reached. 6. Convergence: The algorithm converges when the cluster assignments stabilize and no longer change, or when other stopping criteria (such as a maximum number of iterations) are met. At this point, the final clusters are determined. 69 Describe the K-Means clustering algorithm. How does it partition data into clusters and what are the key steps involved in the algorithm? Ans: K-MEANS ALGORITHM:  K-Means is one of the simplest unsupervised learning algorithm that solve the well known clustering problem.  The procedure follows a simple and easy way to classify a given data set through a certain number of clusters (k-clusters).  The main idea is to define k centroids, one for each cluster.  A centroid is “the center of mass of a geometric object of uniform density”, though here, we'll consider mean vectors as centroids.  It is a method of classifying/grouping items into k groups (where k is the number of pre-chosen groups).
  48. DATA MINING QUESTION BANK  The grouping is done by

    minimizing the sum of squared distances between items or objects and the corresponding centroid.  A clustered scatter plot.  The black dots are data points.  The red lines illustrate the partitions created by the k-means algorithm.  The blue dots represent the centroids which define the partitions. 70 How does the K-Means algorithm perform clustering? Ans: K-Means algorithm works: 1. Initialization: o Choose kkk: Specify the number of clusters kkk to partition the data into. o Initialize Centroids: Randomly select kkk data points from the dataset as the initial cluster centroids. Alternatively, use methods like K-Means++ for more strategic initialization to improve results. 2. Assignment Step: o Assign Points to Clusters: For each data point, calculate the distance between the point and each of the kkk centroids. Assign each data point to the cluster with the nearest centroid. This forms kkk clusters based on the current centroids. 3. Update Step: o Recalculate Centroids: After assigning all data points to clusters, recalculate the centroid of each cluster. The centroid is typically the mean of all data points assigned to the cluster. This new centroid is then used in the next iteration. 4. Iteration: o Repeat the Assignment and Update steps until convergence. Convergence occurs when the assignments of data points to clusters no longer change significantly, or when the centroids stabilize and do not move substantially between iterations. 5. Termination:
  49. DATA MINING QUESTION BANK o The algorithm terminates when the

    cluster assignments are stable, or after a predefined number of iterations. The final result is kkk clusters with their respective centroids. 71 Outline the steps involved in the K-Means algorithm Ans: The working of the K-Means algorithm is explained in the below steps: Step-1: Select the number K to decide the number of clusters Step-2: Select random K points or centroids. (It can be other from the input dataset). Step-3: Assign each data point to their closest centroid, which will form the predefined K clusters. Step-4: Calculate the variance and place a new centroid of each cluster. Step-5: Repeat the third steps, which means reassign each datapoint to the new closest centroid of each cluster. Step-6: If any reassignment occurs, then go to step-4 else go to FINISH. Step-7: The model is ready.