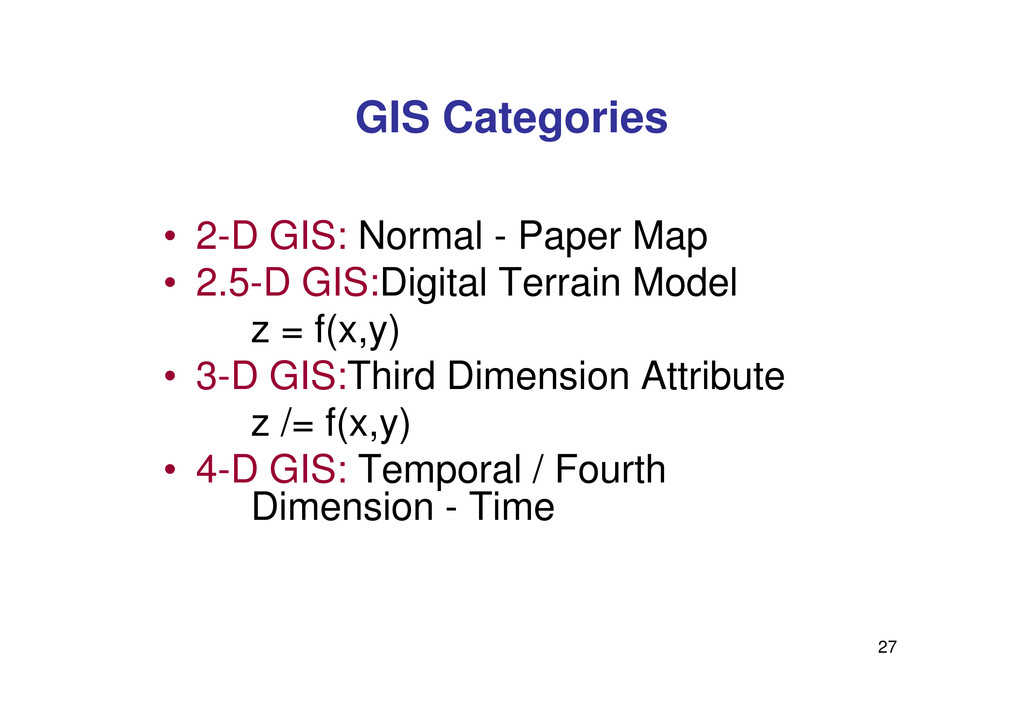
a computerized system which facilitates capture, storage, retrieval, analysis and display of geospatial data. • “GIS” term popularized by US Bureau of the Census. 3 Census. • GIS supports queries like population of town or city, features of soil, patterns of earthquake, level of ground water etc. • The study of the art, science, engineering and technology required to answer these geographical questions constitutes GIS. • GIS helps to integrate multi-sector, multi-level, and multi-period database.
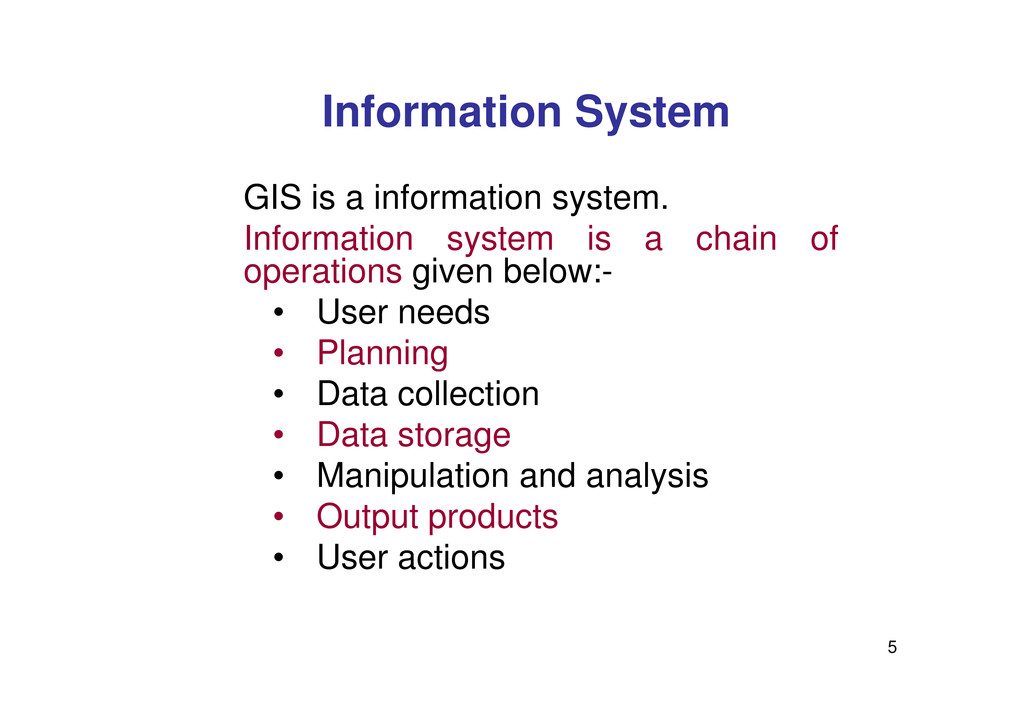
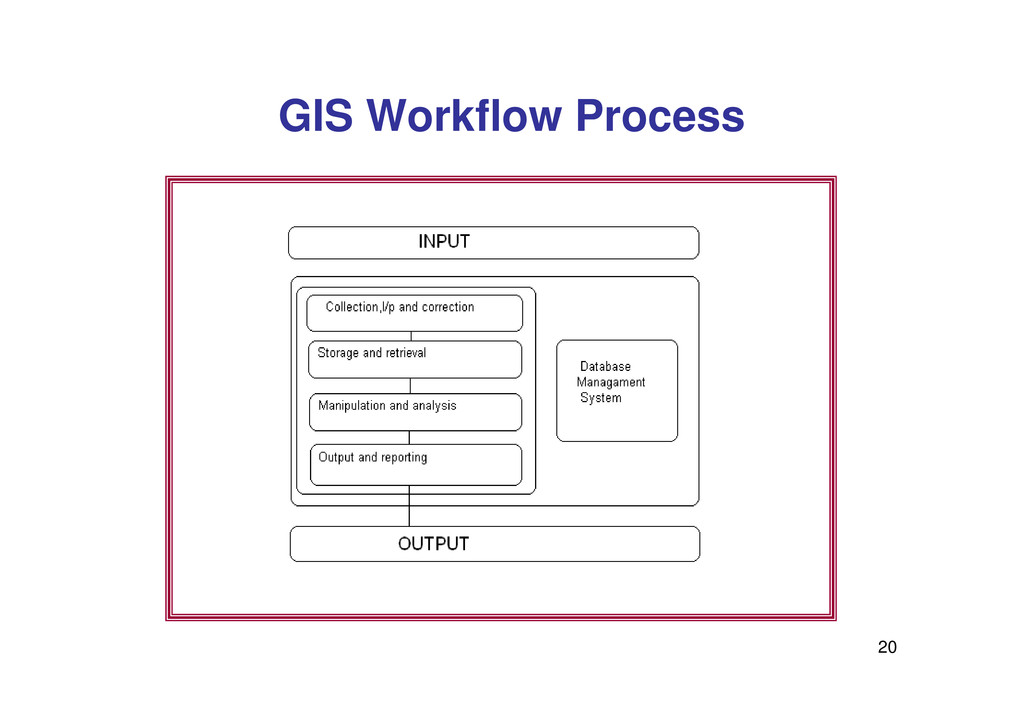
a chain of operations given below:- • User needs • Planning 5 • Planning • Data collection • Data storage • Manipulation and analysis • Output products • User actions
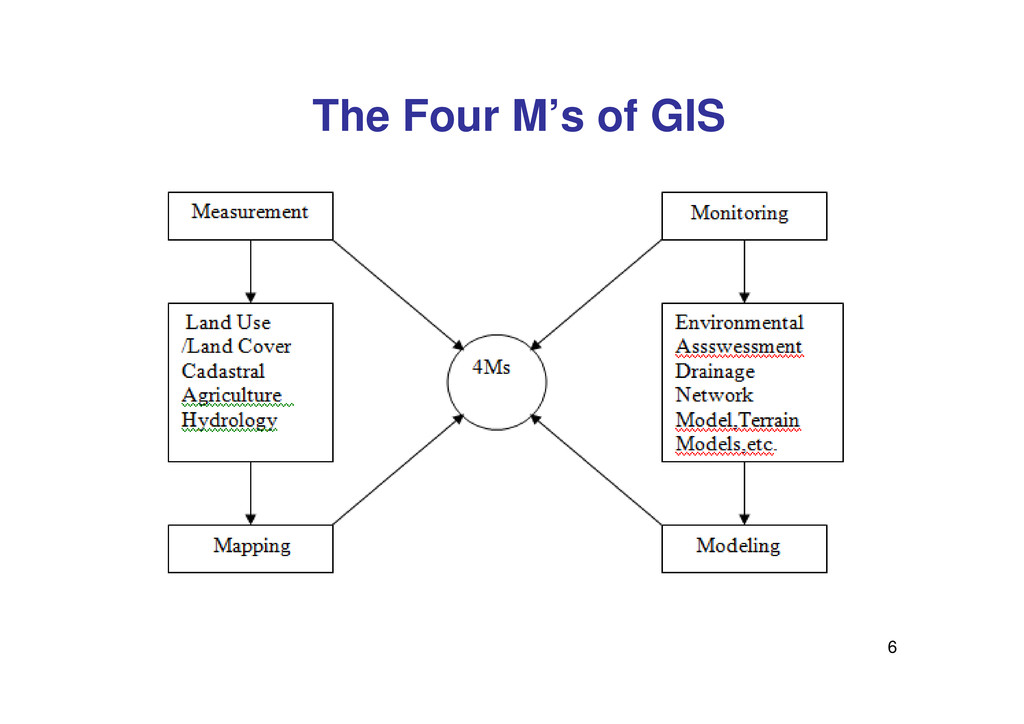
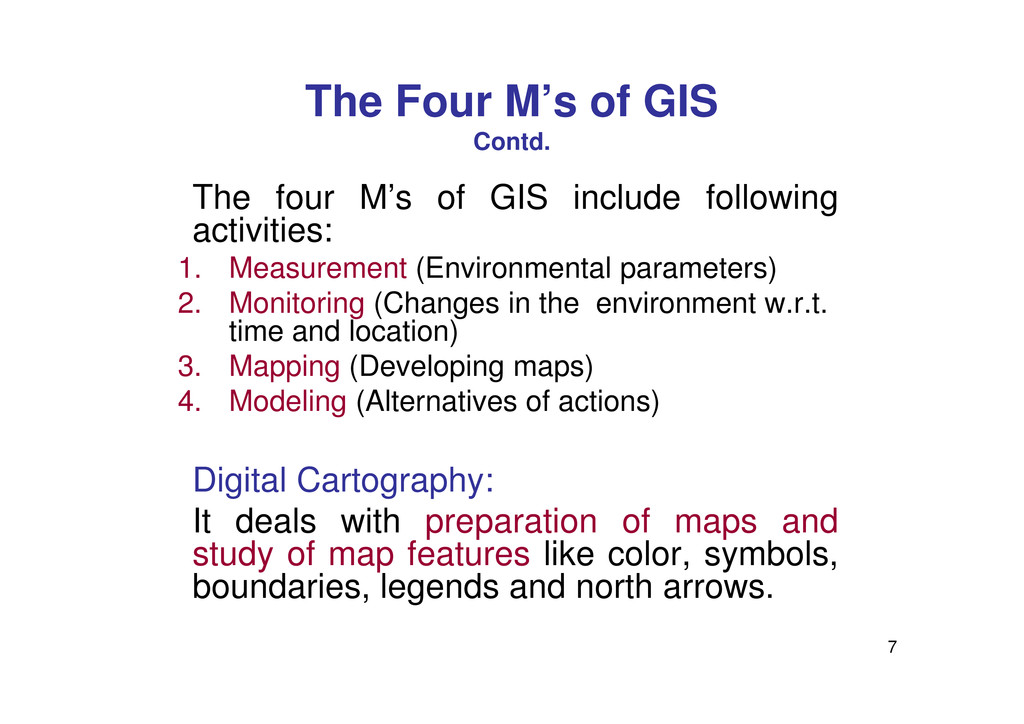
(Environmental parameters) 2. Monitoring (Changes in the environment w.r.t. time and location) 3. Mapping (Developing maps) The Four M’s of GIS Contd. 7 3. Mapping (Developing maps) 4. Modeling (Alternatives of actions) Digital Cartography: It deals with preparation of maps and study of map features like color, symbols, boundaries, legends and north arrows.
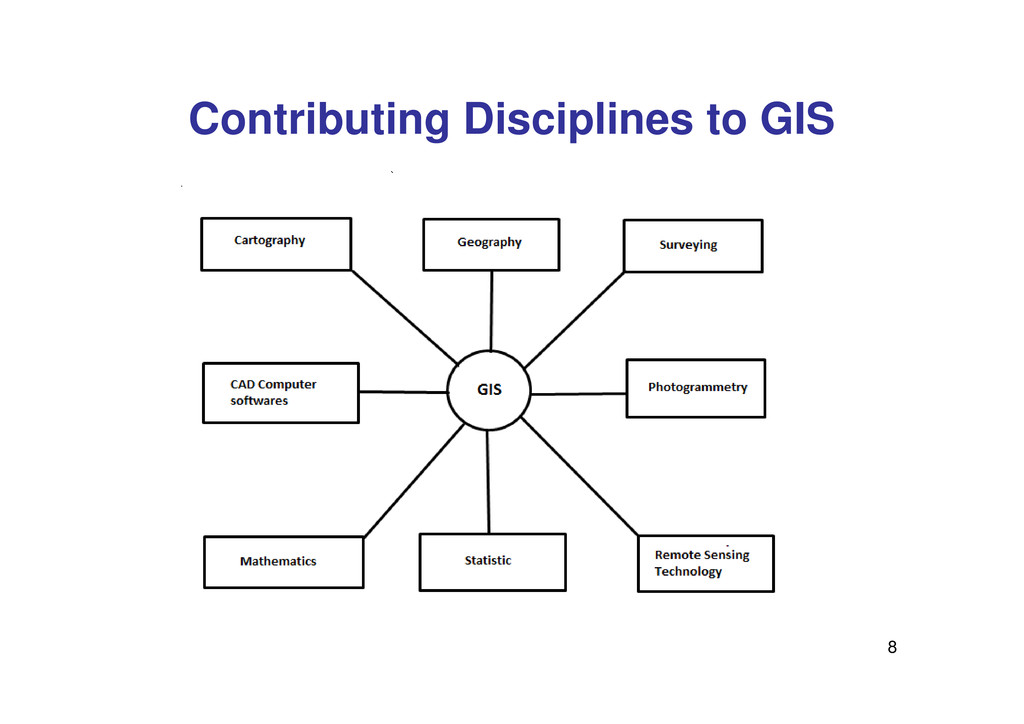
surface, area etc • Computer Science: Study of computer networks, graphics, CAD / CAM etc • Mathematics: Study of geometry, graph theory, statistics etc • Remote Sensing: Study of capturing the data and transfer 9 • Remote Sensing: Study of capturing the data and transfer over long distance etc • Cartography: Study of map • Surveying: Measurements and mapping of land / spatial data • Photography: Imaging of geographical entities / phenomena
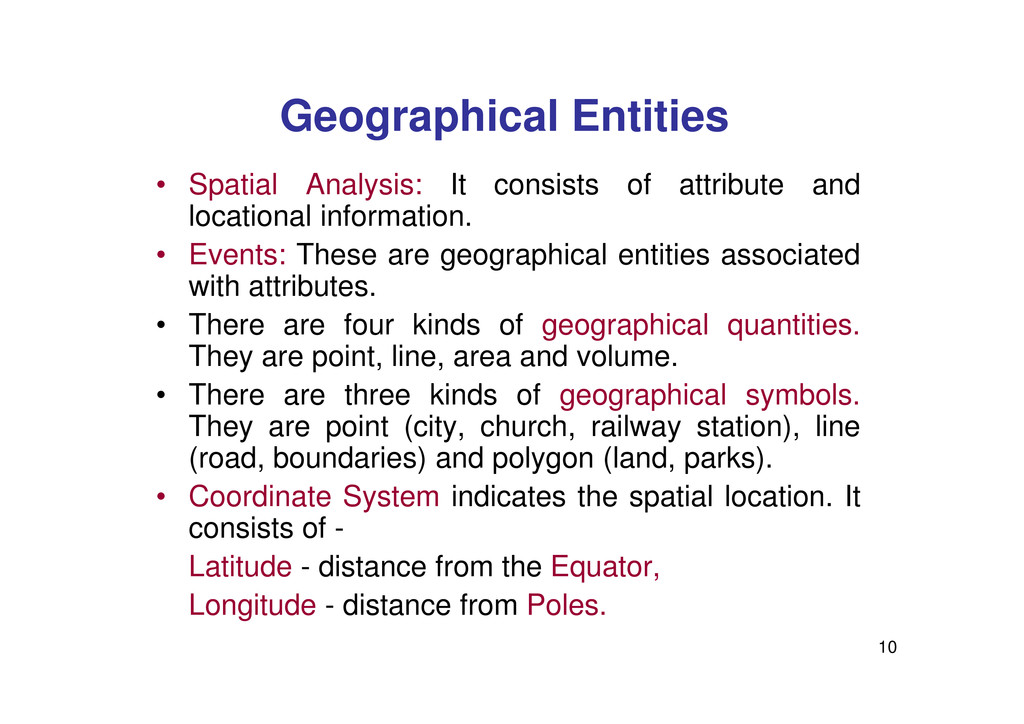
locational information. • Events: These are geographical entities associated with attributes. • There are four kinds of geographical quantities. They are point, line, area and volume. 10 They are point, line, area and volume. • There are three kinds of geographical symbols. They are point (city, church, railway station), line (road, boundaries) and polygon (land, parks). • Coordinate System indicates the spatial location. It consists of - Latitude - distance from the Equator, Longitude - distance from Poles.
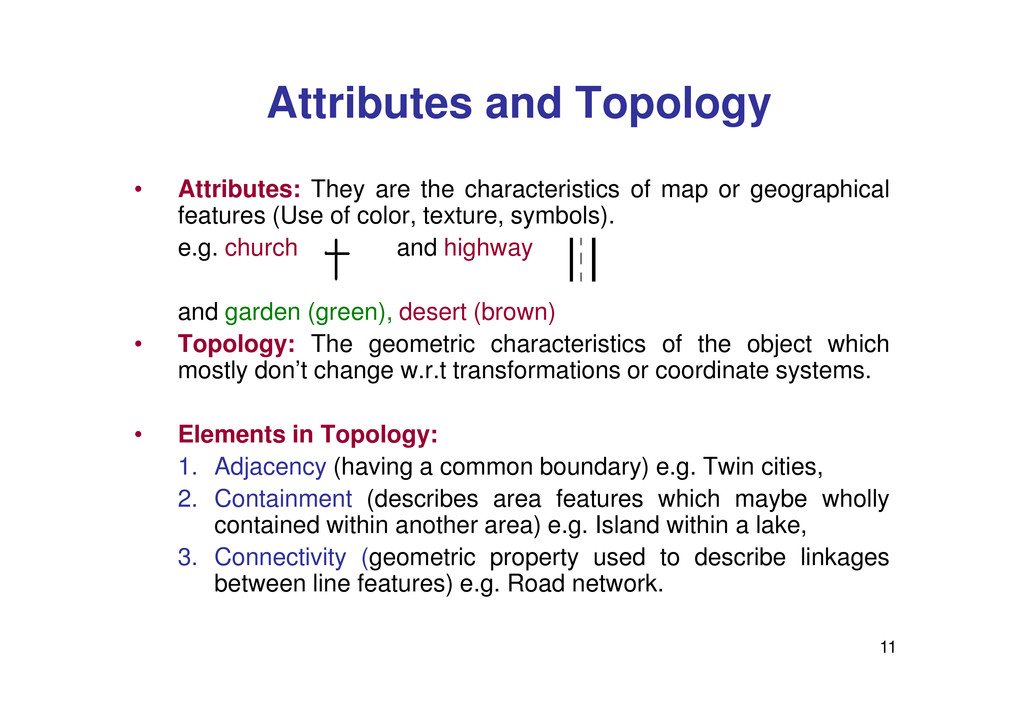
map or geographical features (Use of color, texture, symbols). e.g. church and highway and garden (green), desert (brown) • Topology: The geometric characteristics of the object which mostly don’t change w.r.t transformations or coordinate systems. 11 mostly don’t change w.r.t transformations or coordinate systems. • Elements in Topology: 1. Adjacency (having a common boundary) e.g. Twin cities, 2. Containment (describes area features which maybe wholly contained within another area) e.g. Island within a lake, 3. Connectivity (geometric property used to describe linkages between line features) e.g. Road network.
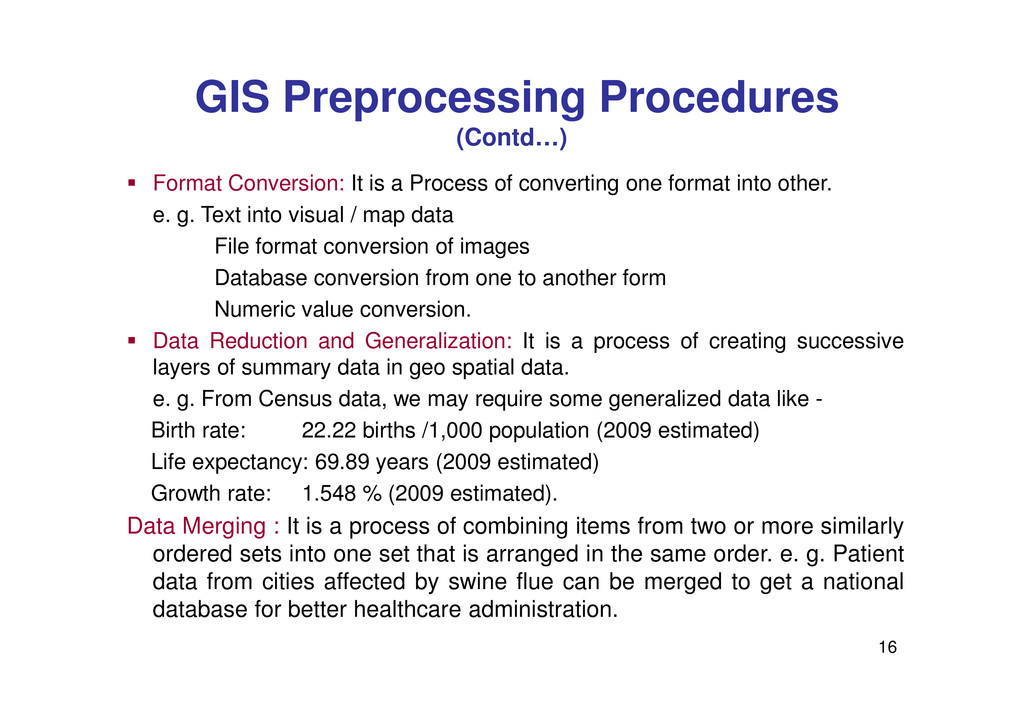
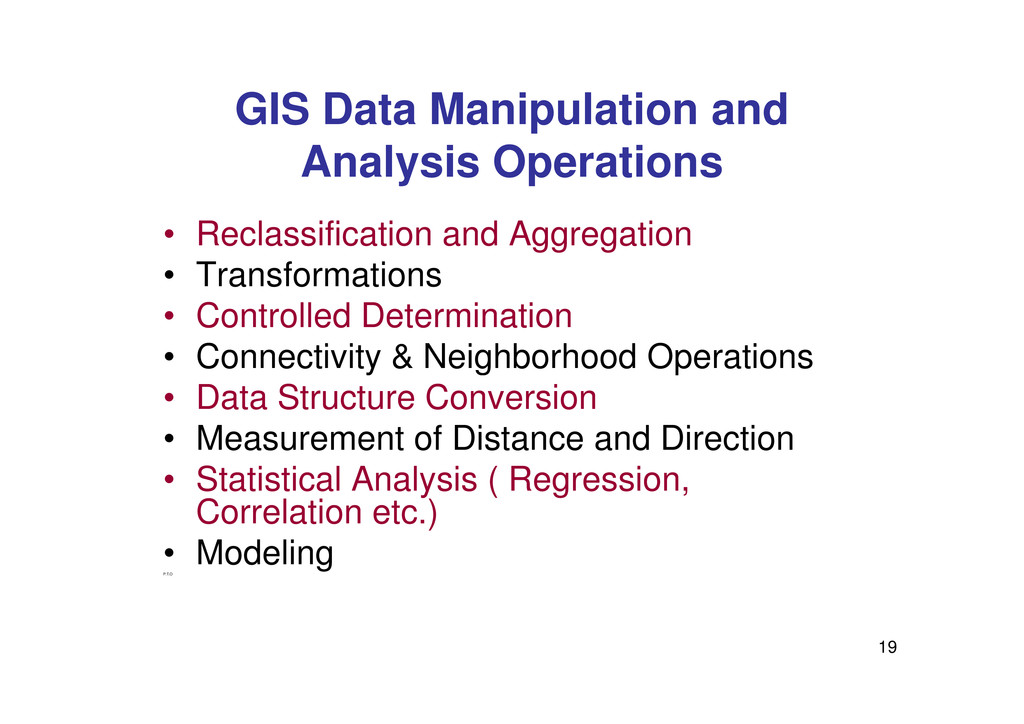
of converting one format into other. e. g. Text into visual / map data File format conversion of images Database conversion from one to another form Numeric value conversion. Data Reduction and Generalization: It is a process of creating successive layers of summary data in geo spatial data. 16 layers of summary data in geo spatial data. e. g. From Census data, we may require some generalized data like - Birth rate: 22.22 births /1,000 population (2009 estimated) Life expectancy: 69.89 years (2009 estimated) Growth rate: 1.548 % (2009 estimated). Data Merging : It is a process of combining items from two or more similarly ordered sets into one set that is arranged in the same order. e. g. Patient data from cities affected by swine flue can be merged to get a national database for better healthcare administration.
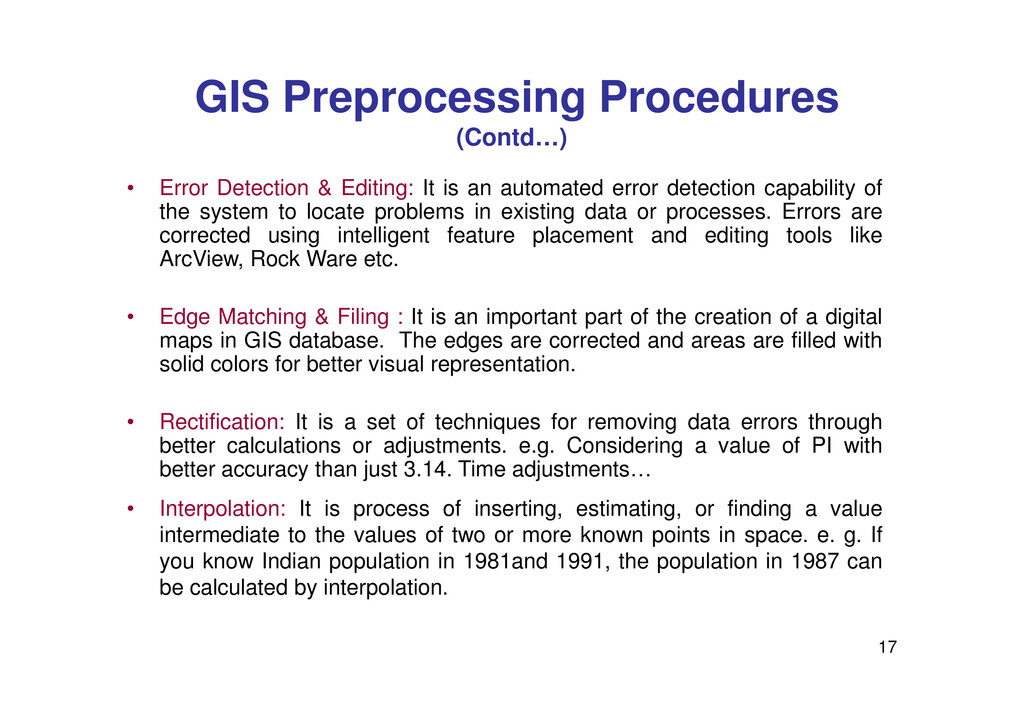
is an automated error detection capability of the system to locate problems in existing data or processes. Errors are corrected using intelligent feature placement and editing tools like ArcView, Rock Ware etc. • Edge Matching & Filing : It is an important part of the creation of a digital maps in GIS database. The edges are corrected and areas are filled with solid colors for better visual representation. 17 solid colors for better visual representation. • Rectification: It is a set of techniques for removing data errors through better calculations or adjustments. e.g. Considering a value of PI with better accuracy than just 3.14. Time adjustments… • Interpolation: It is process of inserting, estimating, or finding a value intermediate to the values of two or more known points in space. e. g. If you know Indian population in 1981and 1991, the population in 1987 can be calculated by interpolation.
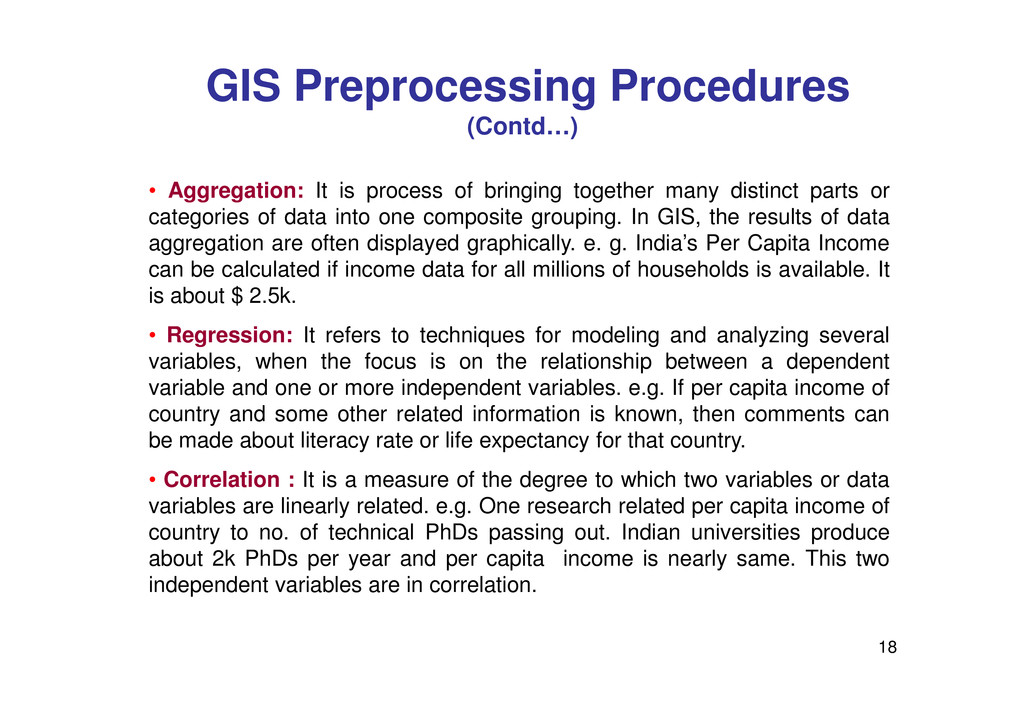
bringing together many distinct parts or categories of data into one composite grouping. In GIS, the results of data aggregation are often displayed graphically. e. g. India’s Per Capita Income can be calculated if income data for all millions of households is available. It is about $ 2.5k. • Regression: It refers to techniques for modeling and analyzing several variables, when the focus is on the relationship between a dependent 18 variables, when the focus is on the relationship between a dependent variable and one or more independent variables. e.g. If per capita income of country and some other related information is known, then comments can be made about literacy rate or life expectancy for that country. • Correlation : It is a measure of the degree to which two variables or data variables are linearly related. e.g. One research related per capita income of country to no. of technical PhDs passing out. Indian universities produce about 2k PhDs per year and per capita income is nearly same. This two independent variables are in correlation.
manipulate, edit, copy and transmit. • GIS tools used with digital maps are map digitizers, scanners, graphics 21 map digitizers, scanners, graphics displays, printers and plotters. • Concept was initiated by David Bickmore.
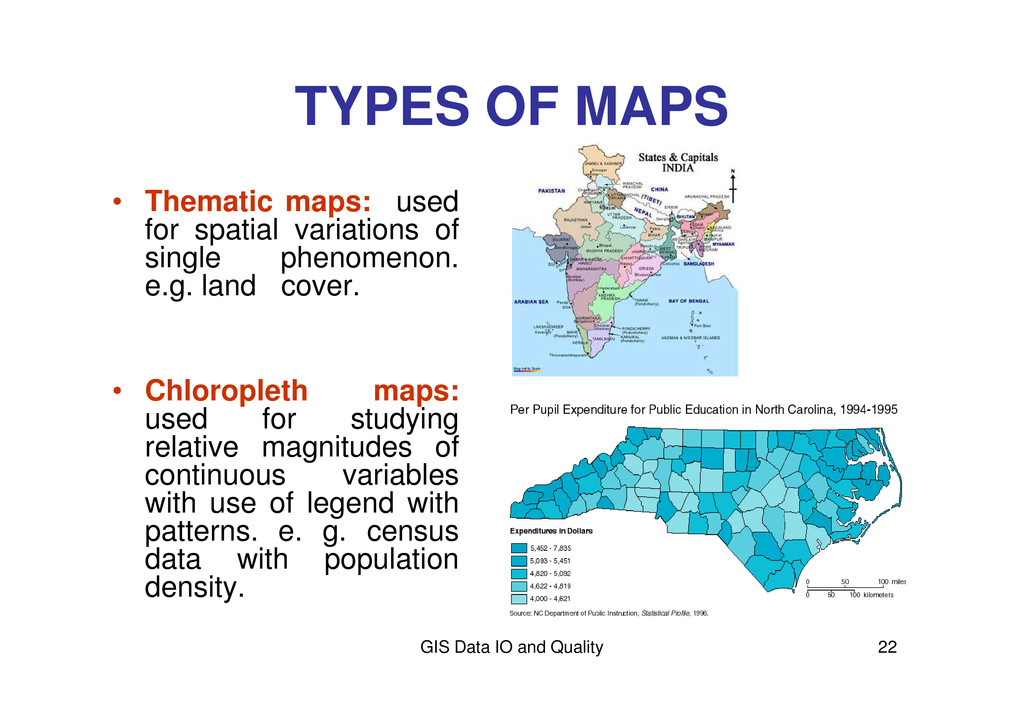
of single phenomenon. e.g. land cover. GIS Data IO and Quality 22 • Chloropleth maps: used for studying relative magnitudes of continuous variables with use of legend with patterns. e. g. census data with population density.
(DTM). • Cartogram maps : used for data display of TYPES OF MAPS (contd…) for data display of focused subdivision / class. • Animated maps : display chronological sequences. e.g. change in weather in a state. GIS Data IO and Quality 23
measurement of orientation of any feature within the co-ordinate system or set of axes. Projection used : GIS Data IO and Quality 24 Projection used : • Transforming, three-dimensional space onto a two dimensional map is called "projection". This process inevitably distorts at least one of the following properties: • Shape, Area, Distance • E.g. Lambert conical orthomorphic projection is used for India.
is important because it directly affects the scale of the map. e.g.: Road networks, etc. Cities, dams MAP DESIGN ELEMENTS Road networks, etc. Cities, dams • Level of generalization • Semiotics and Annotations used GIS Data IO and Quality 25
by GIS are known as Map Algebra. The classes are as follows: • Reclassification : Transformation of attribute information w.r.t single map coverage, • Overlay: Combination of two or more maps 26 • Overlay: Combination of two or more maps according to Boolean conditions, • Distance & Connectivity : Simple measurement of inter point distance & zones, • Neighborhood Characterization : Values to location both summary and mean of variable.
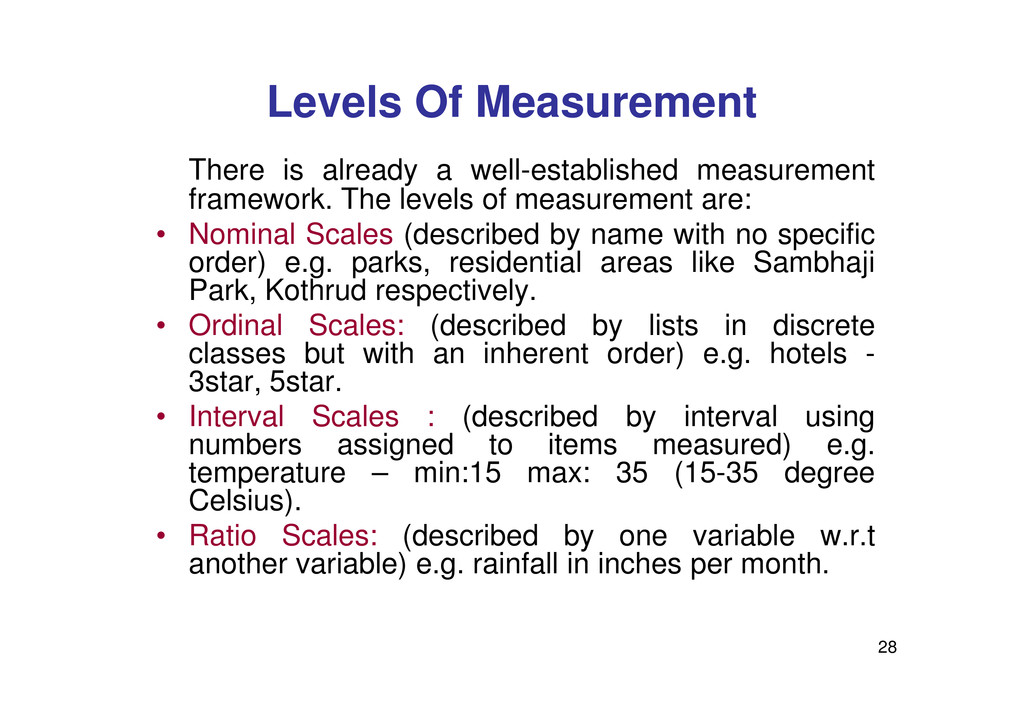
The levels of measurement are: • Nominal Scales (described by name with no specific order) e.g. parks, residential areas like Sambhaji Park, Kothrud respectively. • Ordinal Scales: (described by lists in discrete classes but with an inherent order) e.g. hotels - 28 classes but with an inherent order) e.g. hotels - 3star, 5star. • Interval Scales : (described by interval using numbers assigned to items measured) e.g. temperature – min:15 max: 35 (15-35 degree Celsius). • Ratio Scales: (described by one variable w.r.t another variable) e.g. rainfall in inches per month.


 abhijitmunde
 nikkihalliwell
 marktimemedia
 portentint
 tmiket
 lfama
lfama
 aleyda
 elsirapls
 mfonobong
 denniskardys
 danielanewman