Upgrade to Pro — share decks privately, control downloads, hide ads and more …

VMOT Pitchdeck as of 3/31/2024

Sponsored · Your Podcast. Everywhere. Effortlessly. Share. Educate. Inspire. Entertain. You do you. We'll handle the rest.
Avatar for Alex Clark Alex Clark
April 16, 2024
74

VMOT Pitchdeck as of 3/31/2024

Avatar for Alex Clark

Alex Clark

April 16, 2024
Tweet

Transcript

  1. ALPHA ARCHITECT VALUE MOMENTUM TREND ETF (VMOT) W e E

    m p o w e r I n v e s t o r s T h r o u g h E d u c a t i o n | A f f o r d a b l e A l p h a Wesley R. Gray, PhD T: +1.215.882.9983 F: +1.216.245.3686 [email protected] 19 East Eagle Road Havertown, PA 19083 As of Date: 3/31/2024
  2. 3 VMOT Component Details Component Goal VMOT QVAL IVAL QMOM

    IMOM Value Exposure Momentum Exposure U.S. Trend Exposure International Trend Exposure U.S. Exposure International Exposure VMOT is a multi-factor approach that incorporates our long-only ETFs and a trend-following strategy into one ETF VMOT seeks to deliver risk-managed global equity factor exposure
  3. 4 The Value Momentum Trend ETF Components Value Strategy QVAL

    ETF IVAL ETF Momentum Strategy QMOM ETF IMOM ETF 1 2 Trend Strategy Short US Market Short Int'l Market 3 Value Momentum Trend ETF (VMOT) Three components: Value equity; momentum equity; and a trend strategy to manage market exposure
  4. 5 Component #1: The Quantitative Value ETFs 1This example is

    provided for illustration purposes only. The actual numbers will vary for QVAL/IVAL. Value Strategy QVAL ETF IVAL ETF Momentum Strategy QMOM ETF IMOM ETF 1 2 Trend Strategy Short US Market Short Int'l Market 3 Value Momentum Trend ETF (VMOT) The ETFs seek to buy the cheapest, highest quality value stocks1 • The QVAL universe consists of the largest 1500 stocks in the US market • The IVAL universe consists of the largest 1500 stocks in the developed international market 1 2 3 4 5 Identify Universe Remove Outliers Screen for Value Screen for Quality Invest with Conviction 1,500: Initial stock universe Financials/Illiquid are excluded; 1000: Identity Red Flags Remove flagged firms 100: Value Score Top EBIT/TEV 50: Quality Score Eliminate bottom 50% 50: Equal-weight portfolio Quarterly rebalance
  5. 6 1This example is provided for illustration purposes only. The

    actual numbers may vary for QMOM and IMOM. Value Strategy QVAL ETF IVAL ETF Momentum Strategy QMOM ETF IMOM ETF 1 2 Trend Strategy Short US Market Short Int'l Market 3 Value Momentum Trend ETF (VMOT) Component #2: The Quantitative Momentum ETFs The ETFs seeks to buy stocks with the highest quality momentum1 • The QMOM universe consists of the largest 1500 stocks in the US market • The IMOM universe consists of the largest 1500 stocks in the developed international market 1 2 3 4 5 Identify Universe Remove Outliers Momentum screen Momentum quality screen Invest with Conviction 1,500: Initial stock universe 100: Momentum Score Top 2-12 Momentum 50: Equal-weight portfolio Quarterly rebalance 1000: Identity Red Flags Remove flagged firms 50: Momentum Quality Score Eliminate bottom 50%
  6. 7 Component #3: Our Trend-Following Methodology Our Trend-Following Models may

    not work in all situations and could fail to achieve their objectives. VMOT will engage in hedging of its U.S./International portfolio by shorting a representative broad-based U.S./International securities index ETF when either one or both of the following conditions are met. First, VMOT will hedge if the U.S./International equity markets’ total return over a rolling twelve calendar month period is less than or equal to U.S. Treasury bill returns over the same period. Second, VMOT will hedge when the U.S./International equity markets’ twelve-month moving average exceeds current prices. There is a 50 percent weight to each rule. If both rules are triggered VMOT’s U.S./International equity portfolio will be fully hedged; if one rule is triggered VMOT’s U.S./International equity portfolio will be 50 percent hedged; and if no rules are triggered VMOT’s equity portfolio will have no hedge. Identify Asset Classes to Assess Assess Trend - Following Rules 1) US Equity 2) Int’l Equity Rule #1: Time Series Trend Following Rule #2: Moving Average Trend Following 1 2 Determine Portfolio Hedging Posture BOTH RULES TRIGGERED 100% hedged ONE RULE TRIGGERED 50% hedged NO RULES TRIGGERED 0% hedged Value Strategy QVAL ETF IVAL ETF Momentum Strategy QMOM ETF IMOM ETF 1 2 Trend Strategy Short US Market Short Int'l Market 3 Value Momentum Trend ETF (VMOT)
  7. 8 Our Trend-Following Models may not work in all situations

    and could fail to achieve their objectives. VMOT will engage in hedging of its U.S./International portfolio by shorting a representative broad-based U.S./International securities index ETF when either one or both of the following conditions are met. First, VMOT will hedge if the U.S./International equity markets’ total return over a rolling twelve calendar month period is less than or equal to U.S. Treasury bill returns over the same period. Second, VMOT will hedge when the U.S./International equity markets’ twelve-month moving average exceeds current prices. There is a 50 percent weight to each rule. If both rules are triggered VMOT’s U.S./International equity portfolio will be fully hedged; if one rule is triggered VMOT’s U.S./International equity portfolio will be 50 percent hedged; and if no rules are triggered VMOT’s equity portfolio will have no hedge. Identify Asset Class Hedging Status Possible Hedging Postures Value Strategy QVAL ETF IVAL ETF Momentum Strategy QMOM ETF IMOM ETF 1 2 Trend Strategy Short US Market Short Int'l Market 3 Value Momentum Trend ETF (VMOT) 100% US Equity 100% US Equity Partial Hedge 100% US Equity Full Hedge Long Partial Hedge Full Hedge 100% Int'l Equity 100% Int'l Equity Partial Hedge 100% Int'l Equity Full Hedge Long Partial Hedge Full Hedge Determine US Market Hedge Determine International Market Hedge US Status Int’l Status More Details on Our Trend-Following Methodology (i.e., Component #3)
  8. 9 Putting it all Together: The Value Momentum Trend ETF

    1This example is provided for illustration purposes only. Our trend-following models may not work in all situations and could fail to achieve their objectives. 1 2 3 4 5 Identify QVAL, IVAL, QMOM, IMOM, Weights Determine US Equity Hedge Determine Int’l Equity Hedge Deploy Portfolio Hedges Invest with Conviction Global Value and Momentum Relative Strength Weighted Moving Average / Time Series No Hedge/Partial Hedge/Full Hedge Moving Average / Time Series No Hedge/Partial Hedge/Full Hedge Establish Short Positions in Broad Market Exposures (e.g. S&P 500 and/or MSCI EAFE) ~200 Global Stocks & Hedges Monthly rebalance The VMOT ETF seeks to provide an alternative equity exposure1 • Fund of Fund structure: Invests in QVAL, IVAL, QMOM, and IMOM Indexes • Determines market exposure via the Robust Trend-Following Methodology Value Strategy QVAL ETF IVAL ETF Momentum Strategy QMOM ETF IMOM ETF 1 2 Trend Strategy Short US Market Short Int'l Market 3 Value Momentum Trend ETF (VMOT)
  9. 11 VMOT Seeks to be Unique Relative to a Broad

    Global Index Underlying data are from FactSet. Active share is the percentage of a portfolio’s stock holdings that differ from its benchmark index. Active share is based on the weightings of securities in a portfolio compared with those of its benchmark and can be used as a measure of the degree of a portfolio’s active management. Short positions and cash positions are excluded from the calculation. See Cremers, K. J. Martijn, and Antti Petajisto, 2009, “How active is your fund manager? A new measure that predicts performance,” Review of Financial Studies 22, 3329-3365 for more information. VMOT active share is calculated relative to the iShares MSCI World ETF (ticker: URTH), which seeks to track the MSCI World Index. Unique Focused
  10. 12 VMOT Characteristics The ETFs seek to own smaller, cheaper,

    and higher momentum stocks Underlying data are from FactSet. Fund characteristics are weighted averages by security weight and derived by Alpha Architect. Market capitalization is defined as the total market value of the company’s listed equity in billions. Value is defined as net income divided by price (inverted to create price/earnings). Quality is defined as net income divided by total assets. Momentum is defined as the cumulative total return for the past 12 months, excluding the most recent month. Momentum is a characteristic of the underlying holdings and should not be construed as fund or index performance. The MSCI World Index benchmark holdings data are derived from the iShares MSCI World ETF (ticker: URTH), which seeks to track the MSCI World Index. Small Quality Cheap Momentum
  11. 13 VMOT’s Long Positions: Visual Active Share VMOT is concentrated

    in global value and momentum stocks Source: Data are from FactSet. Holdings’ characteristics are only displayed if they are held in the benchmark index (i.e., MSCI World Index). Benchmark holdings data are derived from the URTH ETF. EBIT/TEV is defined as earnings before interest and taxes divided by total enterprise value. Momentum is defined as the cumulative total return for the past 12 months, excluding the most recent month. Holdings characteristic percentiles are calculated relative to the benchmark universe. Momentum is a characteristic of the underlying holdings and should not be construed as fund or index performance. Expensive  EBIT/TEV Percentile → Cheap Losers  Momentum Percentile → Winners
  12. 15 VMOT Recent Market Exposure (% of Net Asset Value)

    The exposures above are calculated as follows: VMOT US NET is equal to the sum of the market values of the QVAL, QMOM, and US hedge holdings divided by the Net Asset Value of the Fund. VMOT INT’L NET is equal to the sum of the market values of the IVAL, IMOM, and International hedge holdings divided by the Net Asset Value of the Fund. The most recent 252 trading days are included in the chart. Market price is the price at which shares in the ETF can be bought or sold on the exchanges during trading hours, while the net asset value (NAV) represents the value of each share’s portion of the fund’s underlying assets and cash at the end of the trading day.
  13. 17 VMOT Performance Update (As of Date: 3/31/2020) Standardized Performance

    (As of 3/31/2024) ETF Name ETF Ticker Gross Expense Ratio Net Expense Ratio Net Expense Ratio, Excluding expenses on Securities Sold Short ETF Inception Date Return Type 3 Month 1 Year 3 Year 5 year Since Inception Global Value Momentum Trend ETF VMOT 1.60% 1.38% 0.69% 5/3/2017 MKT 10.65% 15.69% 0.67% 2.50% 1.95% NAV 10.83% 15.88% 0.79% 2.59% 1.99% U.S Quantitative Value ETF QVAL 0.29% 0.29% 0.29% 10/22/2014 MKT 11.35% 35.17% 13.34% 11.49% 8.14% NAV 11.49% 35.13% 13.44% 11.49% 8.14% U.S Quantitative Momentum ETF QMOM 0.29% 0.29% 0.29% 12/02/2015 MKT 18.56% 32.28% 5.10% 15.57% 11.33% NAV 18.46% 31.98% 4.90% 15.52% 11.30% International Quantitative Value ETF IVAL 0.39% 0.39% 0.39% 12/17/2014 MKT 8.33% 21.04% 3.59% 3.73% 4.22% NAV 7.35% 21.08% 3.63% 3.68% 4.15% International Quantitative Momentum ETF IMOM 0.39% 0.39% 0.39% 12/23/2015 MKT 10.62% 13.58% -1.43% 5.02% 3.70% NAV 10.58% 14.34% -1.38% 5.10% 3.70% Returns are average annualized total returns, except those for periods of less than one year, which are cumulative. The performance data quoted represents past performance and does not guarantee future results. Investment return and principal value of an investment will fluctuate so that an investor’s shares, when sold or redeemed, may be worth more or less than their original cost. Current performance may be higher or lower than the performance quoted. For performance data current to the most recent month end, please call 215.882.9983 or visit www.alphaarchitect.com/funds. Market price is the price at which shares in the ETF can be bought or sold on the exchanges during trading hours, while the net asset value (NAV) represents the value of each share’s portion of the fund’s underlying assets and cash at the end of the trading day. The net expense ratio is applicable to investors. The adviser has contractually agreed to waive fees until at least 1/31/25.
  14. 18 QVAL, QMOM, IMOM, IVAL are actual holdings of the

    fund. SPY and EFA are included in the analysis because they reflect the actual holdings of the fund during hedging events and are not included for comparative purposes. The cumulative performance chart reflects a hypothetical investment and assumes reinvestment of dividends and capital gains. Fund expenses, including management fees and other expenses were deducted. The performance quoted represents past performance and does not guarantee future results. Investment return and principal value of an investment will fluctuate so that an investor’s shares, when sold or redeemed, may be worth more or less than the original cost. Current performance may be lower or higher than the performance quoted, and numbers may reflect small variances due to rounding. Standardized performance and performance data current to the most recent quarter end may be found in the previous section. All returns are based on market prices. Market price is the price at which shares in the ETF can be bought or sold on the exchanges during trading hours, while the net asset value (NAV) represents the value of each share’s portion of the fund’s underlying assets and cash at the end of the trading day. The blue overlay indicates when VMOT was hedged during the period shown (March 2020). VMOT No Hedge (5/3/2017 to 6/30/2018) VMOT Hedged (1/1/2020 to 3/31/2020) QVAL: 22.90% QMOM: 22.40% VMOT: 17.32% SPY: 16.44% IMOM: 14.34% EFA: 9.19% IVAL: 9.00% VMOT: -17.17% SPY: -19.43% QMOM: -19.66% EFA: -23.01% IMOM: -23.15% IVAL: -28.95% QVAL: -40.23% VMOT Performance During a Non-Hedged and a Hedged Time Period
  15. CONTACT US TO LEARN MORE Wesley R. Gray, PhD T:

    +1.215.882.9983 F: +1.216.245.3686 [email protected] 213 Foxcroft Road Broomall, PA 19008 W e E m p o w e r I n v e s t o r s T h r o u g h E d u c a t i o n | A f f o r d a b l e A l p h a
  16. 20 IMPORTANT INFORMATION - DISCLOSURES Investments involve risk. Principal loss

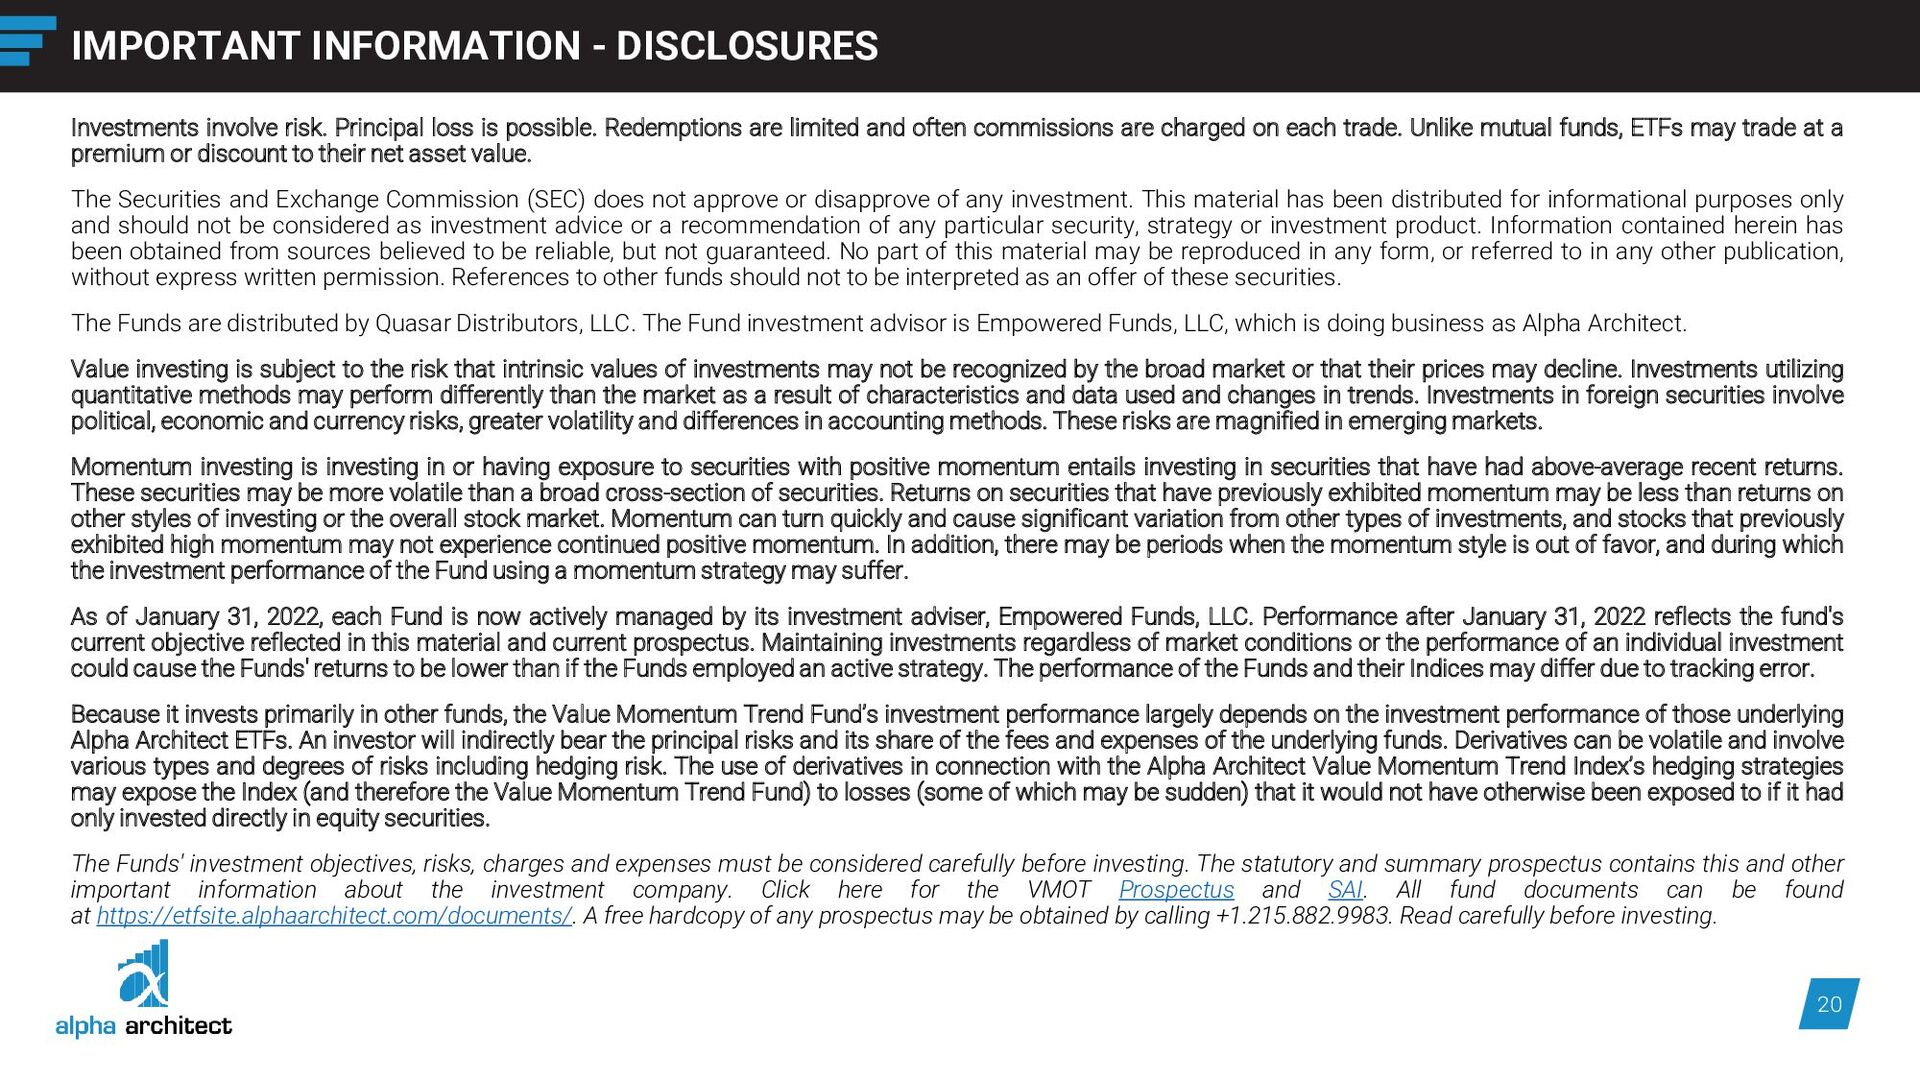
    is possible. Redemptions are limited and often commissions are charged on each trade. Unlike mutual funds, ETFs may trade at a premium or discount to their net asset value. The Securities and Exchange Commission (SEC) does not approve or disapprove of any investment. This material has been distributed for informational purposes only and should not be considered as investment advice or a recommendation of any particular security, strategy or investment product. Information contained herein has been obtained from sources believed to be reliable, but not guaranteed. No part of this material may be reproduced in any form, or referred to in any other publication, without express written permission. References to other funds should not to be interpreted as an offer of these securities. The Funds are distributed by Quasar Distributors, LLC. The Fund investment advisor is Empowered Funds, LLC, which is doing business as Alpha Architect. Value investing is subject to the risk that intrinsic values of investments may not be recognized by the broad market or that their prices may decline. Investments utilizing quantitative methods may perform differently than the market as a result of characteristics and data used and changes in trends. Investments in foreign securities involve political, economic and currency risks, greater volatility and differences in accounting methods. These risks are magnified in emerging markets. Momentum investing is investing in or having exposure to securities with positive momentum entails investing in securities that have had above-average recent returns. These securities may be more volatile than a broad cross-section of securities. Returns on securities that have previously exhibited momentum may be less than returns on other styles of investing or the overall stock market. Momentum can turn quickly and cause significant variation from other types of investments, and stocks that previously exhibited high momentum may not experience continued positive momentum. In addition, there may be periods when the momentum style is out of favor, and during which the investment performance of the Fund using a momentum strategy may suffer. As of January 31, 2022, each Fund is now actively managed by its investment adviser, Empowered Funds, LLC. Performance after January 31, 2022 reflects the fund's current objective reflected in this material and current prospectus. Maintaining investments regardless of market conditions or the performance of an individual investment could cause the Funds' returns to be lower than if the Funds employed an active strategy. The performance of the Funds and their Indices may differ due to tracking error. Because it invests primarily in other funds, the Value Momentum Trend Fund’s investment performance largely depends on the investment performance of those underlying Alpha Architect ETFs. An investor will indirectly bear the principal risks and its share of the fees and expenses of the underlying funds. Derivatives can be volatile and involve various types and degrees of risks including hedging risk. The use of derivatives in connection with the Alpha Architect Value Momentum Trend Index’s hedging strategies may expose the Index (and therefore the Value Momentum Trend Fund) to losses (some of which may be sudden) that it would not have otherwise been exposed to if it had only invested directly in equity securities. The Funds' investment objectives, risks, charges and expenses must be considered carefully before investing. The statutory and summary prospectus contains this and other important information about the investment company. Click here for the VMOT Prospectus and SAI. All fund documents can be found at https://etfsite.alphaarchitect.com/documents/. A free hardcopy of any prospectus may be obtained by calling +1.215.882.9983. Read carefully before investing.
  17. 21 ▪ Underlying data are from FactSet. Fund characteristics are

    weighted averages by security weight and derived by Alpha Architect. ▪ Size is market capitalization which is defined as the total market value of the company’s listed equity in millions. ▪ Value is price to earnings which is defined as price divided by net income. ▪ EBIT/TEV is defined as earnings before interest and taxes divided by total enterprise value. ▪ Active share is the percentage of a portfolio’s stock holdings that differ from its benchmark index. It is based on the weightings of securities in a portfolio compared with those of its benchmark and can be used as a measure of the degree of a portfolio’s active management. See Cremers, K. J. Martijn, and Antti Petajisto, 2009, “How active is your fund manager? A new measure that predicts performance,” Review of Financial Studies 22, 3329-3365 for more information. ▪ Momentum (2-12) is defined as the cumulative total return for the past 12 months, excluding the most recent month. ▪ Quality is return on assets which is defined as net income divided by total assets. ▪ The MSCI World Index is a capitalization-weighted index that measures the performance of developed market equities. Indexes are unmanaged, do not reflect management or trading fees, and one cannot invest directly in an index. ▪ The S&P 500 Index (SP500) is a capitalization-weighted index that measures the performance of the broad U.S. equity market. Indexes are unmanaged, do not reflect management or trading fees, and one cannot invest directly in an index. ▪ The MSCI EAFE Index (EAFE) is a capitalization-weighted index that measures the performance of developed market equities, excluding the U.S. and Canada. Indexes are unmanaged, do not reflect management or trading fees, and one cannot invest directly in an index. ▪ The Bloomberg Barclays 3 Month T-Bill (RF) seeks to provide exposure to zero coupon U.S. Treasury securities that have a remaining maturity of 1-3 months. Indexes are unmanaged, do not reflect management or trading fees, and one cannot invest directly in an index. ▪ Unless otherwise noted, all data is assigned the as of date stated on the first page of this presentation. IMPORTANT INFORMATION - DISCLOSURES