Upgrade to Pro — share decks privately, control downloads, hide ads and more …

Monitoring in a distributed world

Monitoring in a distributed world

The IT infrastructure for distributed applications is getting bigger and more complex every day. Through this, the pure mass of observed events is growing. To be able to ensure a safe IT operation, we also need a distributed and scalable monitoring architecture to evaluate these events. This session wants to show how to build an architecture upon open source software.
Starting with some basics on monitoring IT infrastructure and applications, we will have a look on some of the key words like monitoring, alerting, diagnostic and reporting. Based on this, we will start to build up a monitoring architecture.
We will elaborate on and integrate the following modules: log file shipping and analysis (logstash), system monitoring (collectD), event storage (elasticsearch), metric generator and storage (statsd and graphite) as well as different dashboards (grafana, seyren, kibana).

Avatar for Felix Massem

Felix Massem

May 03, 2016

More Decks by Felix Massem

Other Decks in Programming

Transcript

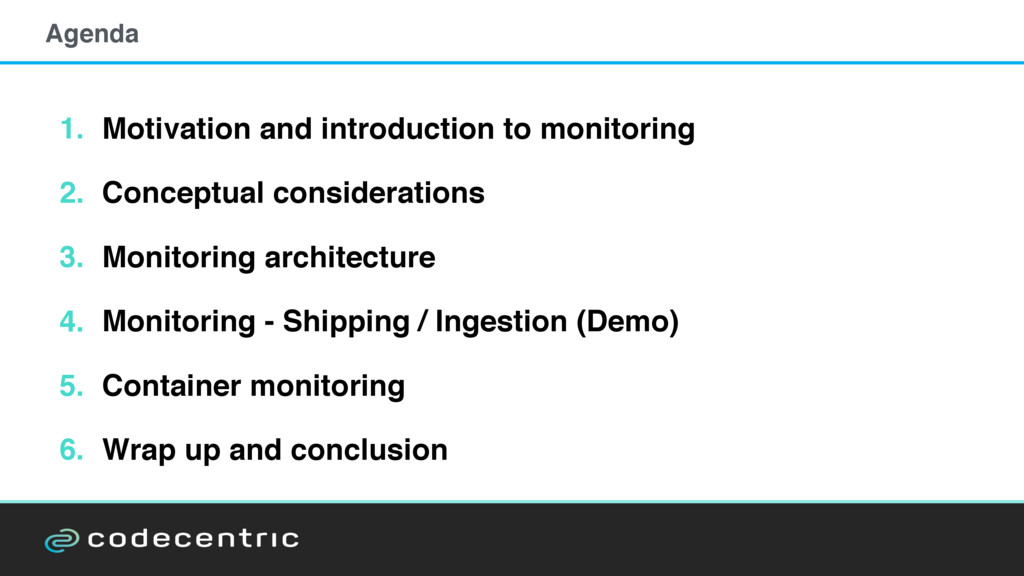
  1. Agenda 1. Motivation and introduction to monitoring
 2. Conceptual considerations


    3. Monitoring architecture
 4. Monitoring - Shipping / Ingestion (Demo)
 5. Container monitoring 6. Wrap up and conclusion
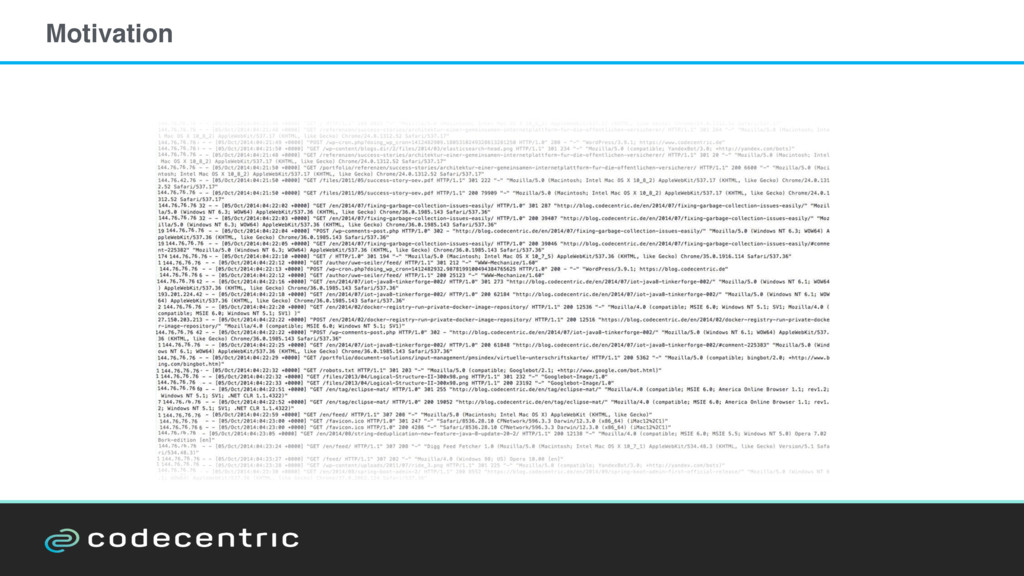
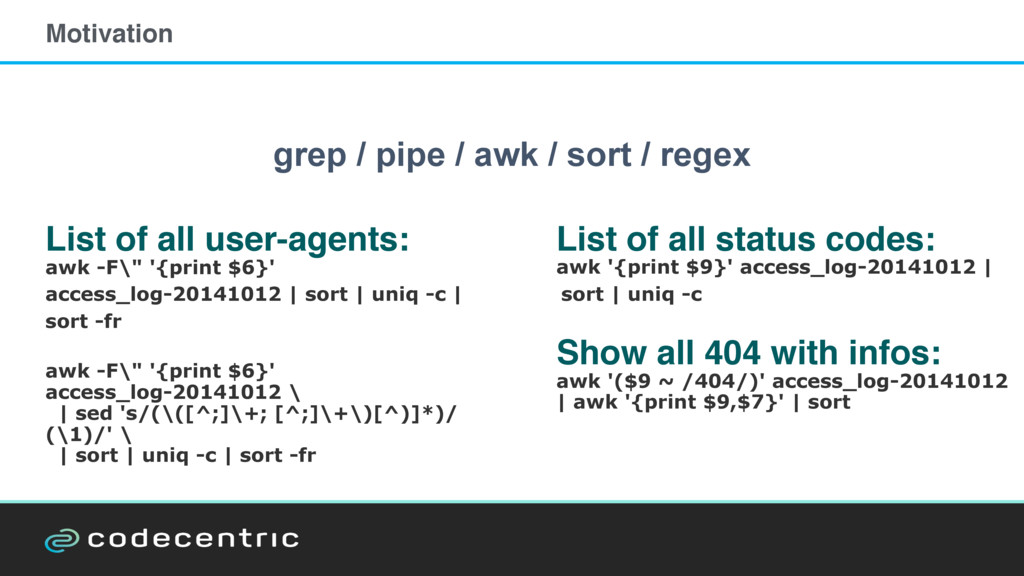
  2. List of all user-agents: awk -F\" '{print $6}' access_log-20141012 |

    sort | uniq -c | sort -fr awk -F\" '{print $6}' access_log-20141012 \
 | sed 's/(\([^;]\+; [^;]\+\)[^)]*)/ (\1)/' \
 | sort | uniq -c | sort -fr List of all status codes: awk '{print $9}' access_log-20141012 | sort | uniq -c Show all 404 with infos: awk '($9 ~ /404/)' access_log-20141012 | awk '{print $9,$7}' | sort grep / pipe / awk / sort / regex Motivation
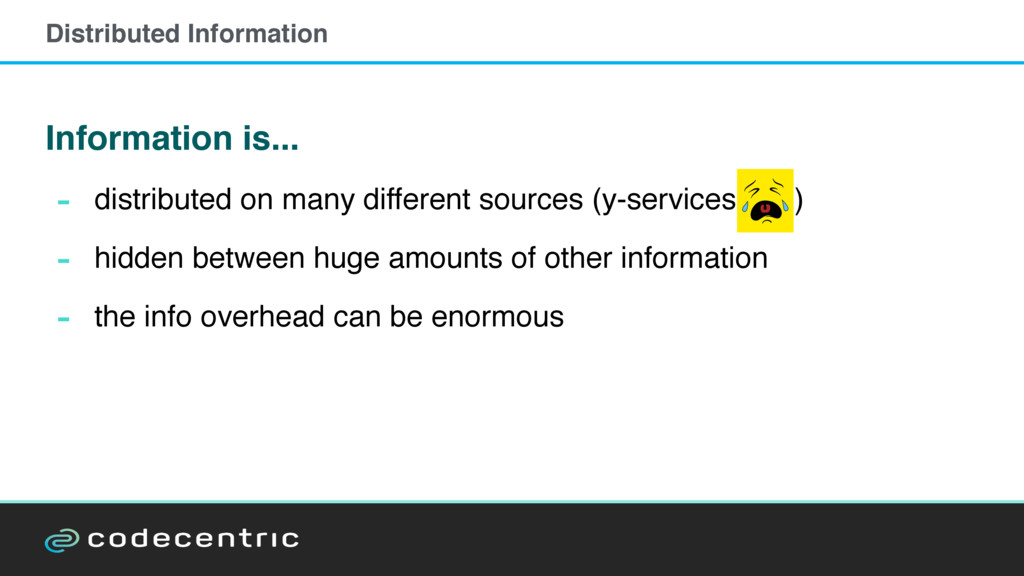
  3. Information is... - distributed on many different sources (y-services )

    - hidden between huge amounts of other information - the info overhead can be enormous Distributed Information
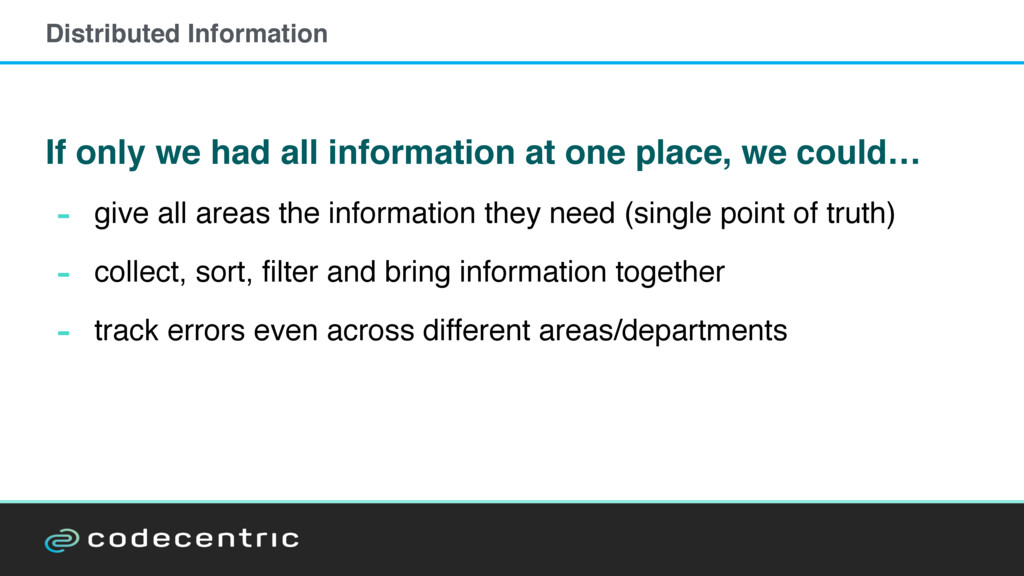
  4. If only we had all information at one place, we

    could… - give all areas the information they need (single point of truth) - collect, sort, filter and bring information together - track errors even across different areas/departments Distributed Information
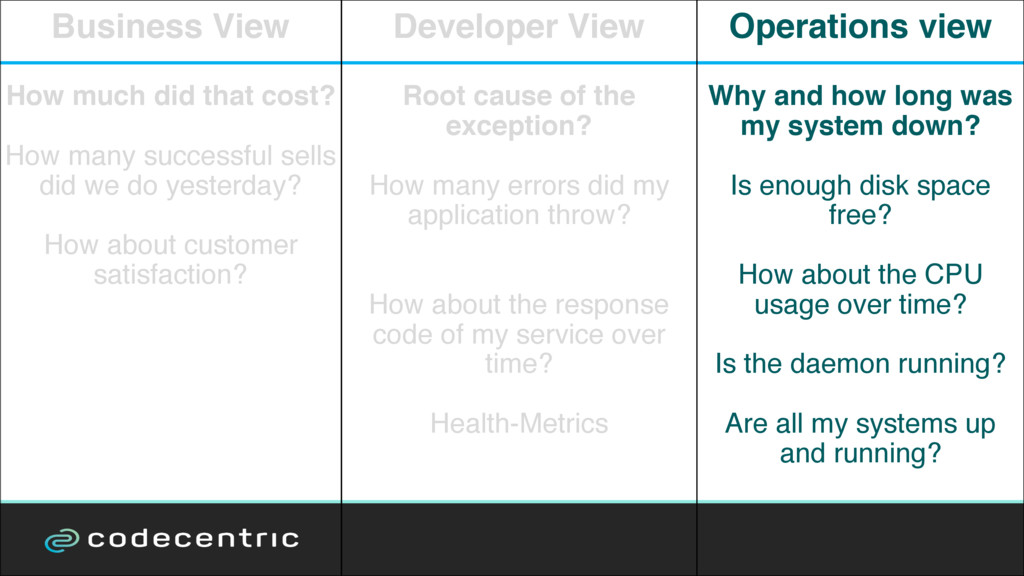
  5. Business View How much did that cost? How many successful

    sells did we do yesterday? How about customer satisfaction? Developer View Root cause of the exception? How many errors did my application throw? How about the response code of my service over time? Health-Metrics Operations view Why and how long was my system down?
 Is enough disk space free?
 How about the CPU usage over time?
 Is the daemon running?
 Are all my systems up and running?
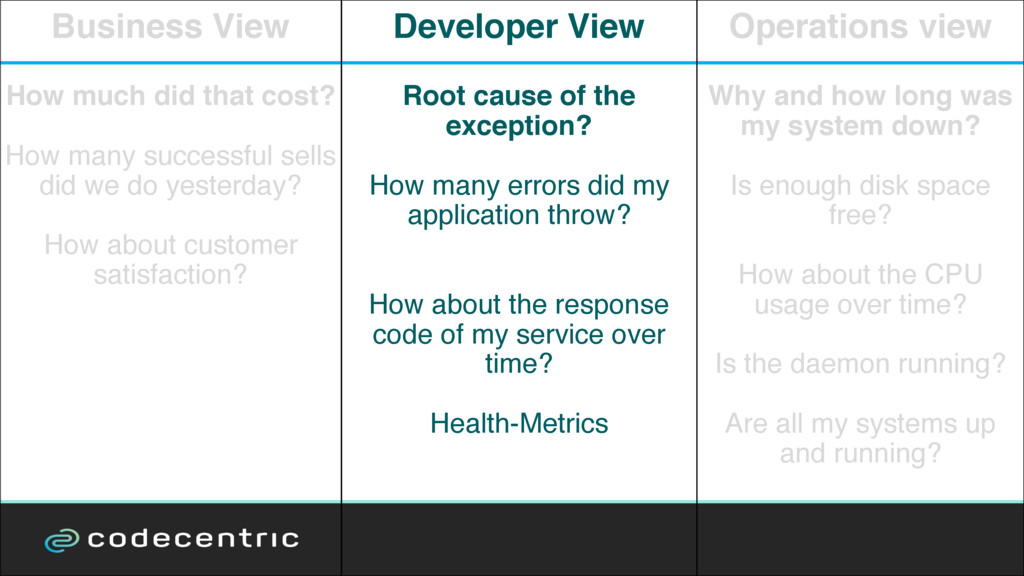
  6. Business View How much did that cost? How many successful

    sells did we do yesterday? How about customer satisfaction? Developer View Root cause of the exception? How many errors did my application throw? How about the response code of my service over time? Health-Metrics Operations view Why and how long was my system down?
 Is enough disk space free?
 How about the CPU usage over time?
 Is the daemon running?
 Are all my systems up and running?
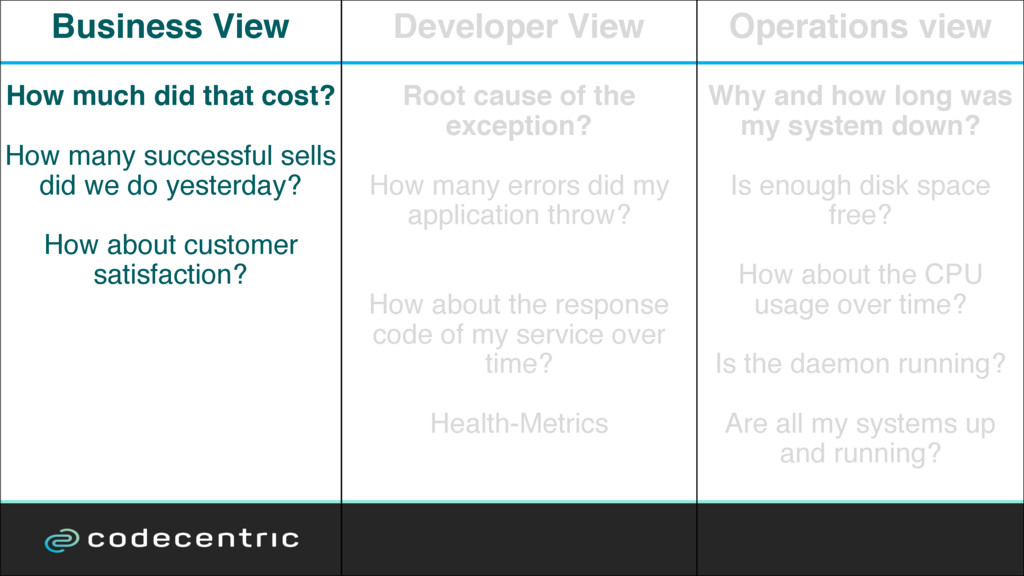
  7. Business View How much did that cost? How many successful

    sells did we do yesterday? How about customer satisfaction? Developer View Root cause of the exception? How many errors did my application throw? How about the response code of my service over time? Health-Metrics Operations view Why and how long was my system down?
 Is enough disk space free?
 How about the CPU usage over time?
 Is the daemon running?
 Are all my systems up and running?
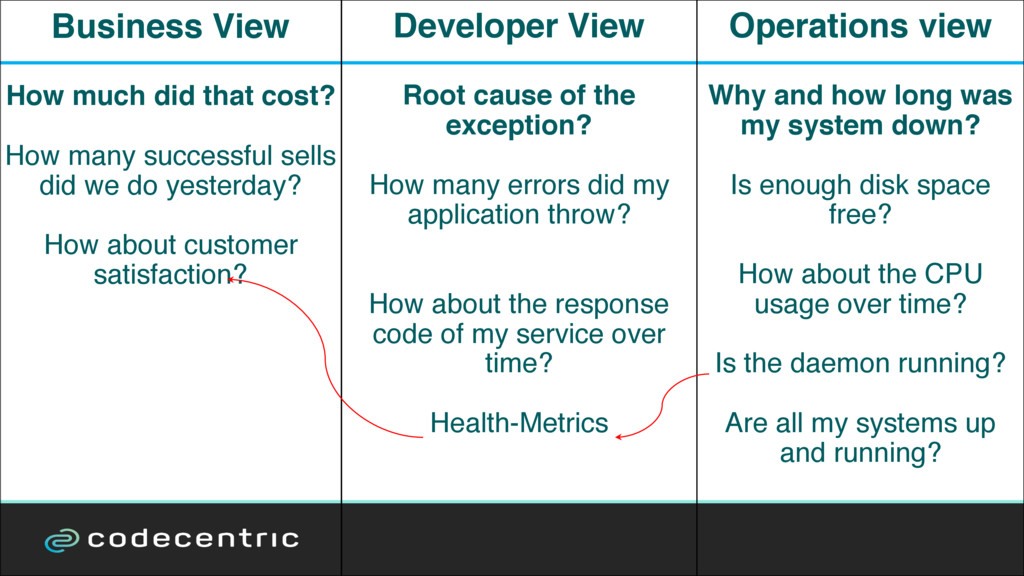
  8. Business View How much did that cost? How many successful

    sells did we do yesterday? How about customer satisfaction? Operations view Why and how long was my system down?
 Is enough disk space free?
 How about the CPU usage over time?
 Is the daemon running?
 Are all my systems up and running? Developer View Root cause of the exception? How many errors did my application throw? How about the response code of my service over time? Health-Metrics
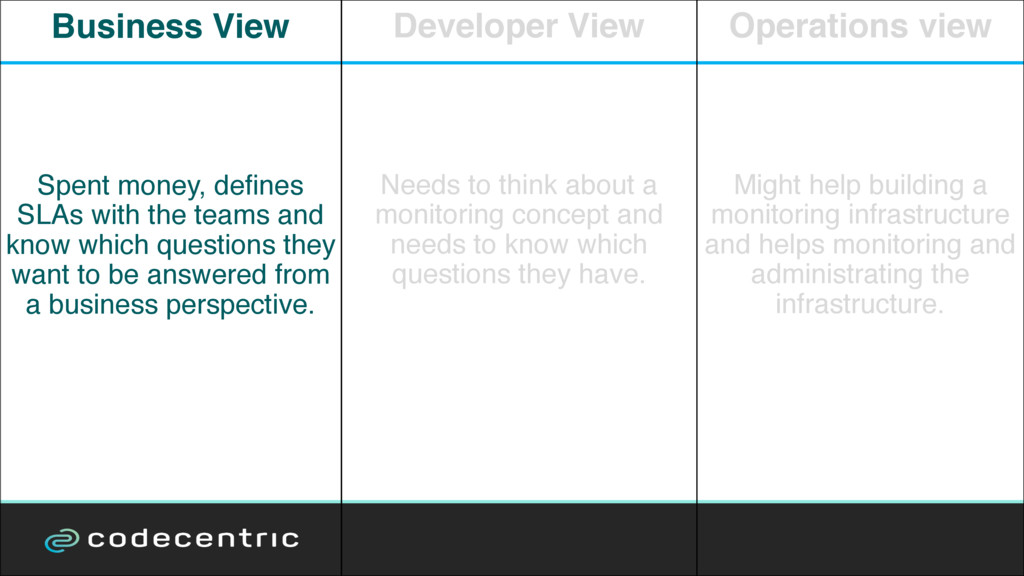
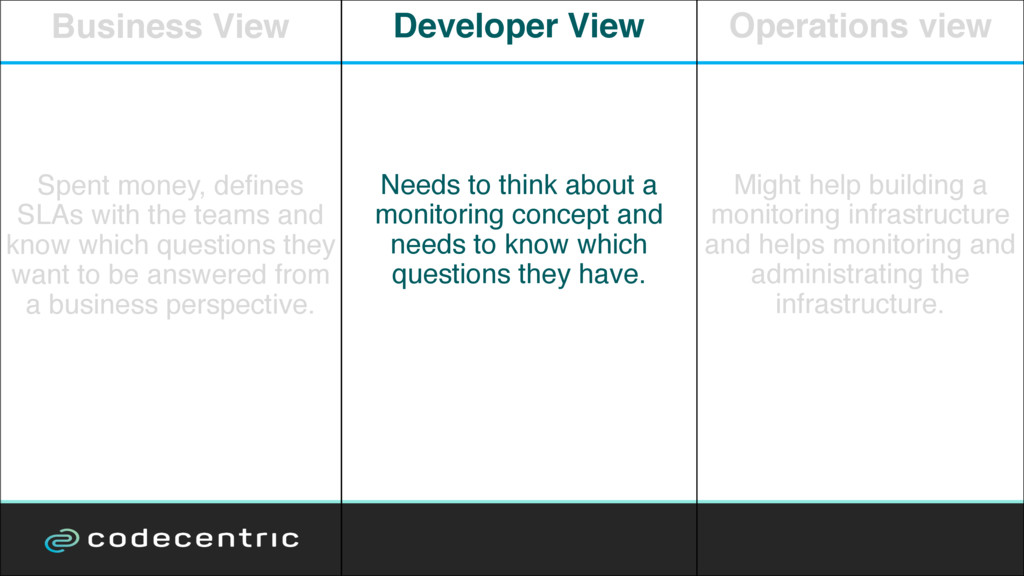
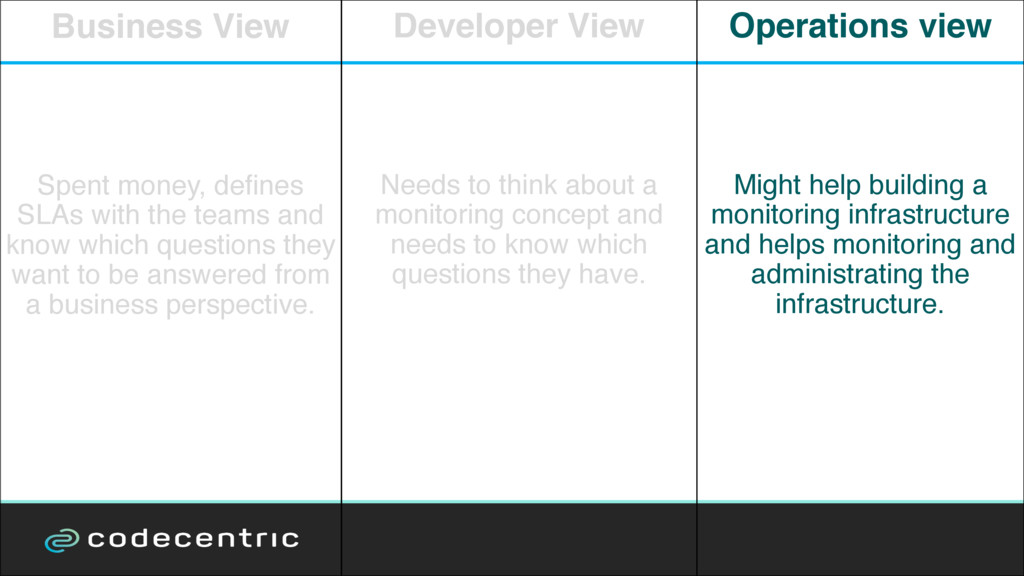
  9. Business View Spent money, defines SLAs with the teams and
    know which questions they want to be answered from a business perspective. Operations view Might help building a monitoring infrastructure and helps monitoring and administrating the infrastructure. Developer View Needs to think about a monitoring concept and needs to know which questions they have.
  10. Business View Spent money, defines SLAs with the teams and
    know which questions they want to be answered from a business perspective. Operations view Might help building a monitoring infrastructure and helps monitoring and administrating the infrastructure. Developer View Needs to think about a monitoring concept and needs to know which questions they have.
  11. Business View Spent money, defines SLAs with the teams and

    know which questions they want to be answered from a business perspective. Operations view Might help building a monitoring infrastructure and helps monitoring and administrating the infrastructure. Developer View Needs to think about a monitoring concept and needs to know which questions they have.
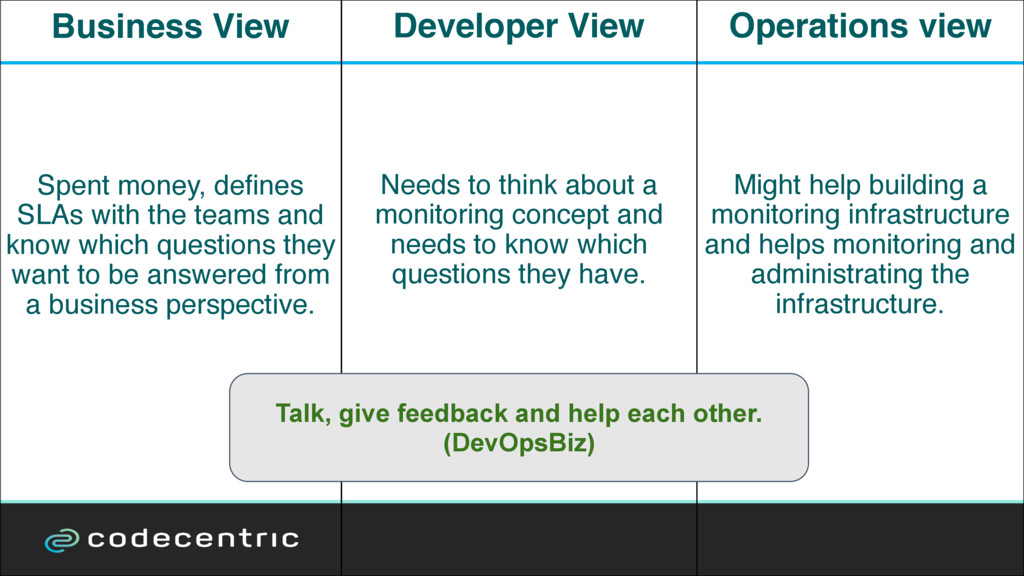
  12. Business View Spent money, defines SLAs with the teams and

    know which questions they want to be answered from a business perspective. Operations view Might help building a monitoring infrastructure and helps monitoring and administrating the infrastructure. Developer View Needs to think about a monitoring concept and needs to know which questions they have. Talk, give feedback and help each other. (DevOpsBiz)
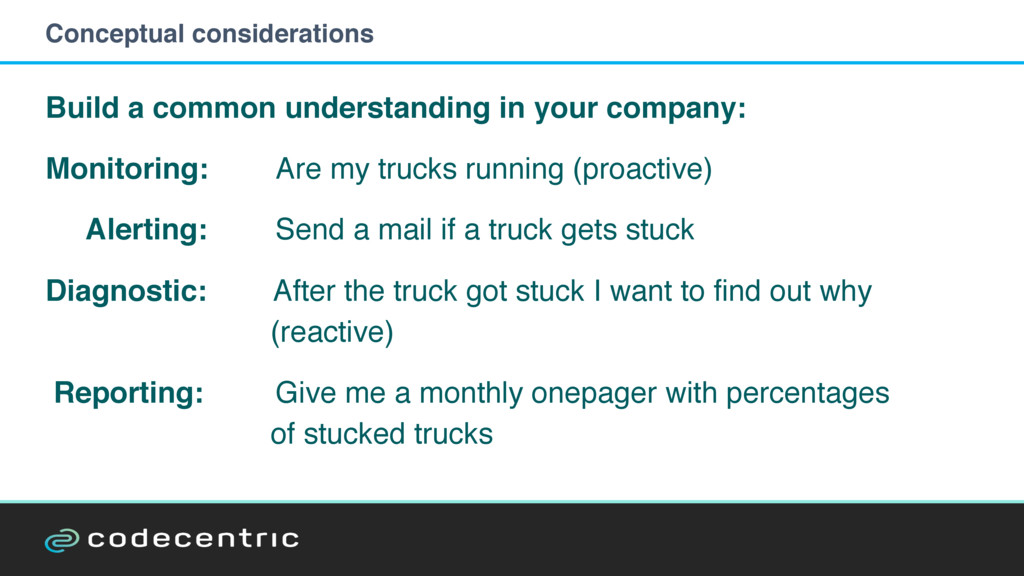
  13. Build a common understanding in your company: Monitoring: Are my

    trucks running (proactive) Alerting: Send a mail if a truck gets stuck Diagnostic: After the truck got stuck I want to find out why
 (reactive) Reporting: Give me a monthly onepager with percentages of stucked trucks Conceptual considerations
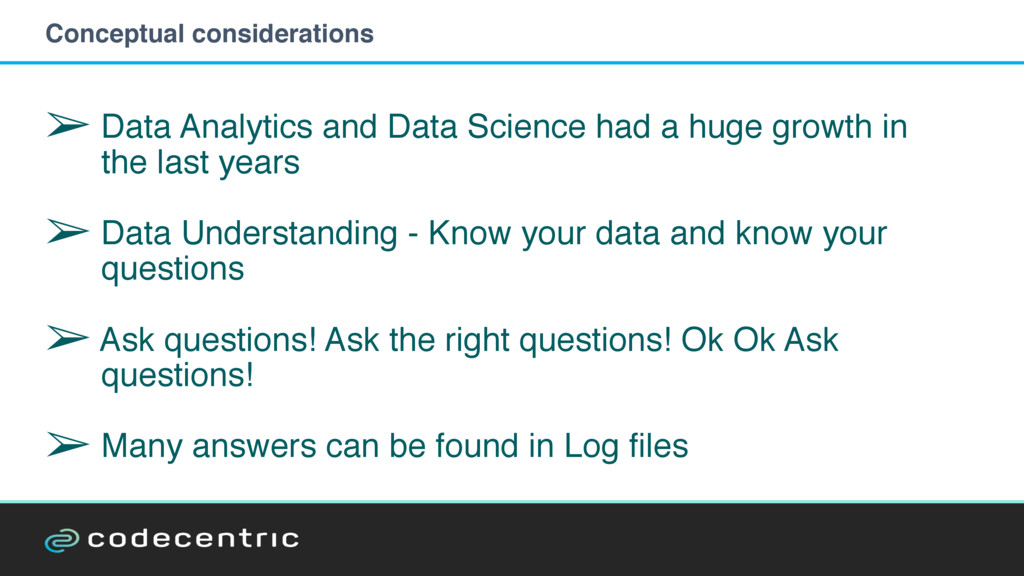
  14. ➢ Data Analytics and Data Science had a huge growth

    in 
 the last years ➢ Data Understanding - Know your data and know your 
 questions ➢ Ask questions! Ask the right questions! Ok Ok Ask 
 questions! ➢ Many answers can be found in Log files Conceptual considerations
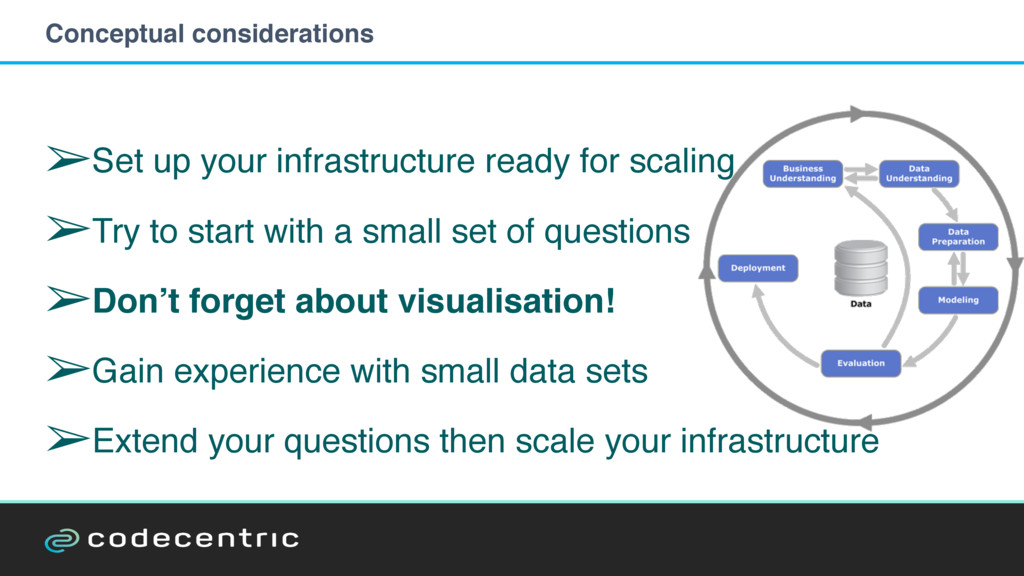
  15. ➢Set up your infrastructure ready for scaling ➢Try to start

    with a small set of questions ➢Don’t forget about visualisation! ➢Gain experience with small data sets ➢Extend your questions then scale your infrastructure Conceptual considerations
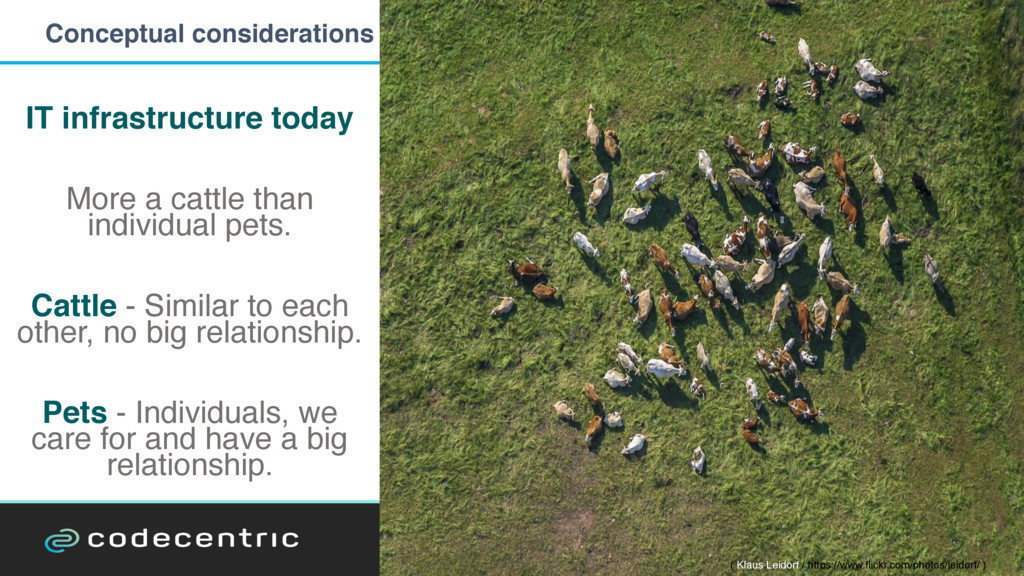
  16. IT infrastructure today More a cattle than individual pets. Cattle

    - Similar to each other, no big relationship. Pets - Individuals, we care for and have a big relationship. ( Klaus Leidorf / https://www.flickr.com/photos/leidorf/ ) Conceptual considerations
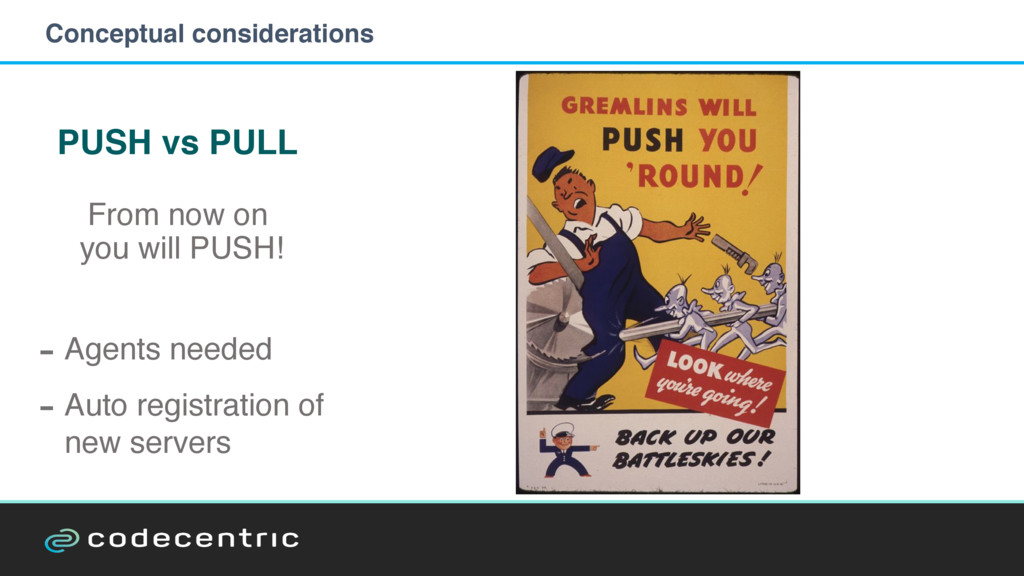
  17. PUSH vs PULL From now on you will PUSH! -

    Agents needed - Auto registration of new servers Conceptual considerations
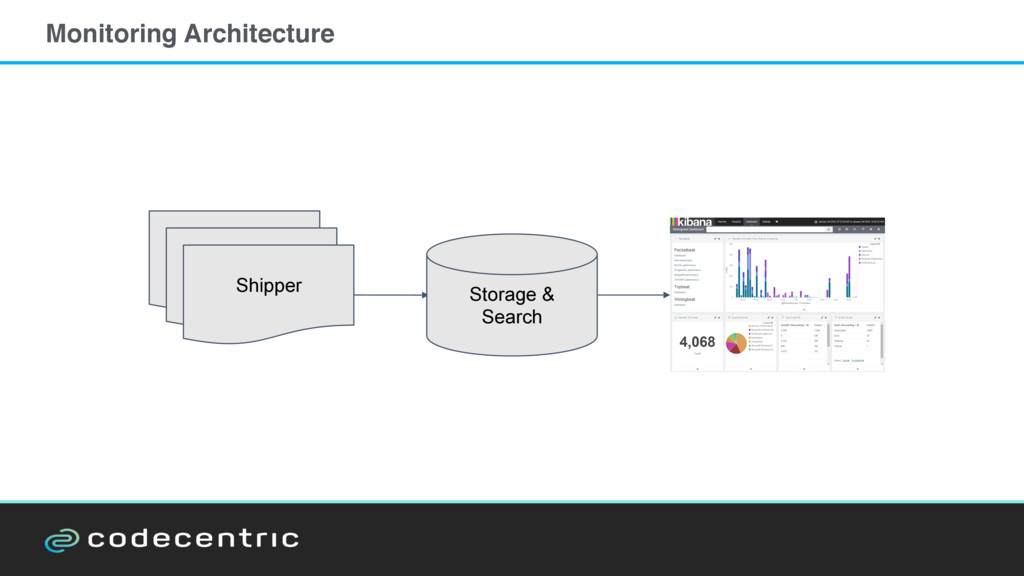
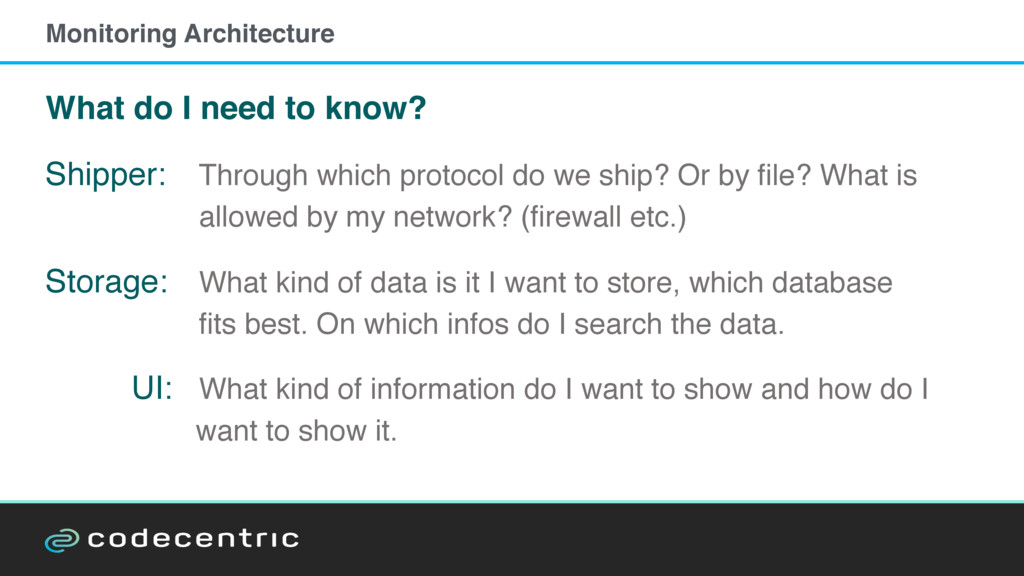
  18. What do I need to know? Shipper: Through which protocol

    do we ship? Or by file? What is 
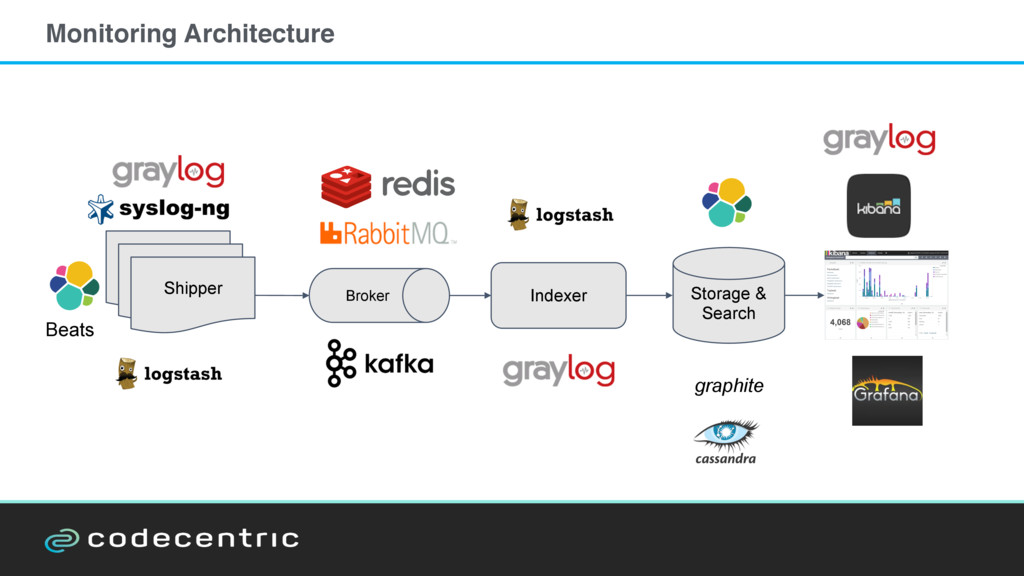
 allowed by my network? (firewall etc.) Storage: What kind of data is it I want to store, which database fits best. On which infos do I search the data. UI: What kind of information do I want to show and how do I want to show it. Monitoring Architecture
  19. Problems at that point? ! back pressure Ok then, let

    the scaling begin. http://media.salon.com/2009/12/why.jpg Monitoring Architecture
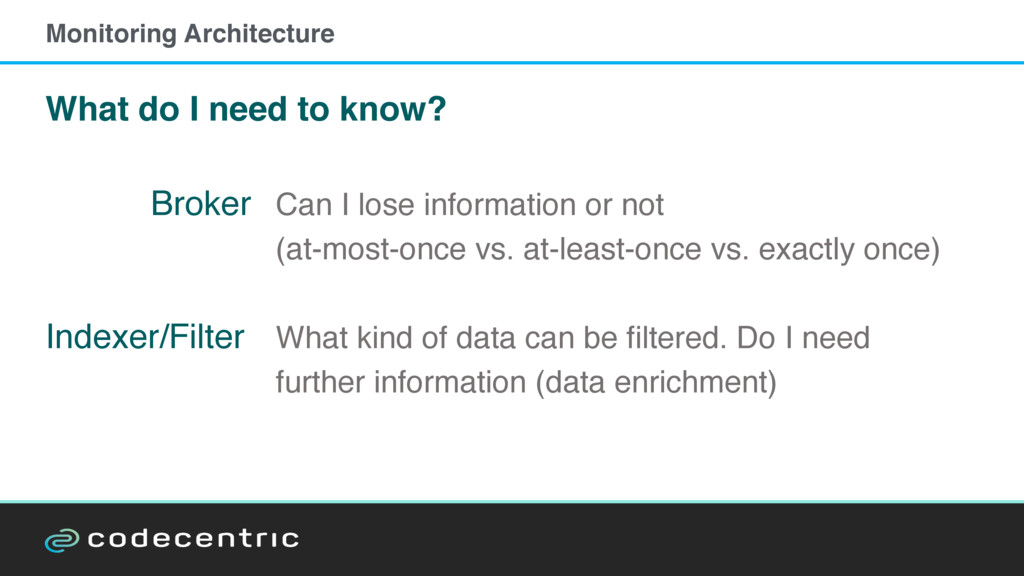
  20. What do I need to know? Broker Can I lose

    information or not (at-most-once vs. at-least-once vs. exactly once) Indexer/Filter What kind of data can be filtered. Do I need further information (data enrichment) Monitoring Architecture
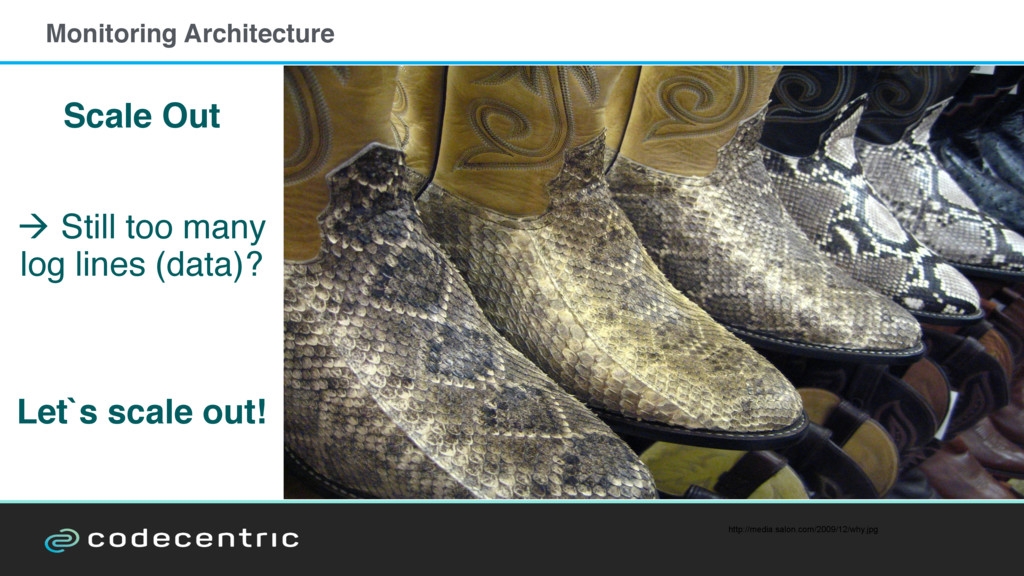
  21. Scale Out ! Still too many log lines (data)? Let`s

    scale out! http://media.salon.com/2009/12/why.jpg Monitoring Architecture
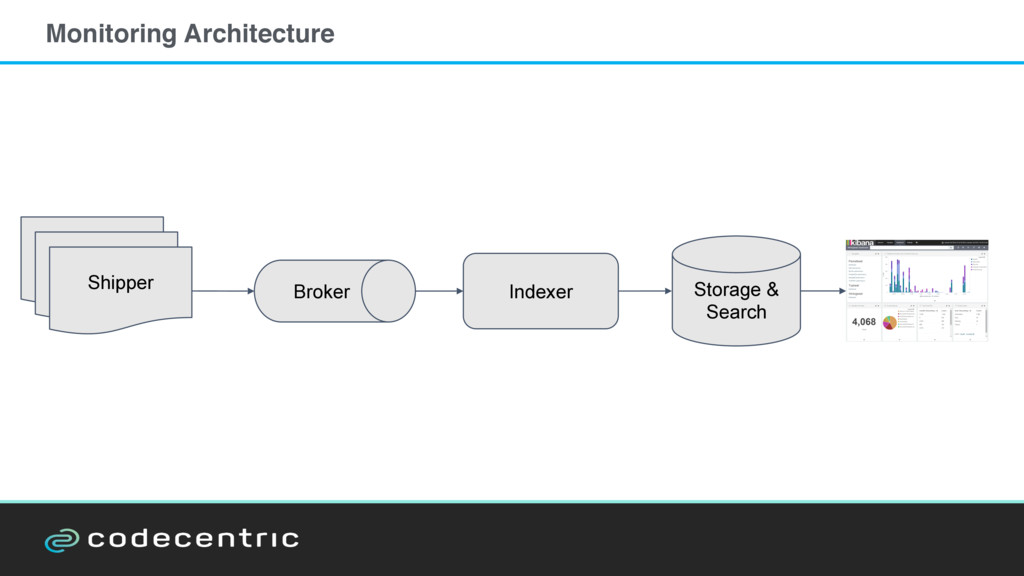
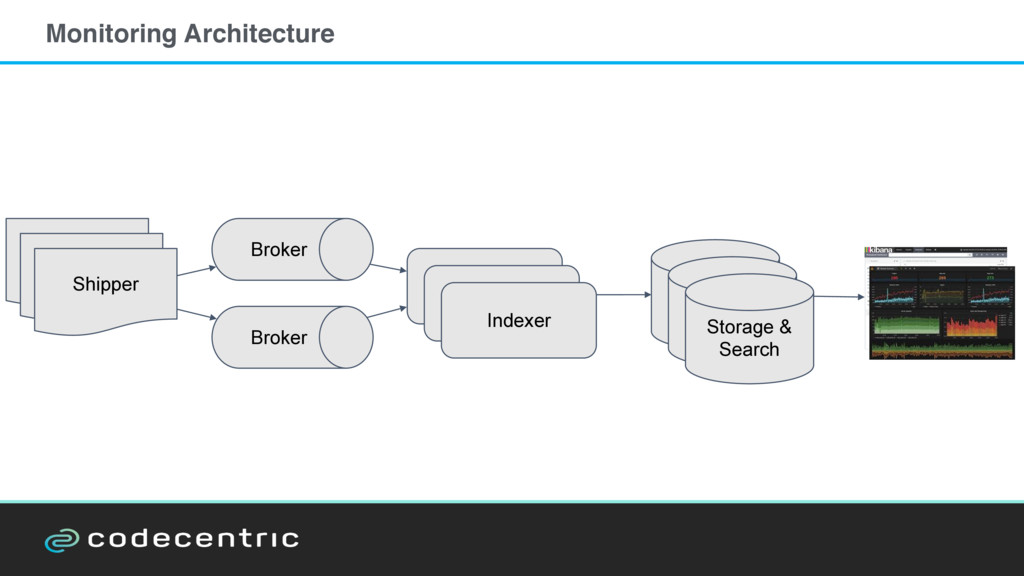
  22. Shipper Indexer Storage & Search Broker Storage & Search Storage

    & Search Broker Indexer Indexer Monitoring Architecture
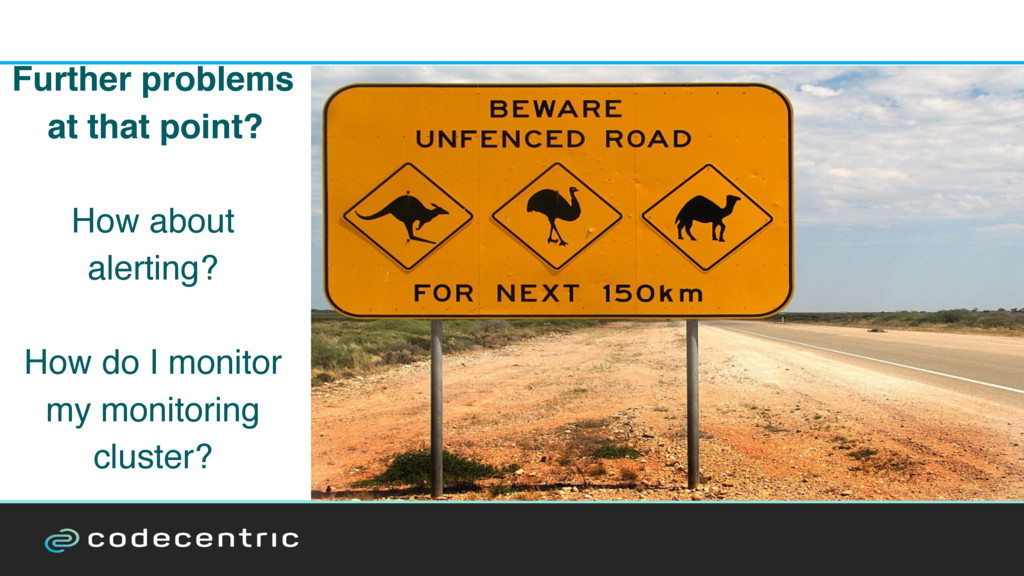
  23. Further problems at that point? ! Be aware of 


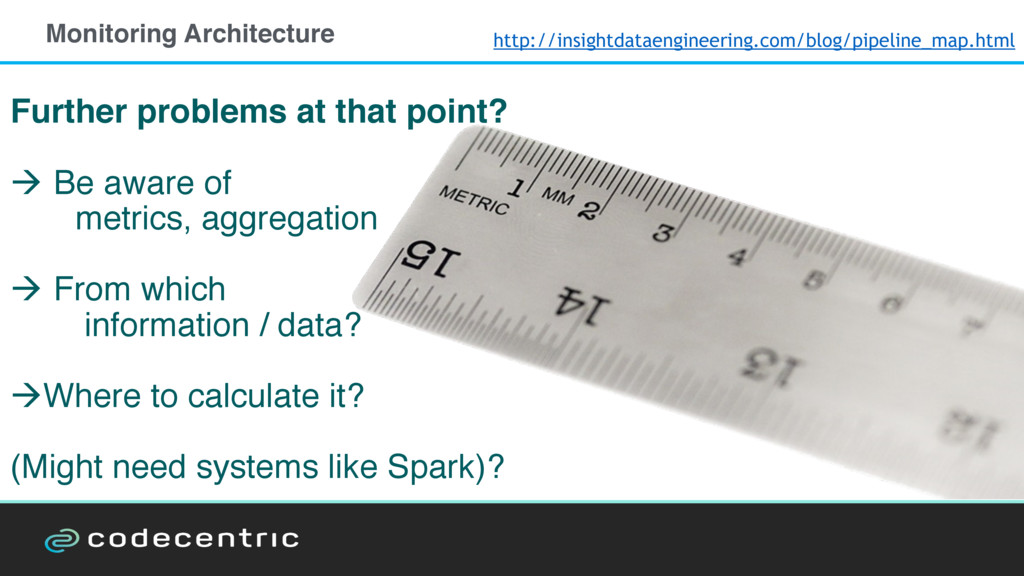
    metrics, aggregation ! From which information / data? !Where to calculate it? (Might need systems like Spark)? Monitoring Architecture http://insightdataengineering.com/blog/pipeline_map.html
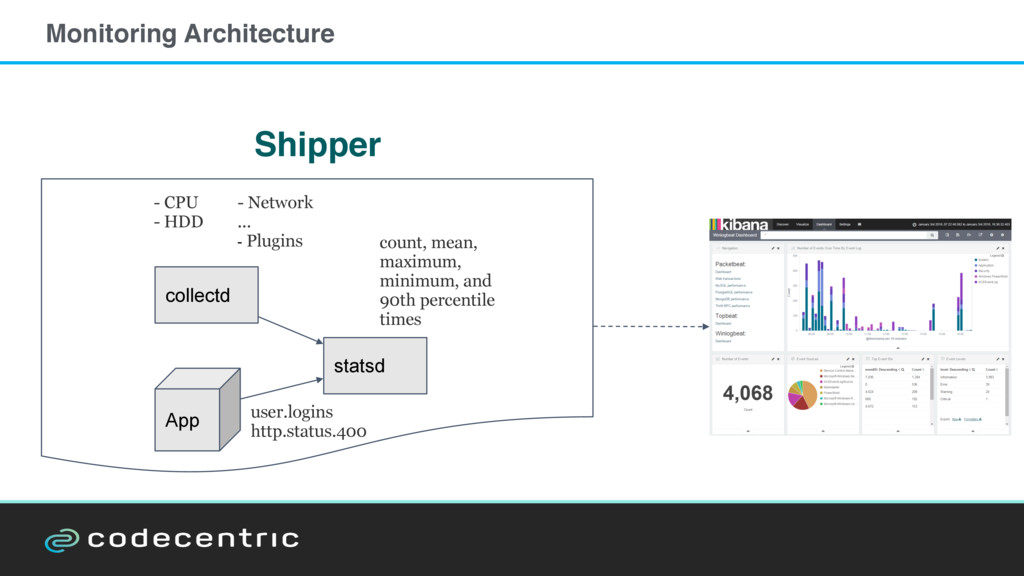
  24. Shipper collectd statsd - CPU - HDD - Network ...

    - Plugins App user.logins http.status.400 count, mean, maximum, minimum, and 90th percentile times Monitoring Architecture
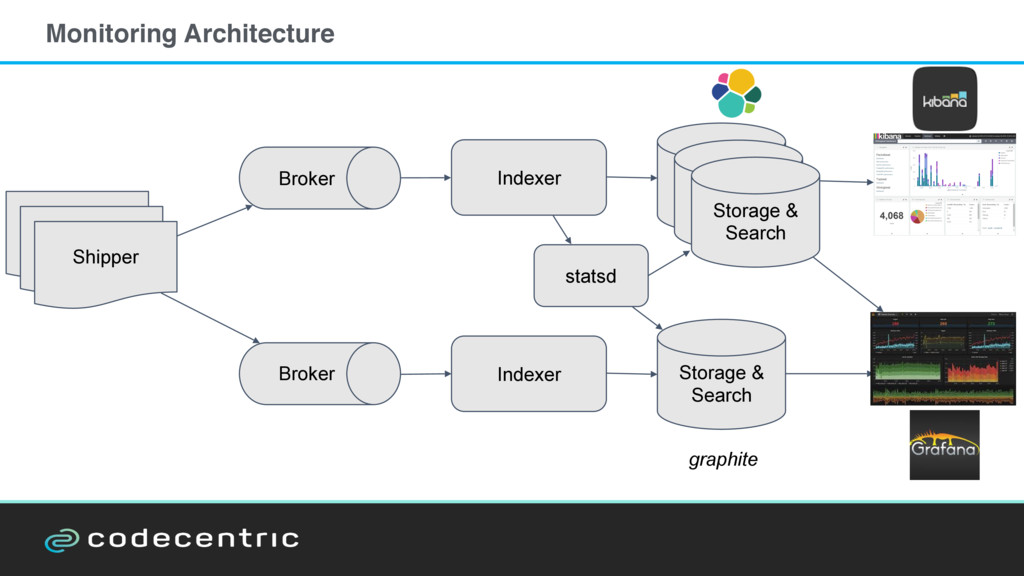
  25. Shipper Indexer Storage & Search Broker Storage & Search Storage

    & Search Broker Indexer Storage & Search graphite statsd Monitoring Architecture
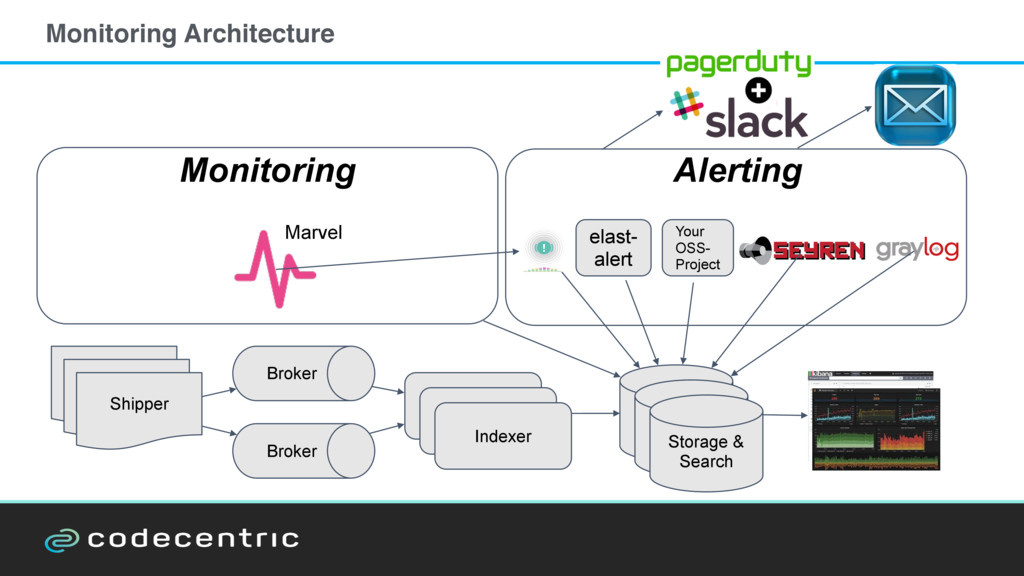
  26. Monitoring Shipper Indexer Storage & Search Broker Storage & Search

    Storage & Search Broker Indexer Indexer elast- alert Your OSS- Project Alerting Marvel Monitoring Architecture
  27. Our state now: ! Fine, but how to get those

    damn.. .. data into my database? Monitoring Architecture
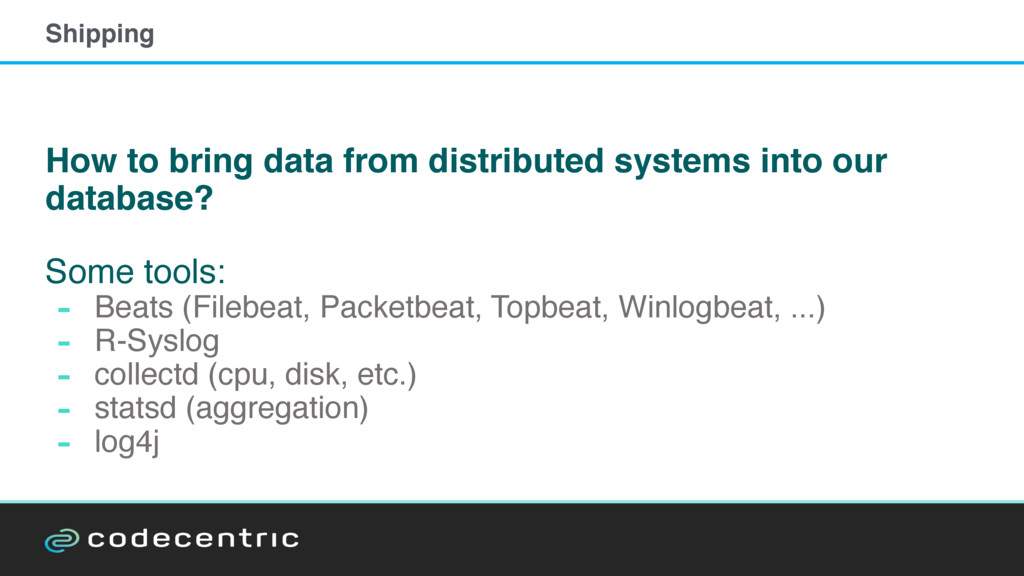
  28. How to bring data from distributed systems into our database?

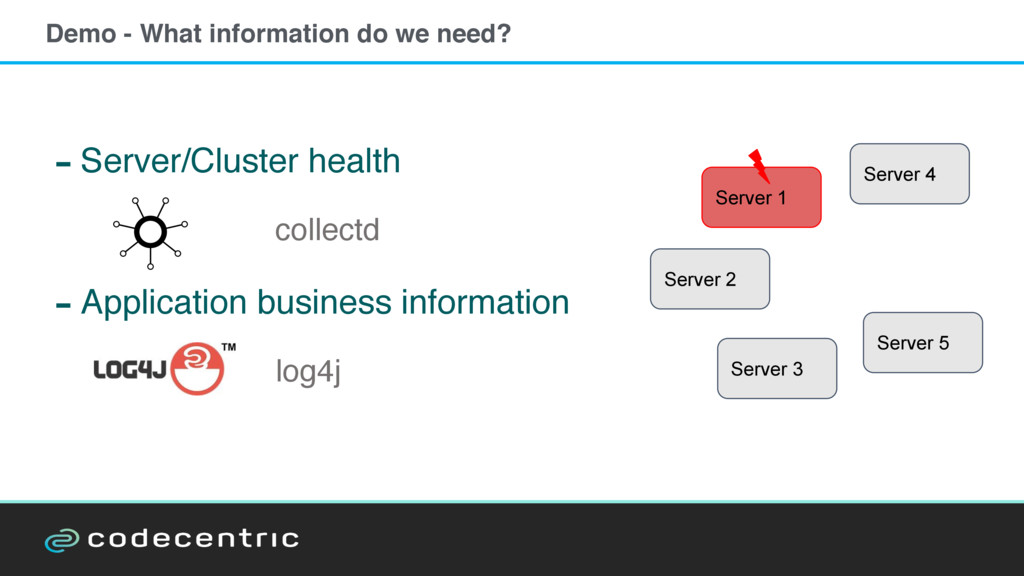
    Some tools: - Beats (Filebeat, Packetbeat, Topbeat, Winlogbeat, ...) - R-Syslog - collectd (cpu, disk, etc.) - statsd (aggregation) - log4j Shipping
  29. - Server/Cluster health collectd - Application business information log4j Server

    1 Server 2 Server 3 Server 4 Server 5 Demo - What information do we need?
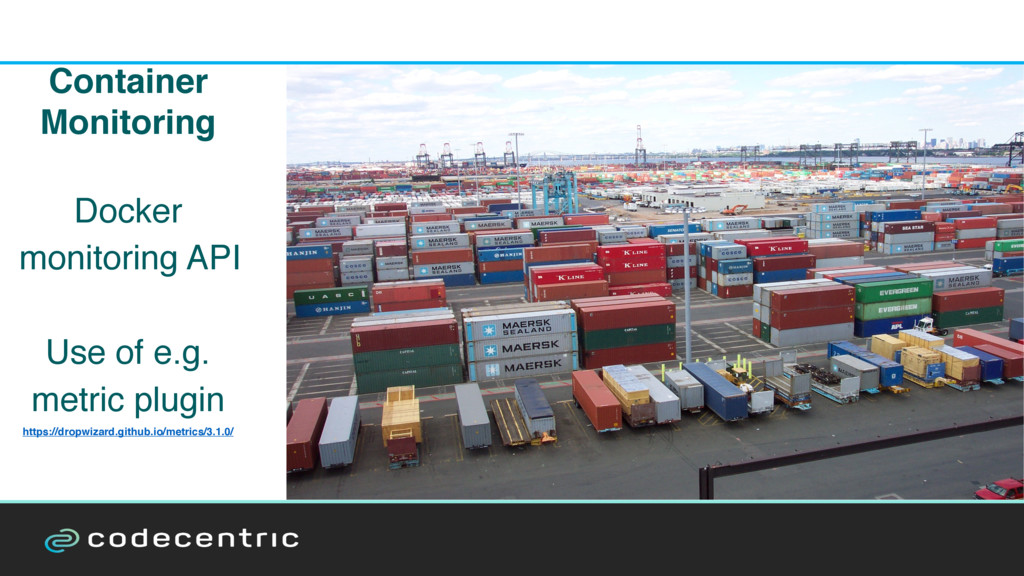
  30. Container Monitoring Docker monitoring API Use of e.g. metric plugin

    https://dropwizard.github.io/metrics/3.1.0/
  31. ✓ Monitoring today is a must ✓ Know your data

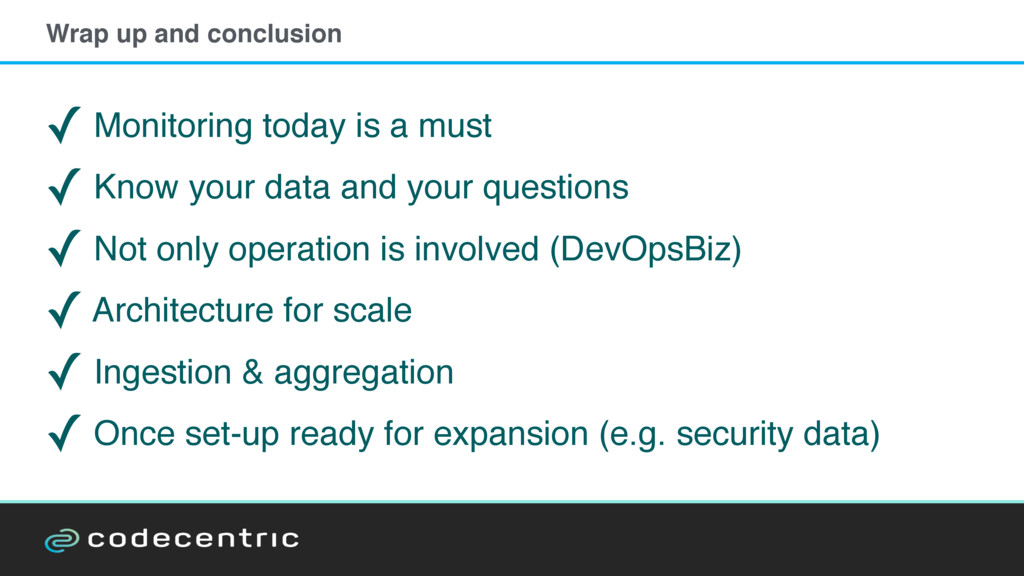
    and your questions ✓ Not only operation is involved (DevOpsBiz) ✓ Architecture for scale ✓ Ingestion & aggregation ✓ Once set-up ready for expansion (e.g. security data) Wrap up and conclusion
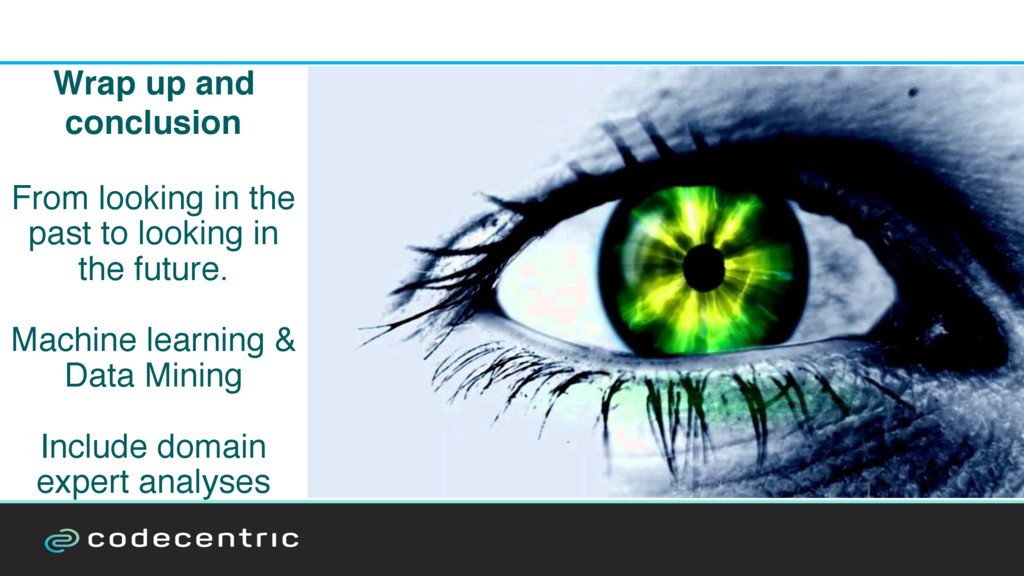
  32. Wrap up and conclusion 
 From looking in the past

    to looking in the future. Machine learning & Data Mining 
 Include domain expert analyses