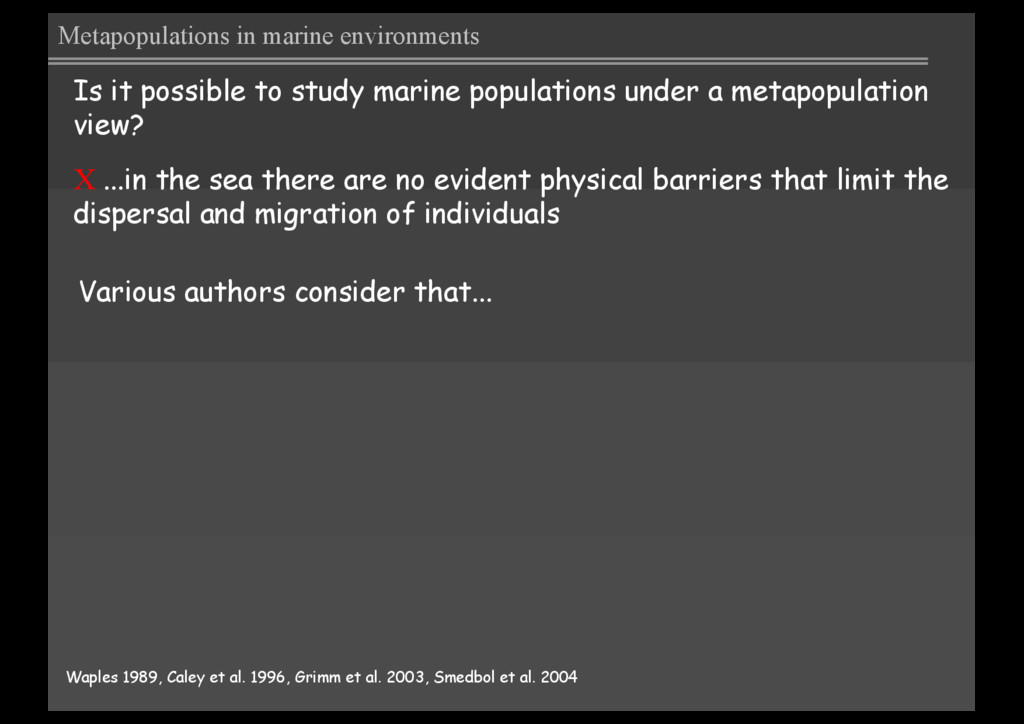
populations under a metapopulation view? X ...in the sea there are no evident physical barriers that limit the dispersal and migration of individuals Waples 1989, Caley et al. 1996, Grimm et al. 2003, Smedbol et al. 2004 Various authors consider that...
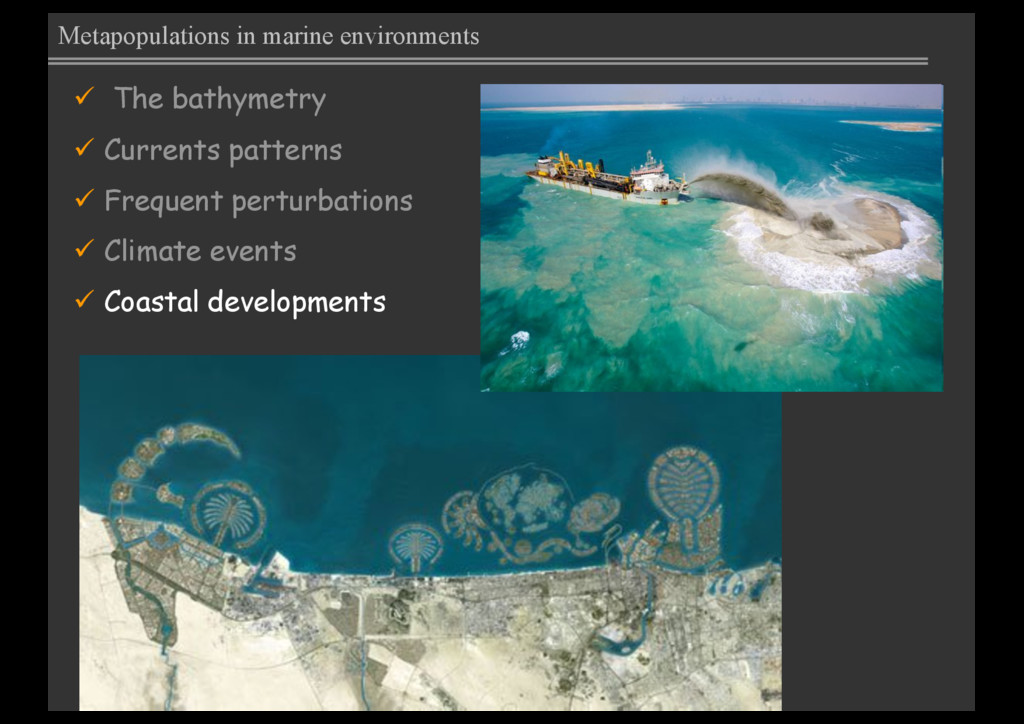
view? X ...in the sea there are no evident physical barriers that can limit the dispersal and migration of individuals ü ...can act as barriers breaking temporal and spatial connections between local populations. Waples 1989, Caley et al. 1996, Ruzzante et al. 1998, Grimm et al. 2003, Smedbol et al. 2004 Metapopulation approach in marine species ü...local populations can have dynamics that are not dependent on the input of external individuals, although eventual interchanges may exist Metapopulations in marine environments
dispersion between patches is not so low to limit the connectivity with demographic importance, but no so high for considering everything as one population Sale et al 2006. Metapopulations in marine environments
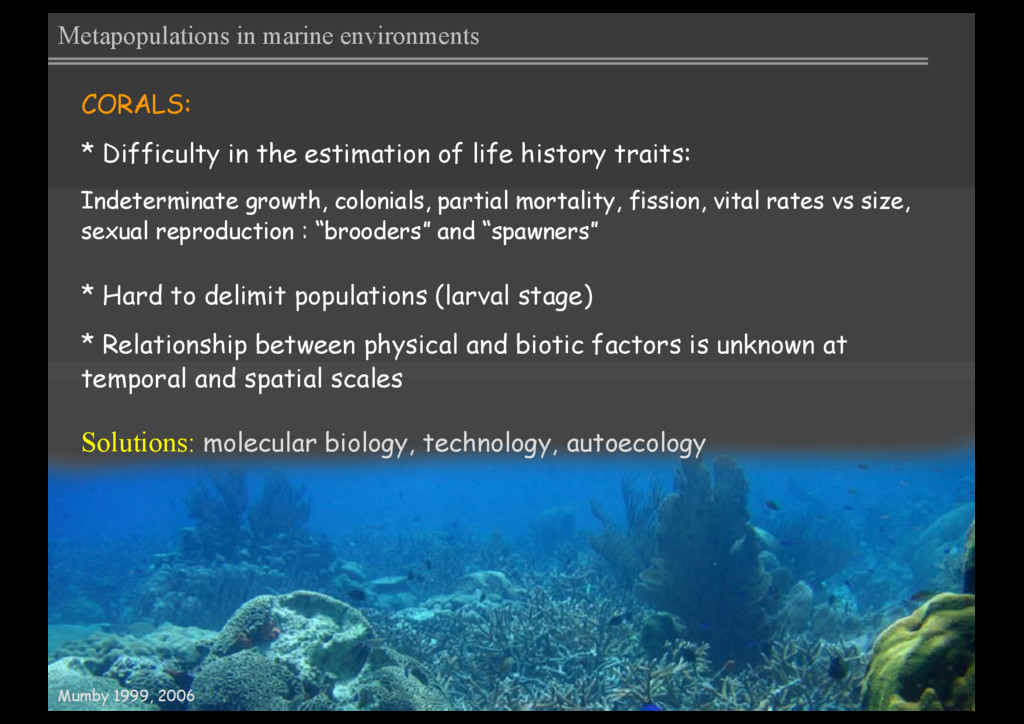
* Relationship between physical and biotic factors is unknown at temporal and spatial scales CORALS: * Difficulty in the estimation of life history traits: Indeterminate growth, colonials, partial mortality, fission, vital rates vs size, sexual reproduction : “brooders” and “spawners” Solutions: molecular biology, technology, autoecology Metapopulations in marine environments
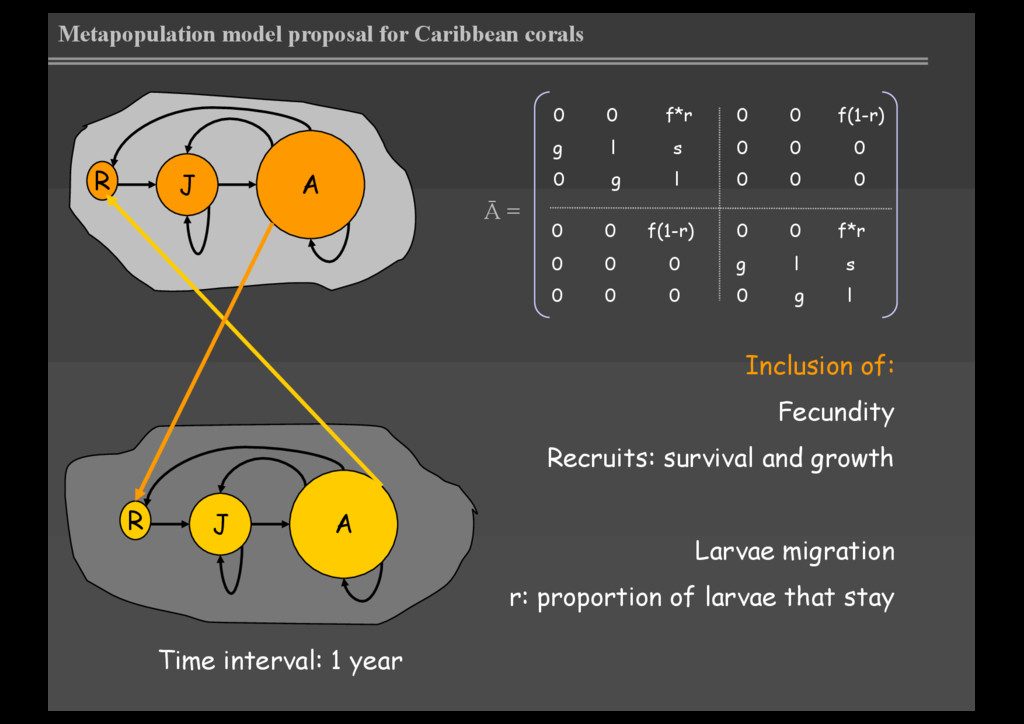
0 f*r g l s 0 g l R J A 0 0 f*r g l s 0 g l Ā = 0 0 f(1-r) 0 0 0 0 0 0 0 0 f(1-r) 0 0 0 0 0 0 Time interval: 1 year Larvae migration r: proportion of larvae that stay Inclusion of: Fecundity Recruits: survival and growth
Hughes & Tanner 2000, Brazeau et al. 2005, Ramula & Lehtilä 2005 Brooders release larvae for several months (5 months in Belice and 9 in Curaçao) Brooders larvae: able to settle 4 hours after release up to 3 months Majority recruits near parental colonies but migration may also occur The matrix: Hughes 1984, Hughes & Tanner 2000 RB: 2 matrices (calm and storm)
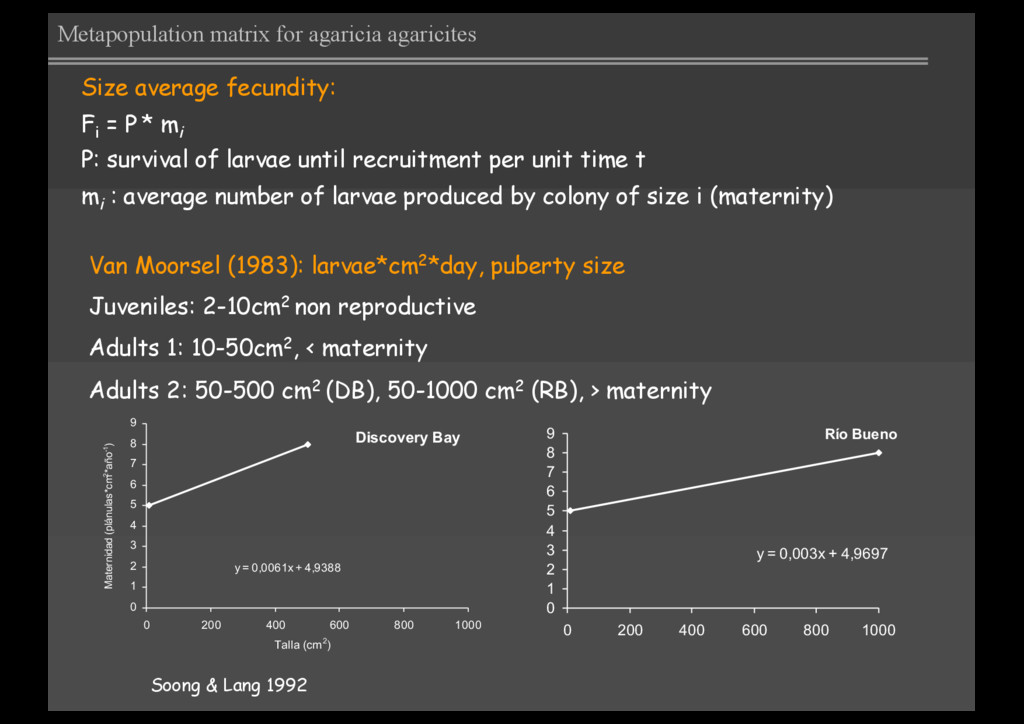
survival of larvae until recruitment per unit time t mi : average number of larvae produced by colony of size i (maternity) Soong & Lang 1992 Discovery Bay y = 0,0061x + 4,9388 0 1 2 3 4 5 6 7 8 9 0 200 400 600 800 1000 Talla (cm2) Maternidad (plánulas*cm2*año-1) Río Bueno y = 0,003x + 4,9697 0 1 2 3 4 5 6 7 8 9 0 200 400 600 800 1000 Van Moorsel (1983): larvae*cm2*day, puberty size Juveniles: 2-10cm2 non reproductive Adults 1: 10-50cm2, < maternity Adults 2: 50-500 cm2 (DB), 50-1000 cm2 (RB), > maternity Metapopulation matrix for agaricia agaricites
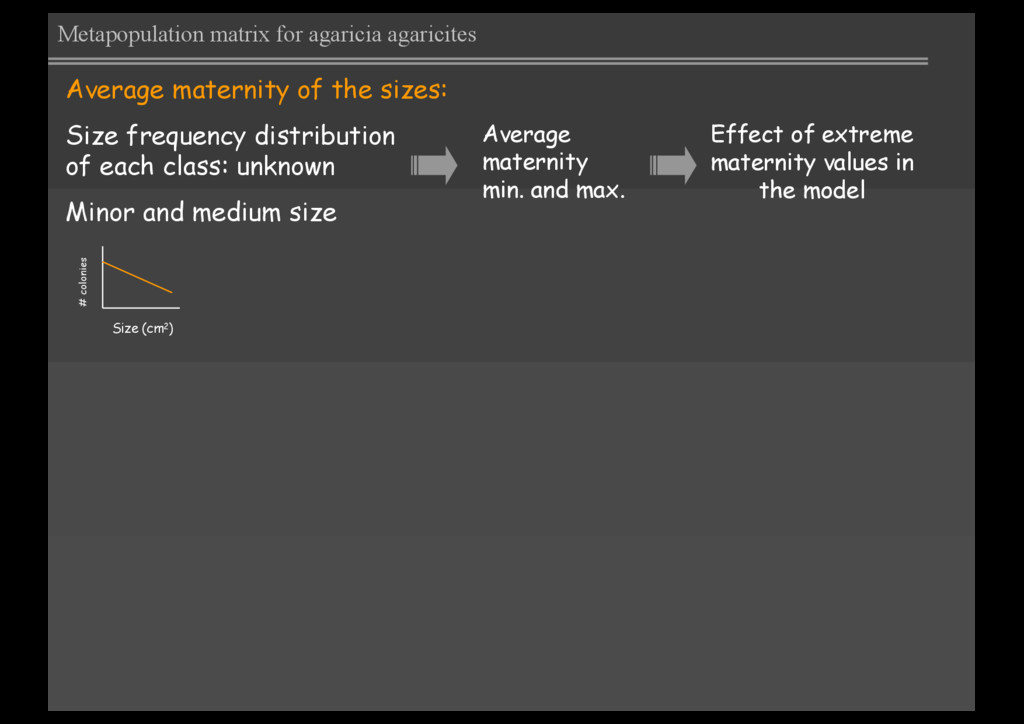
class: unknown Minor and medium size Average maternity min. and max. Effect of extreme maternity values in the model Metapopulation matrix for agaricia agaricites Size (cm2) # colonies
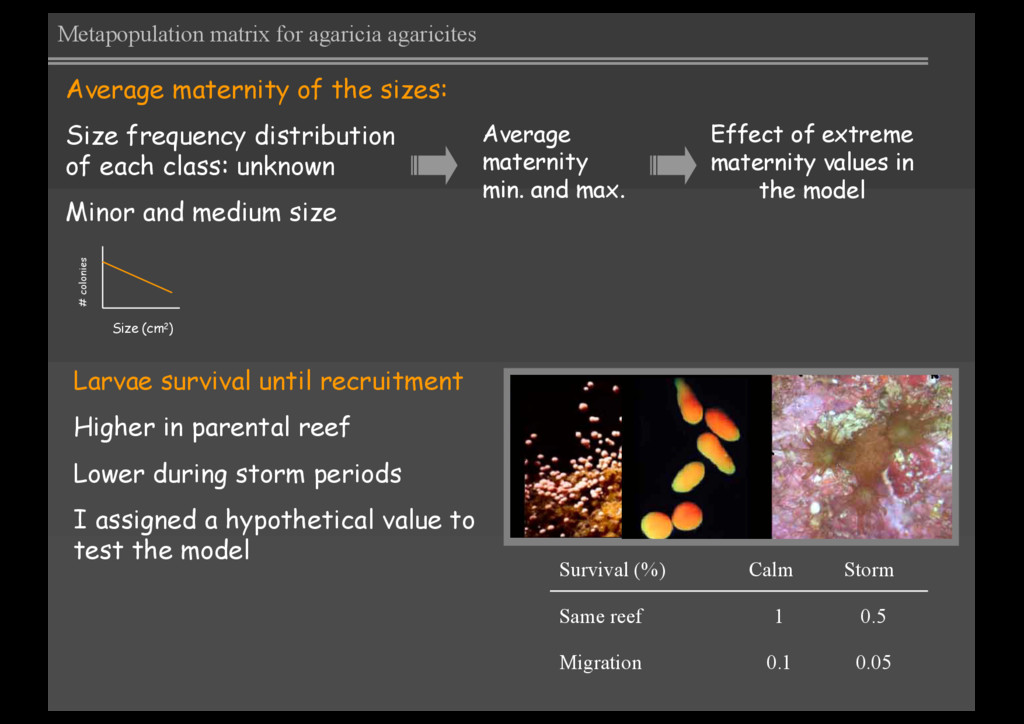
(%) Larvae survival until recruitment Higher in parental reef Lower during storm periods I assigned a hypothetical value to test the model Average maternity of the sizes: Size frequency distribution of each class: unknown Minor and medium size Average maternity min. and max. Effect of extreme maternity values in the model Metapopulation matrix for agaricia agaricites Size (cm2) # colonies
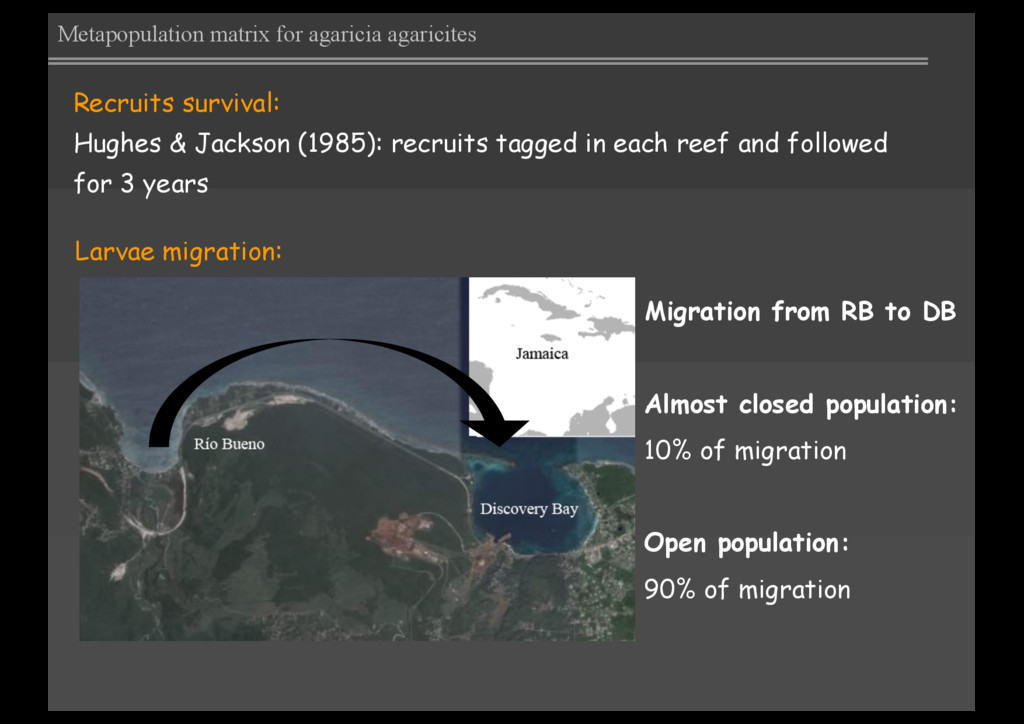
reef and followed for 3 years Larvae migration: Migration from RB to DB Almost closed population: 10% of migration Open population: 90% of migration Metapopulation matrix for agaricia agaricites
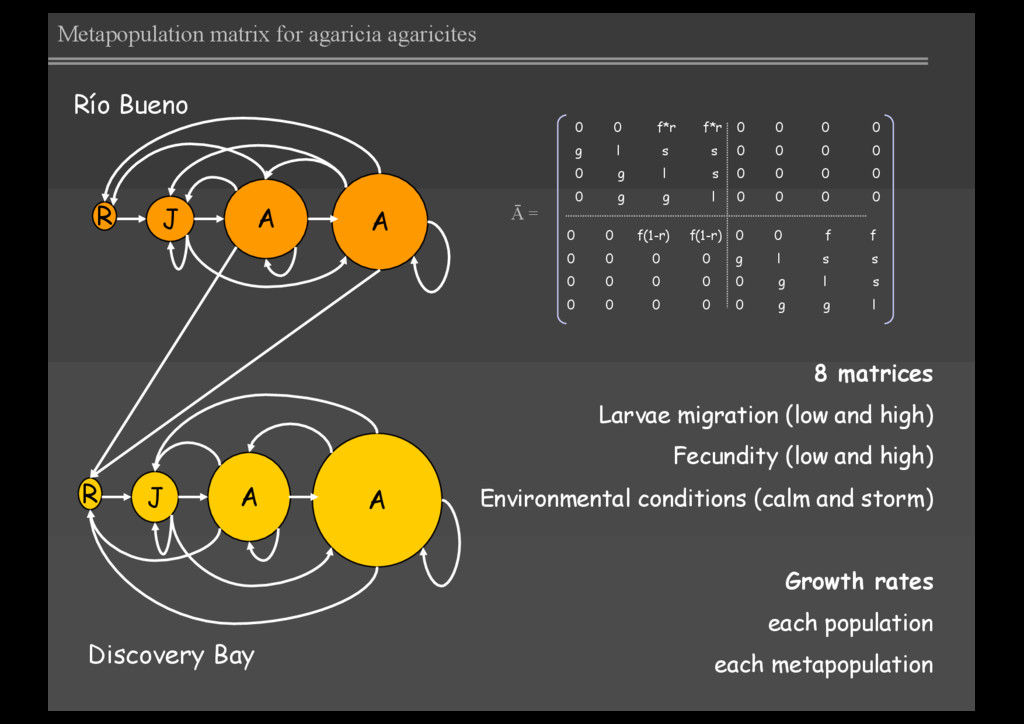
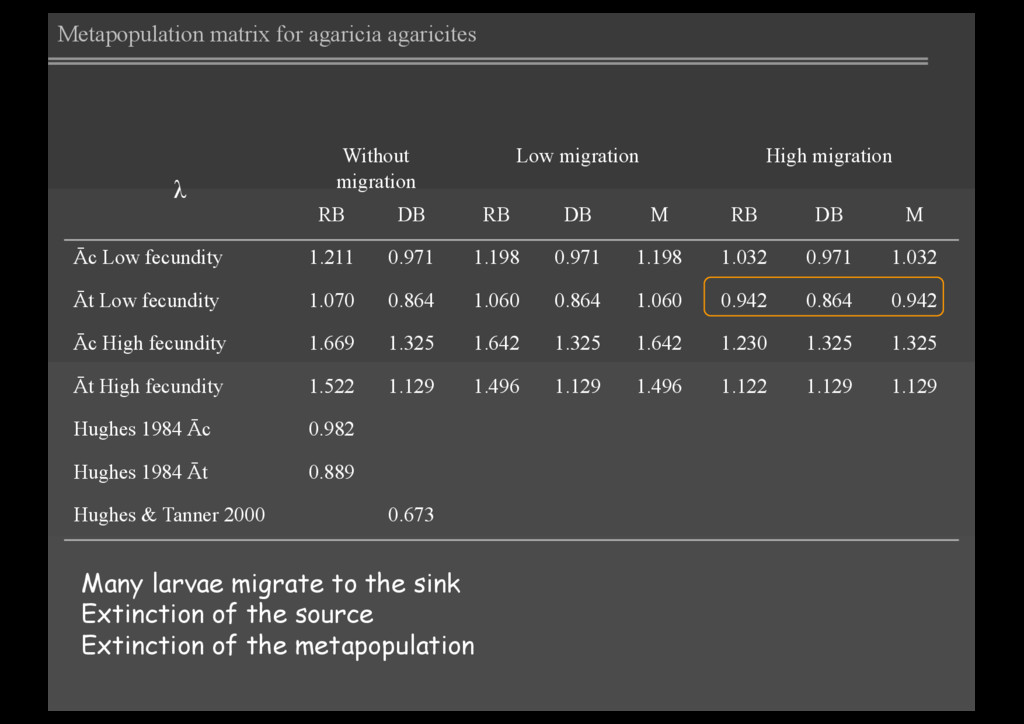
0 g l s 0 g g l 0 0 0 0 0 0 0 0 0 0 0 0 0 0 0 0 0 0 f(1-r) f(1-r) 0 0 0 0 0 0 0 0 0 0 0 0 0 0 f f g l s s 0 g l s 0 g g l R J A A R J A A Río Bueno Discovery Bay 8 matrices Larvae migration (low and high) Fecundity (low and high) Environmental conditions (calm and storm) Growth rates each population each metapopulation Metapopulation matrix for agaricia agaricites
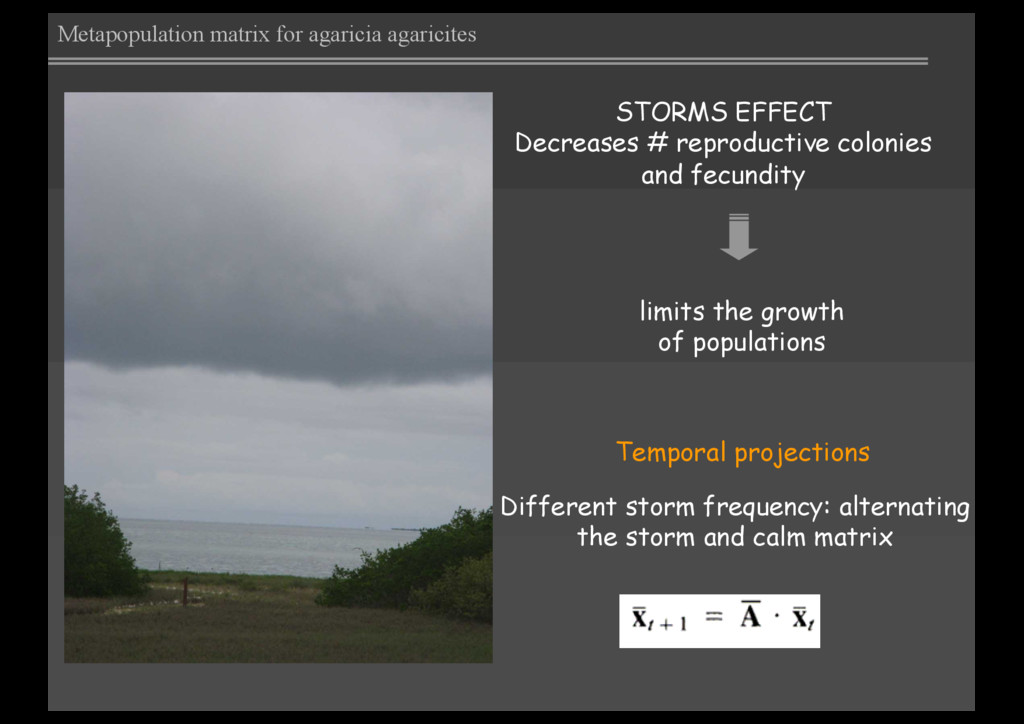
growth of populations Temporal projections Different storm frequency: alternating the storm and calm matrix Metapopulation matrix for agaricia agaricites
corals, however additional information of recruits transitions probability and fecundity are needed. üThe assumptions of this model are restrictive for doing long term projections (constant environment and density-independent population growth). ü The model can also be used to analize other migration scenarios.