Upgrade to Pro — share decks privately, control downloads, hide ads and more …

Understanding the Etiology of Substance Use Disorders among Adolescents

Adway
May 08, 2020

Understanding the Etiology of Substance Use Disorders among Adolescents

Adway

May 08, 2020
Tweet

Other Decks in Research

Transcript

  1. Introduction • National Institute on Drug Abuse (NIDA) estimates that

    about 5% of adolescents will be diagnosed with Substance Use Disorder (SUD). • SUD in adolescents can lead to a host of problems: - Poor peer relationships - Low academic performance - Vehicular deaths - Higher involvement with juvenile justice. - Stress and financial burden to the family. • Substance use in adolescence can result in a much greater likelihood of addiction in adult life. • What drives adolescents towards substance abuse?
  2. Motivation and Problem Statement ´ Epidemiological perspective, SUD is made

    more probable by many risk factors and alleviated by several protective factors: ´ Risk factors – peer use, permissive attitudes of parents, easy availability, attitude of adolescents towards use, etc. ´ Protective factors – drug education, parenting style, involvement in youth activities, school/academic performance, etc. ´ No agreement on which factors are dispositive or strong predictors of adolescents at risk for SUD. ´ Objective: Discover the etiology of substance use disorder in adolescents by considering interactions among risk and protective factors. Two goals to support this objective: ´ Predict adolescents at risk for SUD. ´ Understand the relative importance of factors.
  3. Outline ´ Introduction, Motivation, Problem Statement ´ Steps in the

    method: ´ Building a data-driven model. ´ Curating a labeled data set. ´ Selecting machine learning models ´ Training and testing the models, handling class imbalance ´ Defining performance metrics ´ Results: ´ Prediction performance ´ Relative Importance of factors ´ Relative Importance of interactions ´ Related work and contributions. ´ Concluding remarks, limitations and future work
  4. Building a Data-Driven Model ´ National Survey on Drug Use

    and Health (NSDUH), conducted by Substance Abuse and Mental Health Services Administration (SAMHSA) – 2017 Edition. ´ ~56,000 observations, each ~2600 questions. ´ 13,218 observations in the age range of 12-17. ´ Defines Substance Use Disorder as abuse and/or dependence of at least one: ´ Alcohol, marijuana, hallucinogens, inhalants, methamphetamine, cocaine, heroin, prescription pain relievers, stimulants, tranquilizers & sedatives. ´ Over 100 questions relevant to youth experiences, beliefs, and perception: ´ Mapped these variables to 34 risk and protective factors.
  5. Building a Data-Driven Model ´ 11 Simple factors – one-to-one

    mapping between NSDUH question & factor: ´ Race, gender, obesity, family size, presence of mother, father, poverty, etc. ´ 23 Compound factors – many-to-one mapping between NSDUH questions & factor. ´ Religious beliefs, participation in activities, risk taking behavior, etc. ´ Compound factor -- compose score by adding scores of constituent factors. Example – Religious Beliefs is composed from four questions: ´ # of religious services attended in the past 12 months? (25 or more =1, less than 25 = 2) ´ Religious beliefs very important. (Agree/Strongly Agree = 1, Disagree/Strongly Disagree = 2) ´ Religious beliefs influence decisions. (Agree/Strongly Agree = 1, Disagree/Strongly Disagree = 2) ´ Important that friends share religious beliefs. (Agree/Strongly Agree = 1, Disagree/Strongly Disagree = 2). ´ Scores of 4 to 8, 4 indicates strong religious beliefs, 8 indicates mild/weak beliefs.
  6. Building a Data-Driven Model ´ Classification of risk and protective

    factors is not standard: ´ Peer vs. Parents, Family vs. Community? ´ Propose a Nature vs. Nurture scheme to classify risk and protective factors ´ Nature group – Individual-centric, immutable, inherent characteristics: ´ Race, gender, physical and mental health, perception of risk, impulsive personality, violence and gang behavior, religious beliefs. ´ Nurture group – Environment and experiences: ´ Family size, economic status, parenting, school, community, neighborhood, drug prevention programs, education, etc. ´ A factor may belong to both, but placed in one group depending on whether it is pre-dominantly individual-centric or environment-centric. ´ Classification allows us to ask whether adolescents inherently predisposed or is it their environment and nurturing that leads them to substance abuse?
  7. Nature vs. Nature – Data-Driven Model No. Feature Mapping/Description #

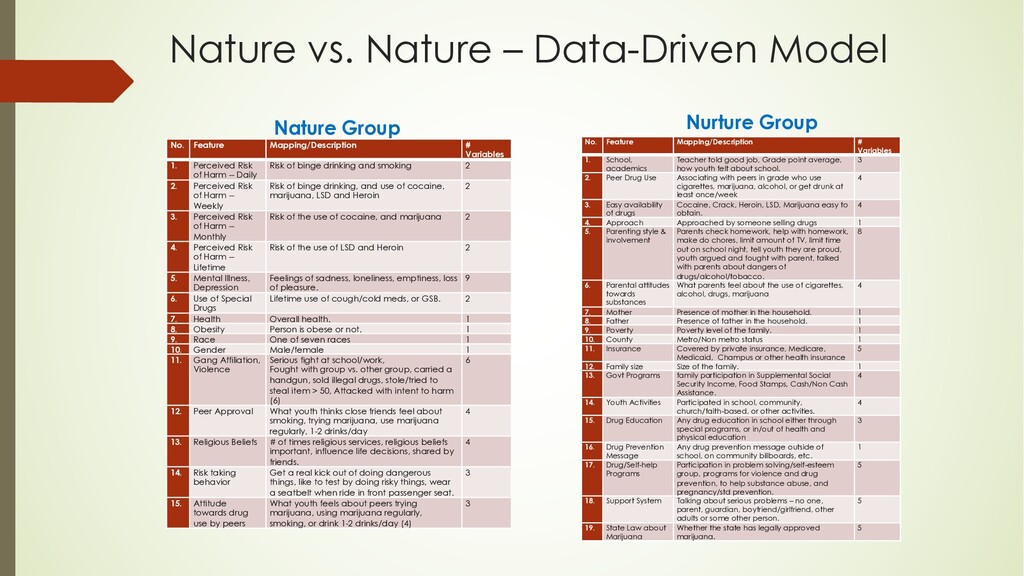
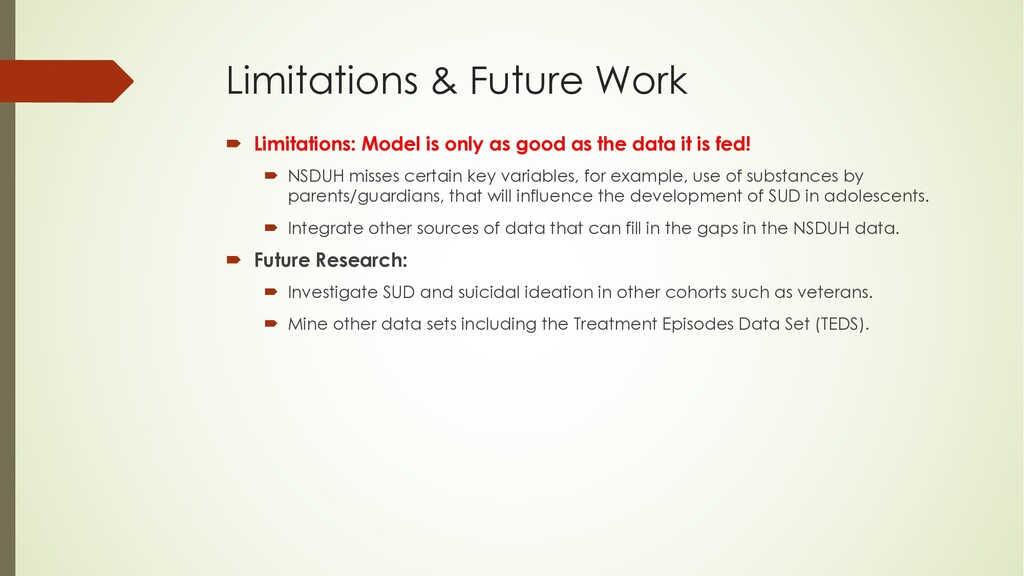
    Variables 1. Perceived Risk of Harm -- Daily Risk of binge drinking and smoking 2 2. Perceived Risk of Harm -- Weekly Risk of binge drinking, and use of cocaine, marijuana, LSD and Heroin 2 3. Perceived Risk of Harm -- Monthly Risk of the use of cocaine, and marijuana 2 4. Perceived Risk of Harm -- Lifetime Risk of the use of LSD and Heroin 2 5. Mental Illness, Depression Feelings of sadness, loneliness, emptiness, loss of pleasure. 9 6. Use of Special Drugs Lifetime use of cough/cold meds, or GSB. 2 7. Health Overall health. 1 8. Obesity Person is obese or not. 1 9. Race One of seven races 1 10. Gender Male/female 1 11. Gang Affiliation, Violence Serious fight at school/work, Fought with group vs. other group, carried a handgun, sold illegal drugs, stole/tried to steal item > 50, Attacked with intent to harm (6) 6 12. Peer Approval What youth thinks close friends feel about smoking, trying marijuana, use marijuana regularly, 1-2 drinks/day 4 13. Religious Beliefs # of times religious services, religious beliefs important, influence life decisions, shared by friends. 4 14. Risk taking behavior Get a real kick out of doing dangerous things, like to test by doing risky things, wear a seatbelt when ride in front passenger seat. 3 15. Attitude towards drug use by peers What youth feels about peers trying marijuana, using marijuana regularly, smoking, or drink 1-2 drinks/day (4) 3 No. Feature Mapping/Description # Variables 1. School, academics Teacher told good job, Grade point average, how youth felt about school. 3 2. Peer Drug Use Associating with peers in grade who use cigarettes, marijuana, alcohol, or get drunk at least once/week 4 3. Easy availability of drugs Cocaine, Crack, Heroin, LSD, Marijuana easy to obtain. 4 4. Approach Approached by someone selling drugs 1 5. Parenting style & involvement Parents check homework, help with homework, make do chores, limit amount of TV, limit time out on school night, tell youth they are proud, youth argued and fought with parent, talked with parents about dangers of drugs/alcohol/tobacco. 8 6. Parental attitudes towards substances What parents feel about the use of cigarettes, alcohol, drugs, marijuana 4 7. Mother Presence of mother in the household. 1 8. Father Presence of father in the household. 1 9. Poverty Poverty level of the family. 1 10. County Metro/Non metro status 1 11. Insurance Covered by private insurance, Medicare, Medicaid, Champus or other health insurance 5 12. Family size Size of the family. 1 13. Govt Programs family participation in Supplemental Social Security Income, Food Stamps, Cash/Non Cash Assistance. 4 14. Youth Activities Participated in school, community, church/faith-based, or other activities. 4 15. Drug Education Any drug education in school either through special programs, or in/out of health and physical education 3 16. Drug Prevention Message Any drug prevention message outside of school, on community billboards, etc. 1 17. Drug/Self-help Programs Participation in problem solving/self-esteem group, programs for violence and drug prevention, to help substance abuse, and pregnancy/std prevention. 5 18. Support System Talking about serious problems – no one, parent, guardian, boyfriend/girlfriend, other adults or some other person. 5 19. State Law about Marijuana Whether the state has legally approved marijuana. 5 Nature Group Nurture Group
  8. Curating a Labeled Data Set ´ Labeled data set was

    curated based on the data-driven model. ´ Each observation represents an adolescent, and contains: ´ Outcome to be predicted – SUD vs. No-SUD. ´ 34 risk and protective factors. ´ NSDUH contains data for 13,128 adolescents, in the range of 12-17 years. ´ After eliminating the missing values, we are left with a data set of 9,128 observations.
  9. Selecting Machine Learning Model(s) ´ Machine learning models offer the

    potential to consider complex interactions among factors that may influence an outcome: ´ Mathematically, f(xi ) = pi , xi = input, pi = prediction, f(.) = classifier. ´ Explain the output prediction in terms of inputs. ´ SUD/No-SUD classification of an adolescent is output; and 34 risk/protective factors are the inputs. ´ Considered and evaluated common machine learning models: ´ Support Vector Machines – Not suitable because most factors are categorical. ´ Naïve Bayes – Assumes independent factors, but youth experiences may have associations with each other. ´ Artificial Neural Networks – good accuracy for unstructured text such as images and text, but too heavy for survey data. Black-box, do not offer insights into how predictions are reached.
  10. Selecting Machine Learning Model(s) Salient features - Consider categorical variables

    & associations. - Offer insights into how decisions are reached. - Recursive splitting of the data set from the root node to the leaves. - At each node, choose a factor that makes the groups at lower level most homogeneous. Drawbacks: - Prone to overfitting – learn the training data well, but cannot generalize. - Sensitive to noise, small change in input can change predictions. - Ensemble learning can mitigate this drawback. Decision Trees
  11. Selecting Machine Learning Model(s) Ensemble learning – Aggregate predictions from

    decision trees for a more robust prediction. Random Forest: - Trees built in parallel on independent subsets of data. - Predictions aggregated at the end by majority vote. Gradient Boosting: - Trees built sequentially to improve upon prior misclassifications. - Predictions aggregated along the way.
  12. Training and Testing the Models ´ Standard process is to

    split the data into two partitions – training and test. ´ Training set contains between 60%-80% of the data, test set contains 40%-20%. ´ Train the model using the training set, evaluate using test set. ´ Standard process will not work because of “class imbalance”. ´ Class imbalance occurs because the number of SUD observations is less than 10% of the total number of observations: ´ SUD class is the minority class, No-SUD class is the majority class. ´ Model can predict that all adolescents are not likely to develop SUD, and it will be correct ~95% of the time. ´ Model predictions become moot, or irrelevant.
  13. Handling Class Imbalance ´ Two types of techniques to handle

    skewed proportions and balance training data. ´ Down-sampling: Remove observations from the majority/No-SUD class. ´ Up-sampling: Create observations from the minority/SUD class. ´ Synthetic Minority Oversampling Technique (SMOTE) – combines up-sampling & down-sampling. Implemented SMOTE in the following steps: ´ Split the data set 80-20 into two partitions using stratified sampling. ´ Stratified sampling preserves the 95%-5% ratio of No-SUD/SUD in both the partitions. ´ In partition #1, up-sample or synthetically create observations from the SUD class, and downs-ample or eliminate observations from the No-SUD class. ´ Number of SUD and No-SUD observations in partition #1 is identical, which creates a balanced training data set. ´ Partition #2 is the test data set, still unbalanced, and simulates real-life scenario of only about 5% adolescents having SUD.
  14. Defining Performance Metrics ´ Confusion matrix – Organize the predictions

    from a model with respect to the actual. ´ Sensitivity -- Ability of a model to correctly identify individuals with SUD. ´ Specificity -- Ability of a model to correctly identify individuals with No-SUD. ´ AUC -- Area under Receiver Operating Characteristics (ROC) curve evaluates tradeoff between sensitivity and specificity. AUC measures the ability to distinguish between SUD/No-SUD classes. ´Fair (0.70-0.80), Good (0.80-0.90), Exceptional (>0.90) Ground Truth SUD No-SUD Predicted SUD True Positive (TP) False Positive (FP) No-SUD False Negative (FN) True Negative (TN) = + = +
  15. Results – Prediction Performance Model Sensitivity Specificity AUC Decision Tree

    0.79 (± 0.013) 0.79 (± 0.008) 0.84 (± 0.006) Random Forest 0.81 (± 0.010) 0.83 (± 0.003) 0.90 (± 0.008) Gradient Boosting 0.83 (± 0.004) 0.82 (± 0.010) 0.91 (± 0.002) Logistic Regression 0.82 (± 0.003) 0.82 (± 0.011) 0.88 (± 0.003) • Ensemble models can distinguish between adolescents with and without SUD exceptionally accurately, with AUC over 0.90. - Outperform decision tree model, which is expected. • Ensemble models have higher AUC than logistic regression which is a baseline model in epidemiological studies. • Advantage of ensemble models - rank factors and their interactions, in order of importance for prediction, logistic regression can only determine whether they are statistically significant or not.
  16. Results – Relative Importance of Factors • Importance of factors

    is measured by their contribution to predicting SUD. • How much he factor contributes to homogenize each class in a decision tree. • Top 10 factors are equally split between Nature & Nurture groups. • Relative importance of the factors is very is close.
  17. Results – Relative Importance of Factors ´ Factors in the

    Nature Group: ´ Seeking approval of peers for the use of substances. ´ Approving the use of substances by peers. ´ Risk taking behavior (thrill of not wearing seatbelts, doing something risky). ´ Participation in violent/gang behavior. ´ Obesity. ´ Factors in the Nurture Group: ´ Perception that substances are easily available. ´ Actual ease of availability of substances. ´ Negative influence by associating with peers of substances. ´ Permissive parental attitudes towards the use of substances. ´ Degree of parental involvement and parenting style. ´ Consider the relative importance of the interactions among the factors?
  18. Results – Relative Importance of Interactions • Importance of interactions

    is measured by the number of times the interaction occurs in the ensemble of trees. • Most interactions among the top 10 are between obesity and risk taking behavior from the Nature group, and easy availability of substances from the Nurture group. • Obesity – may be manifestation of a chronic loss of control and impulsivity, triggered by easy availability of substances.
  19. Related Work & Contributions ´ Considerable debate on the relative

    importance of different types of risk and protective factors on substance abuse among adolescents. ´ Some researchers find that the influence of risk factors is greater than the mitigation offered by protective factors. ´ Some find that individual and peer factors have a higher influence, some find that factors concerning family and school have stronger influence. ´ Influence of factors may change over the course of adolescence. ´ Contributes to the debate in finding SUD among adolescents may arise from a confluence of inherent traits and environmental characteristics-- adolescents with impulsive and risk taking nature are nurtured in neighborhoods with easy availability of substances.
  20. Concluding Remarks ´ To the best of our knowledge, this

    is the first study to comprehensively consider the risk and protective factors that influence SUD among adolescents in an integrated manner. ´ Findings may explain SUD in adolescents is a problem both in affluent communities and those with low socioeconomic status: • In both communities, substances are easily available. • Legalization of marijuana will ease access and availability. • Demonstrates that public domain data sets such as the NSDUH contain rich information that can be mined to improve our understanding of mental illnesses and substance use disorders among different cohorts.
  21. Limitations & Future Work ´ Limitations: Model is only as

    good as the data it is fed! ´ NSDUH misses certain key variables, for example, use of substances by parents/guardians, that will influence the development of SUD in adolescents. ´ Integrate other sources of data that can fill in the gaps in the NSDUH data. ´ Future Research: ´ Investigate SUD and suicidal ideation in other cohorts such as veterans. ´ Mine other data sets including the Treatment Episodes Data Set (TEDS).
  22. Selected References ´ Lander L, Howsare J, Byrne M. The

    Impact of Substance Use Disorders on Families and Children: From Theory to Practice. Soc Work Public Health. 2013;28(0):194-205. doi:10.1080/19371918.2013.759005.. ´ Wadekar AS. Understanding Opioid Use Disorder (OUD) using tree-based classifiers. Drug Alcohol Depend. 2020;208:107839. doi:10.1016/j.drugalcdep.2020.107839 ´ Shakya HB, Christakis NA, Fowler JH. Parental Influence on Substance Use in Adolescent Social Networks. Arch Pediatr Adolesc Med. 2012;166(12):1132-1139. doi:10.1001/archpediatrics.2012.1372 ´ Shakya HB, Christakis NA, Fowler JH. Parental Influence on Substance Use in Adolescent Social Networks. Arch Pediatr Adolesc Med. 2012;166(12):1132-1139. doi:10.1001/archpediatrics.2012.1372. ´ Sansone RA, Sansone LA. Obesity and Substance Misuse: Is There a Relationship? Innov Clin Neurosci. 2013;10(9-10):30-35. ´ Denoth F, Siciliano V, Iozzo P, Fortunato L, Molinaro S. The Association between Overweight and Illegal Drug Consumption in Adolescents: Is There an Underlying Influence of the Sociocultural Environment? PLOS ONE. 2011;6(11):e27358. doi:10.1371/journal.pone.0027358. ´ Cleveland MJ, Feinberg ME, Bontempo DE, Greenberg MT. The role of risk and protective factors in substance use across adolescence. J Adolesc Health Off Publ Soc Adolesc Med. 2008;43(2):157-164. doi:10.1016/j.jadohealth.2008.01.015 ´ Substance Abuse and Mental Health Services Administration. National Survey on Drug Use and Health 2017 Edition. https://www.datafiles.samhsa.gov/. Published 2017. Accessed May 9, 2019. ´ Whitesell M, Bachand A, Peel J, Brown M. Familial, social, and individual factors contributing to risk for adolescent substance use. J Addict. 2013;2013:579310. doi:10.1155/2013/579310
  23. Selected References (contd..) ´ American Psychiatric Association. Diagnostic and Statistical

    Manual of Mental Disorders. Fifth Edition. American Psychiatric Association; 2013. doi:10.1176/appi.books.9780890425596 ´ Prabhanjan Narayanachar Tattar. Hands-On Ensemble Learning with R: A beginner’s guide to combining the power of machine learning algorithms using ensemble techniques: https://smile.amazon.com/Hands- Ensemble-Learning-algorithms-techniques/dp/1788624149?sa-no-redirect=1. Published July 27, 2018. Accessed May 9, 2019. ´ Sidey-Gibbons JAM, Sidey-Gibbons CJ. Machine learning in medicine: a practical introduction. BMC Med Res Methodol. 2019;19(1):64. doi:10.1186/s12874-019-0681-4 ´ National Institute on Drug Abuse. Monitoring the Future Survey.; 2019. ´ Chawla NV, Bowyer KW, Hall LO, Kegelmeyer WP. SMOTE: Synthetic Minority Over-sampling Technique. J Artif Intell Res. 2002;16:321-357. doi:10.1613/jair.953 ´ Rice ME, Harris GT. Comparing effect sizes in follow-up studies: ROC Area, Cohen’s d, and r. Law Hum Behav. 2005;29(5):615-620. doi:10.1007/s10979-005-6832-7 ´ Wright DA, Pemberton M. Risk and Protective Factors for Adolescent Drug Use: Findings from the 1999 National Household Survey on Drug Abuse. Department of Health and Human Services, Substance Abuse and Mental Health …; 2004. ´ Case S. Indicators of adolescent alcohol use: a composite risk factor approach. Subst Use Misuse. 2007;42(1):89-111. doi:10.1080/10826080601094280 ´ Kliewer W, Murrelle L. Risk and protective factors for adolescent substance use: findings from a study in selected Central American countries. J Adolesc Health Off Publ Soc Adolesc Med. 2007;40(5):448-455. doi:10.1016/j.jadohealth.2006.11.148 ´ Joffe A, Yancy WS. Legalization of Marijuana: Potential Impact on Youth. Pediatrics. 2004;113(6):e632- e638. doi:10.1542/peds.113.6.e632