Upgrade to Pro — share decks privately, control downloads, hide ads and more …

Big Data Warehousing, or, How to make Impact wi...

Sponsored · Ship Features Fearlessly Turn features on and off without deploys. Used by thousands of Ruby developers. →

Big Data Warehousing, or, How to make Impact with Data

While many companies have focused on powering products with their big data, Shopify has instead focused on building a well modelled data warehouse to power better decisions across it's rather wild business first. This seems like a terribly uncool thing to do these days: it doesn't involve much machine learning or advanced math, but it has been wildly successful at Shopify, and laid a fantastic foundation for data scientists to start doing the fancy stuff. Shopify has built a highly structured, clean, and useful warehouse using new ideas like Apache Spark and old ideas like dimensional modelling to achieve technical and organizational scalability. This talk will be about how we model our data, why we think it is the right thing to do, and the hard-won lessons learned in deploying Spark and Hadoop for such a task.

Avatar for Harry Brundage

Harry Brundage

April 09, 2015

More Decks by Harry Brundage

Other Decks in Technology

Transcript

  1. Big Data Warehousing or, Hold Yer Machine Learning Horses Harry

    Brundage or, Impact with Data or, Why I am frustrated I am not 60 or, The Big Part Just Makes It Harder Not Different Most of the Time
  2. Harry Brundage Defunct JavaScript framework author Installed Eclipse 3 weeks

    ago, but in my defence IntelliJ almost immediately after Great Haircut
  3. - More seriously for a moment, I work for a

    company called Shopify as the Data Engineering Lead - We make e-commerce software, if you want to sell stuff online we make it really really easy
  4. $<redacte d> / s - Last I check we process

    around this number of dollars per second through our platform. - Not a gigantic number when you look at it like this
  5. <a lot> $ / hr - Last I check we

    process around this number of dollars per second through our platform. - Not a gigantic number when you look at it like this
  6. Abraham Wald, October 31, 1902 – December 13, 1950 -

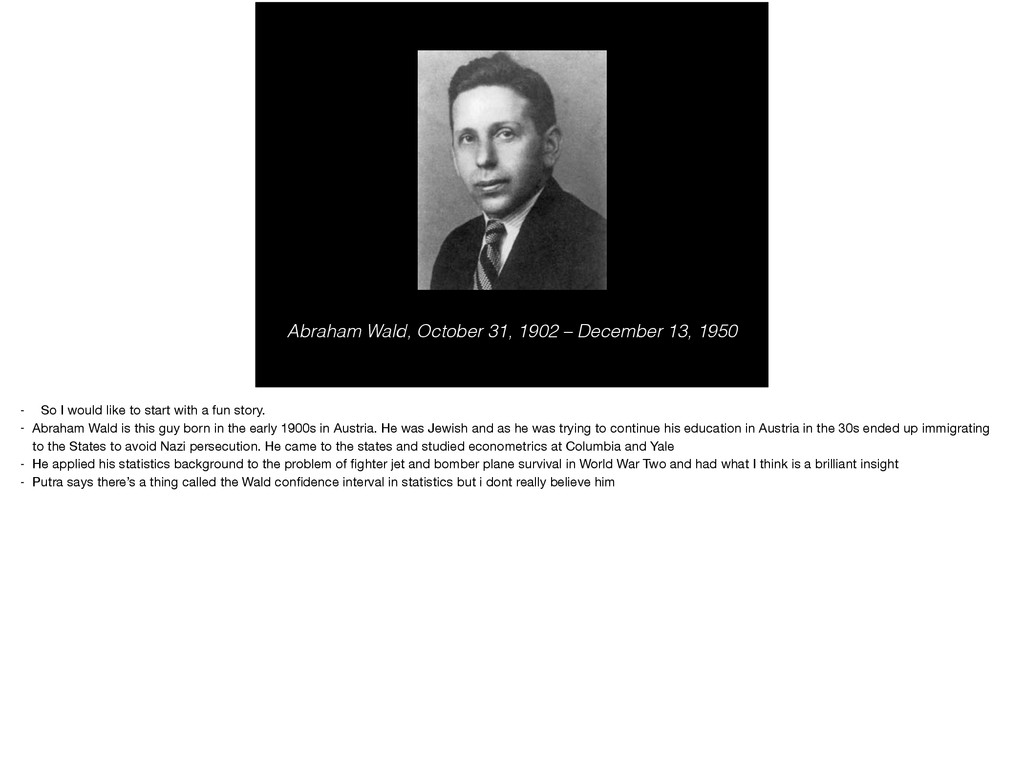
    So I would like to start with a fun story. - Abraham Wald is this guy born in the early 1900s in Austria. He was Jewish and as he was trying to continue his education in Austria in the 30s ended up immigrating to the States to avoid Nazi persecution. He came to the states and studied econometrics at Columbia and Yale - He applied his statistics background to the problem of fighter jet and bomber plane survival in World War Two and had what I think is a brilliant insight - Putra says there’s a thing called the Wald confidence interval in statistics but i dont really believe him
  7. - The British Bomber command had commissioned a survey of

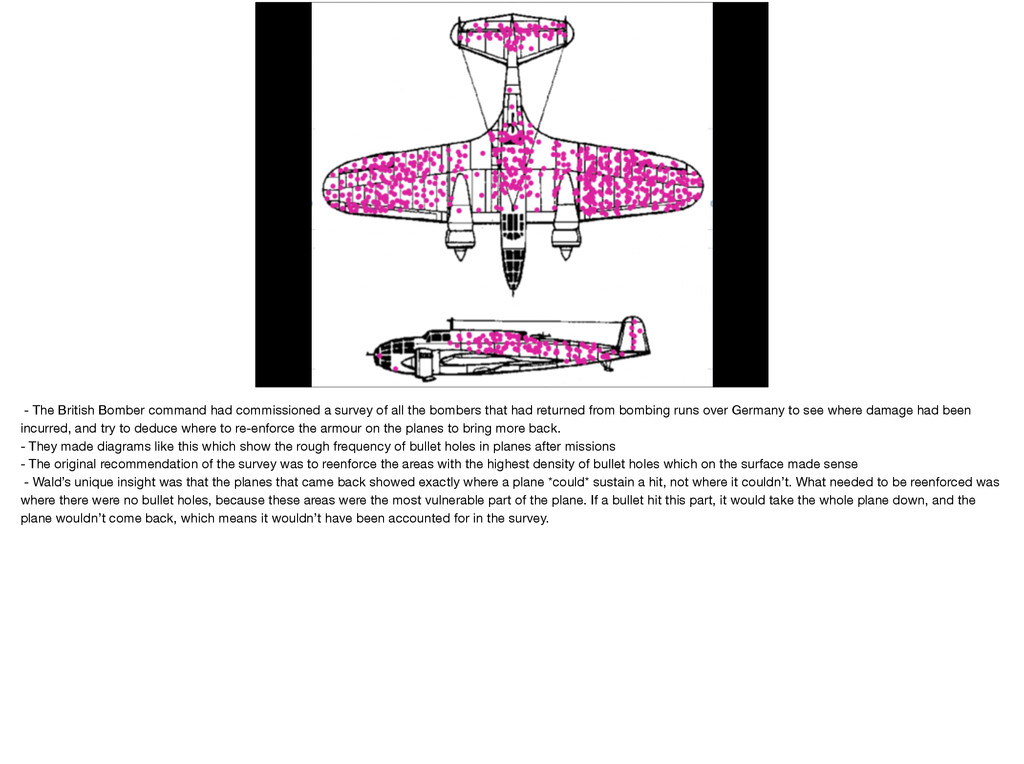
    all the bombers that had returned from bombing runs over Germany to see where damage had been incurred, and try to deduce where to re-enforce the armour on the planes to bring more back. - They made diagrams like this which show the rough frequency of bullet holes in planes after missions - The original recommendation of the survey was to reenforce the areas with the highest density of bullet holes which on the surface made sense - Wald’s unique insight was that the planes that came back showed exactly where a plane *could* sustain a hit, not where it couldn’t. What needed to be reenforced was where there were no bullet holes, because these areas were the most vulnerable part of the plane. If a bullet hit this part, it would take the whole plane down, and the plane wouldn’t come back, which means it wouldn’t have been accounted for in the survey.
  8. - Wald’s work on plane survivability (and the ensuing identification

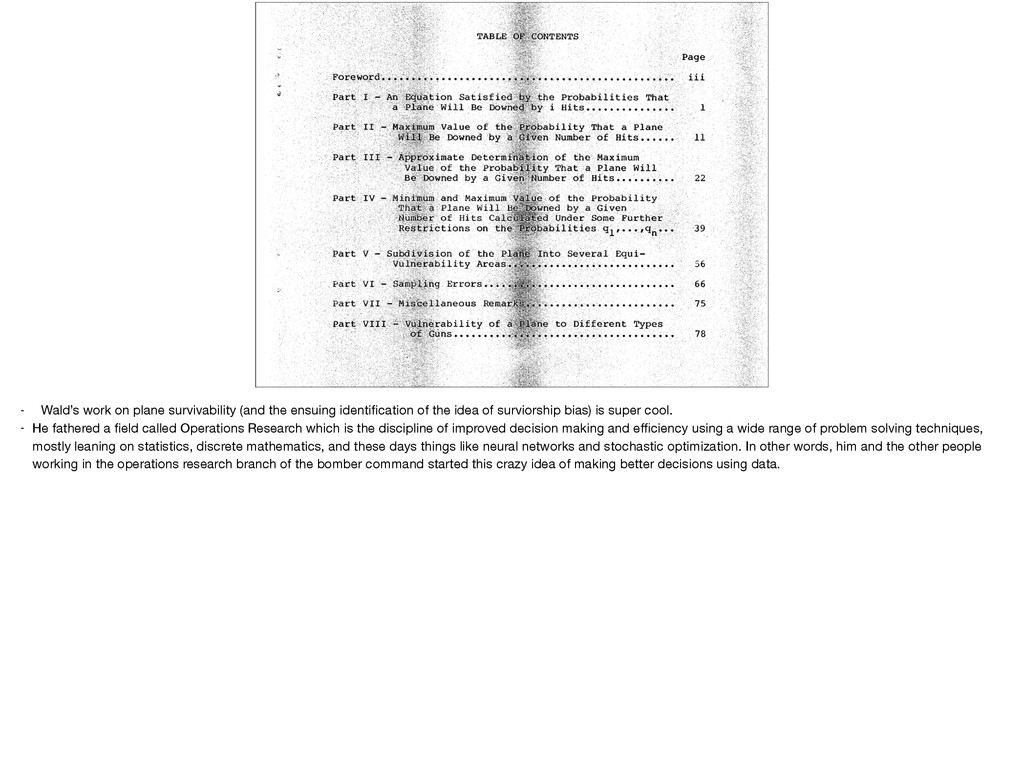
    of the idea of surviorship bias) is super cool. - He fathered a field called Operations Research which is the discipline of improved decision making and efficiency using a wide range of problem solving techniques, mostly leaning on statistics, discrete mathematics, and these days things like neural networks and stochastic optimization. In other words, him and the other people working in the operations research branch of the bomber command started this crazy idea of making better decisions using data.
  9. FARSHYSUFDB #1 Impact is hard, but it happens when the

    data and the interpreter come together with the right context. - This leads me to my first farsheeesufdb, Fundamental And Rather Strongly Held Yet Still Up For Debate Belief - The reason this story is special to me is that the data didn’t automagically demonstrate how to make better planes, an interpretation, and in Wald’s case, a smart one, was needed to understand. - The point here is that the data is nothing without the proper interpreter. - Impact happens (ie decisions improve) when the right interpreter meets the right data and has the right context to do cool stuff with it. - So I think our mission as data people is to get the right data to the right people, for me thats getting data to the teams of analysts at Shopify, and for a lot of you guys its probably getting data to yourselves.
  10. This talk is about how we make impact with data

    at Shopify, and why I think maybe you should try doing it similarly.
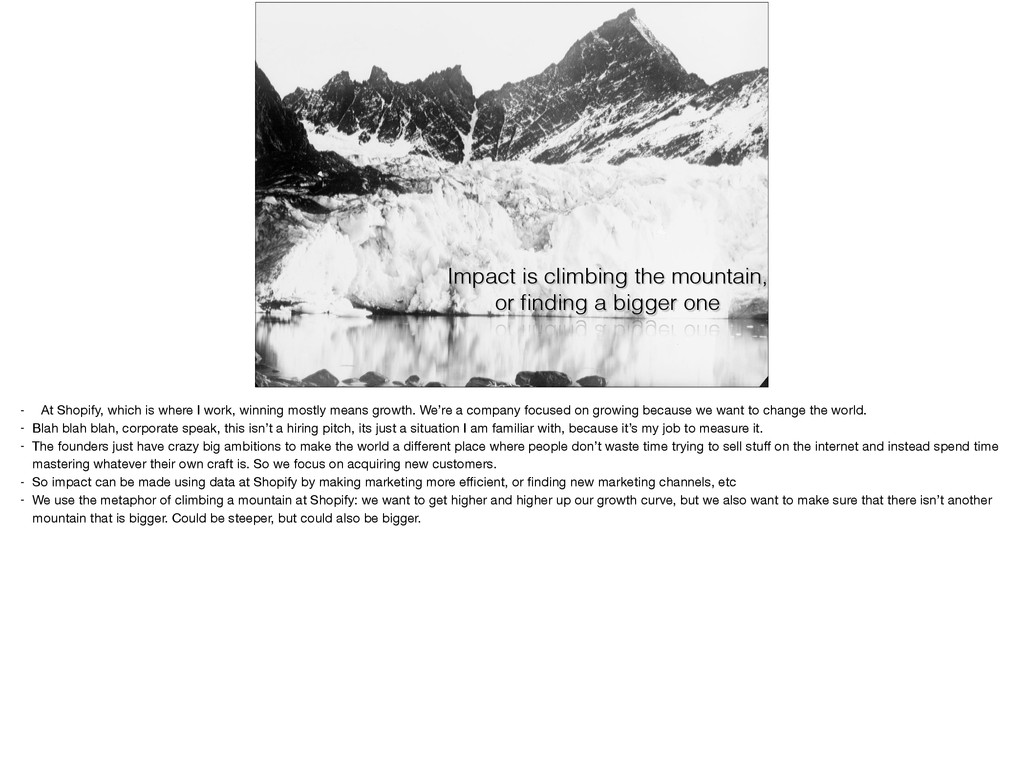
  11. Impact is climbing the mountain, or finding a bigger one

    - At Shopify, which is where I work, winning mostly means growth. We’re a company focused on growing because we want to change the world. - Blah blah blah, corporate speak, this isn’t a hiring pitch, its just a situation I am familiar with, because it’s my job to measure it. - The founders just have crazy big ambitions to make the world a different place where people don’t waste time trying to sell stuff on the internet and instead spend time mastering whatever their own craft is. So we focus on acquiring new customers. - So impact can be made using data at Shopify by making marketing more efficient, or finding new marketing channels, etc - We use the metaphor of climbing a mountain at Shopify: we want to get higher and higher up our growth curve, but we also want to make sure that there isn’t another mountain that is bigger. Could be steeper, but could also be bigger.
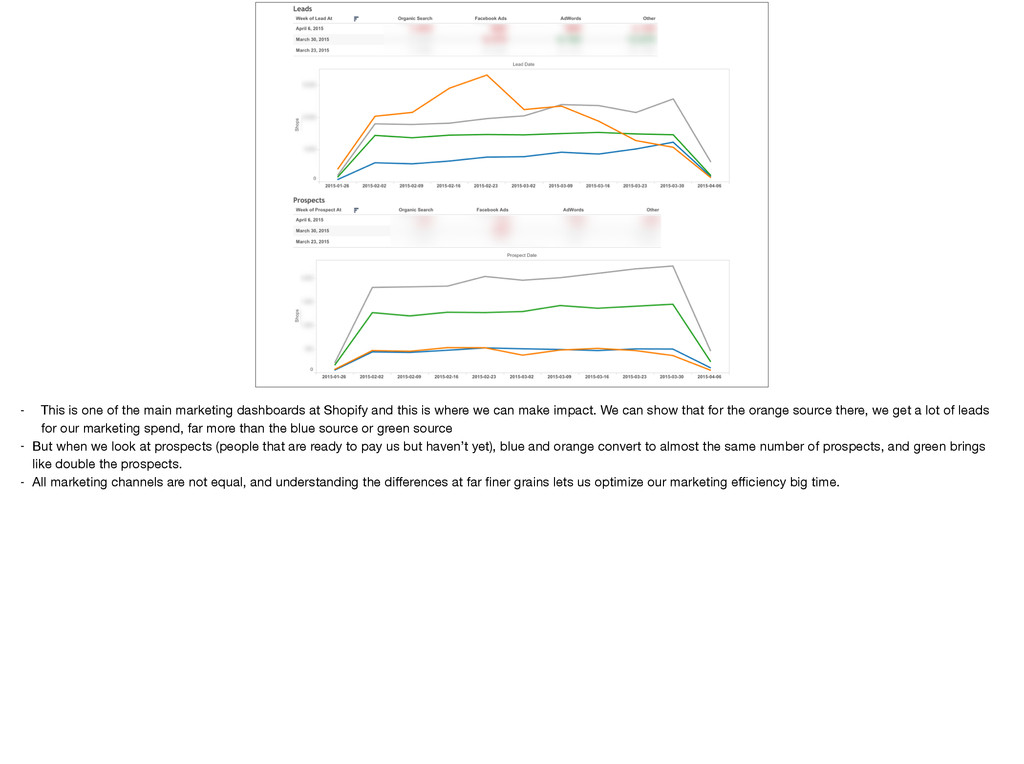
  12. - This is one of the main marketing dashboards at

    Shopify and this is where we can make impact. We can show that for the orange source there, we get a lot of leads for our marketing spend, far more than the blue source or green source - But when we look at prospects (people that are ready to pay us but haven’t yet), blue and orange convert to almost the same number of prospects, and green brings like double the prospects. - All marketing channels are not equal, and understanding the differences at far finer grains lets us optimize our marketing efficiency big time.
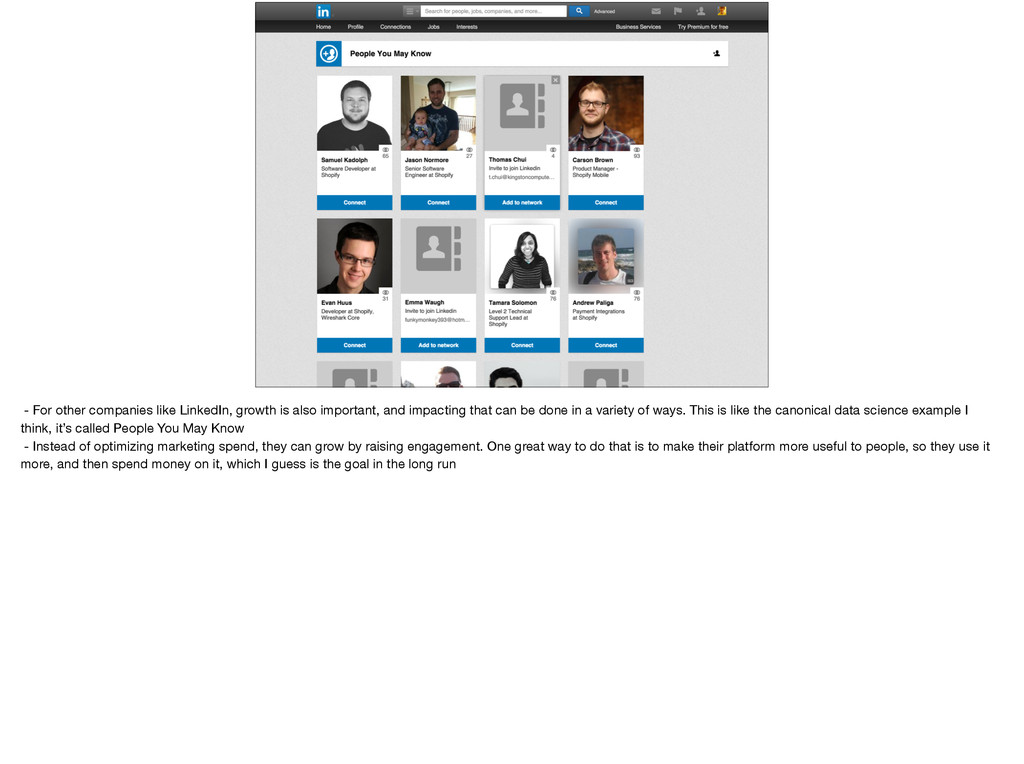
  13. - For other companies like LinkedIn, growth is also important,

    and impacting that can be done in a variety of ways. This is like the canonical data science example I think, it’s called People You May Know - Instead of optimizing marketing spend, they can grow by raising engagement. One great way to do that is to make their platform more useful to people, so they use it more, and then spend money on it, which I guess is the goal in the long run
  14. Options So I like to think about the way to

    make impact using data as being in three different options. How do we make
  15. Option A: Monitoring Drives compensation, public/legal reporting, SLAs - This

    is bean counting. - like “how many deals did you close this quarter so we know what bonus to pay you”, - or “what are your revenues, to the cent, cause I am the SEC” - This is a requirement at a lot of places for compliance or whatever - Borrrriinnnggg, low impact for high work
  16. Option B: Decision Support Where next, what next, - I

    think the big obvious one since the time of Mr Wald and his airplanes is what I call “decision support” - questions like “what market do we enter next”, “where do we spend our time trying to get more efficient”, “how do we price this”, “how do we budget this”, etc
  17. DECISION SUPPORT, AKA BUSINESS INTELLIGENCE JUST BEING LOGICAL MASTERING EXCEL

    FOR FUN AND PROFIT - aka Business Intelligence - aka Just Being Logical - aka Mastering Excel For Fun and Profit - aka Table Stakes for Data Driven Companies - Chose a hilarious enterprise-y transition for this stuff cause I feel like it is very enterprise-y. This is the like classic MBA role or whatever business accumen you think is appropriate applies here I think
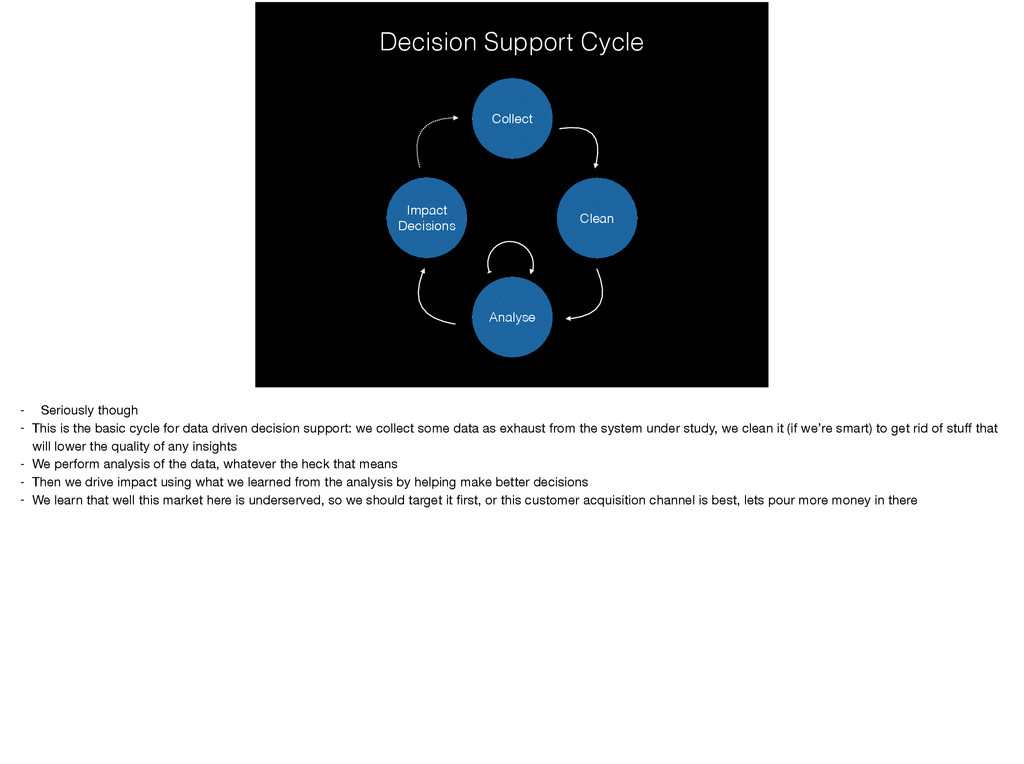
  18. Decision Support Cycle Collect Clean Analyse Impact Decisions - Seriously

    though - This is the basic cycle for data driven decision support: we collect some data as exhaust from the system under study, we clean it (if we’re smart) to get rid of stuff that will lower the quality of any insights - We perform analysis of the data, whatever the heck that means - Then we drive impact using what we learned from the analysis by helping make better decisions - We learn that well this market here is underserved, so we should target it first, or this customer acquisition channel is best, lets pour more money in there
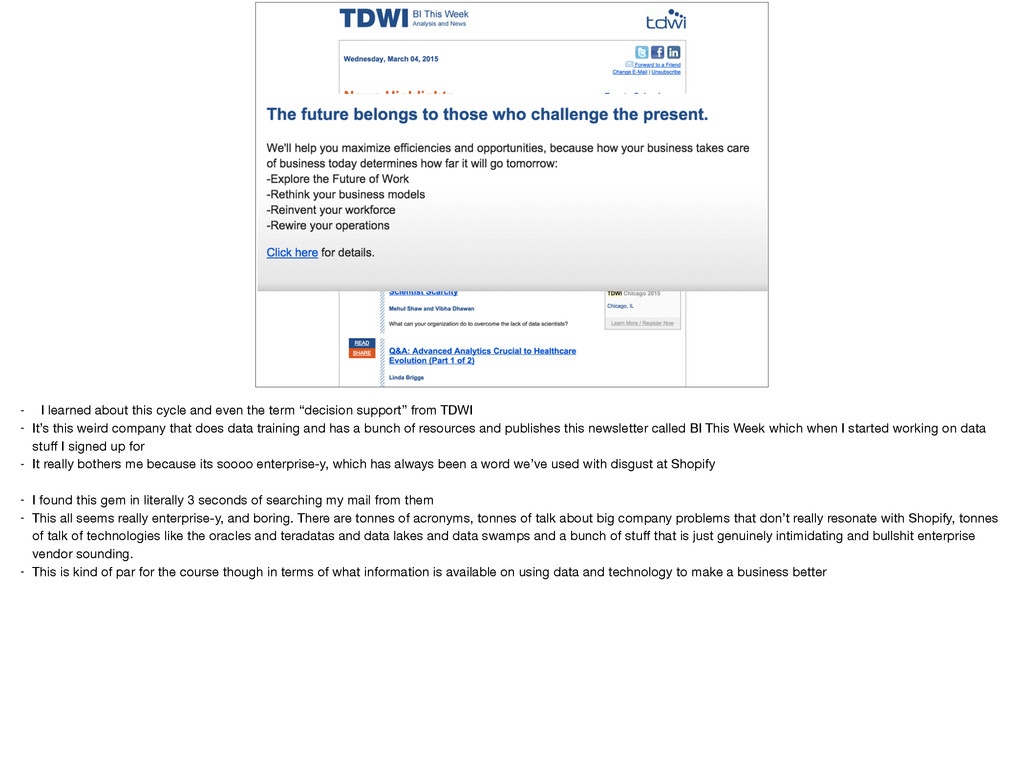
  19. - I learned about this cycle and even the term

    “decision support” from TDWI - It’s this weird company that does data training and has a bunch of resources and publishes this newsletter called BI This Week which when I started working on data stuff I signed up for - It really bothers me because its soooo enterprise-y, which has always been a word we’ve used with disgust at Shopify - I found this gem in literally 3 seconds of searching my mail from them - This all seems really enterprise-y, and boring. There are tonnes of acronyms, tonnes of talk about big company problems that don’t really resonate with Shopify, tonnes of talk of technologies like the oracles and teradatas and data lakes and data swamps and a bunch of stuff that is just genuinely intimidating and bullshit enterprise vendor sounding. - This is kind of par for the course though in terms of what information is available on using data and technology to make a business better
  20. da·ta ware·house noun (computing) a large store of data accumulated

    from a wide range of sources within a company and used to guide management decisions. - All this decision support stuff is also often known as the value you get from Data Warehousing.
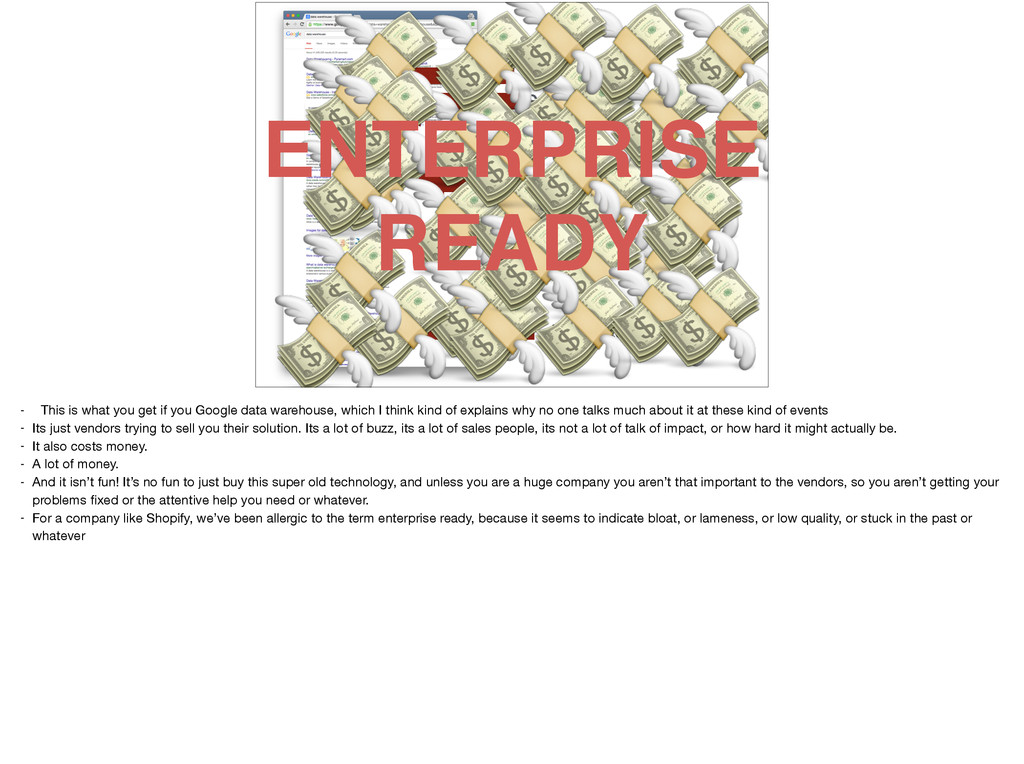
  21. Informatica Salesforce Teradata Oracle ENTERPRISE
 READY - This is what

    you get if you Google data warehouse, which I think kind of explains why no one talks much about it at these kind of events - Its just vendors trying to sell you their solution. Its a lot of buzz, its a lot of sales people, its not a lot of talk of impact, or how hard it might actually be. - It also costs money. - A lot of money. - And it isn’t fun! It’s no fun to just buy this super old technology, and unless you are a huge company you aren’t that important to the vendors, so you aren’t getting your problems fixed or the attentive help you need or whatever. - For a company like Shopify, we’ve been allergic to the term enterprise ready, because it seems to indicate bloat, or lameness, or low quality, or stuck in the past or whatever
  22. Option C: Data Products Drive up metric X, defensible, fun,

    hard! - So I think a lot of people end up turning to option B: building data products. - It isn’t just using the data the company collects to help people inside the company make better decisions, its actually codifying our understanding of the data to make the product better somehow - At Shopify we don’t do a lot of this yet, but tonnes of companies are. - This is like People You May Know on LinkedIn or Facebook. - Stripe’s fraud detection secret sauce - The ordering of the items in the Facebook news feed is a data product. - Or like SEOMoz’ whole product
  23. Data Products, aka Productionized Academic Stuff Getting paid to Kaggle

    Mastering Map Reduce for Fun and Profit - And what this comes down to is often fun stuff. It’s you against the data where your job is to build a cool thing that extracts value and delivers it. - There’s an art to it, and it can be really hard, which for a lot of people means its rewarding when you actually get something that is valuable - There’s also a huge focus on technology and computer science, which for people like me is really enticing. You get to use all these cool lego blocks to build something epic
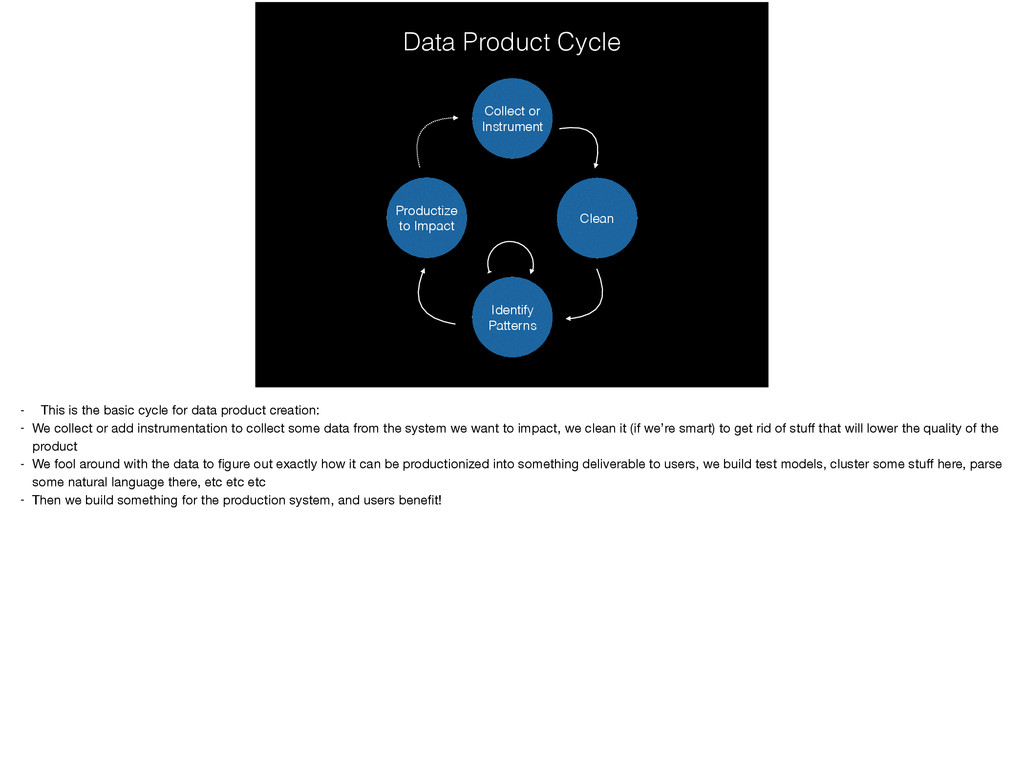
  24. Data Product Cycle Collect or Instrument Clean Identify Patterns Productize

    to Impact - This is the basic cycle for data product creation: - We collect or add instrumentation to collect some data from the system we want to impact, we clean it (if we’re smart) to get rid of stuff that will lower the quality of the product - We fool around with the data to figure out exactly how it can be productionized into something deliverable to users, we build test models, cluster some stuff here, parse some natural language there, etc etc etc - Then we build something for the production system, and users benefit!
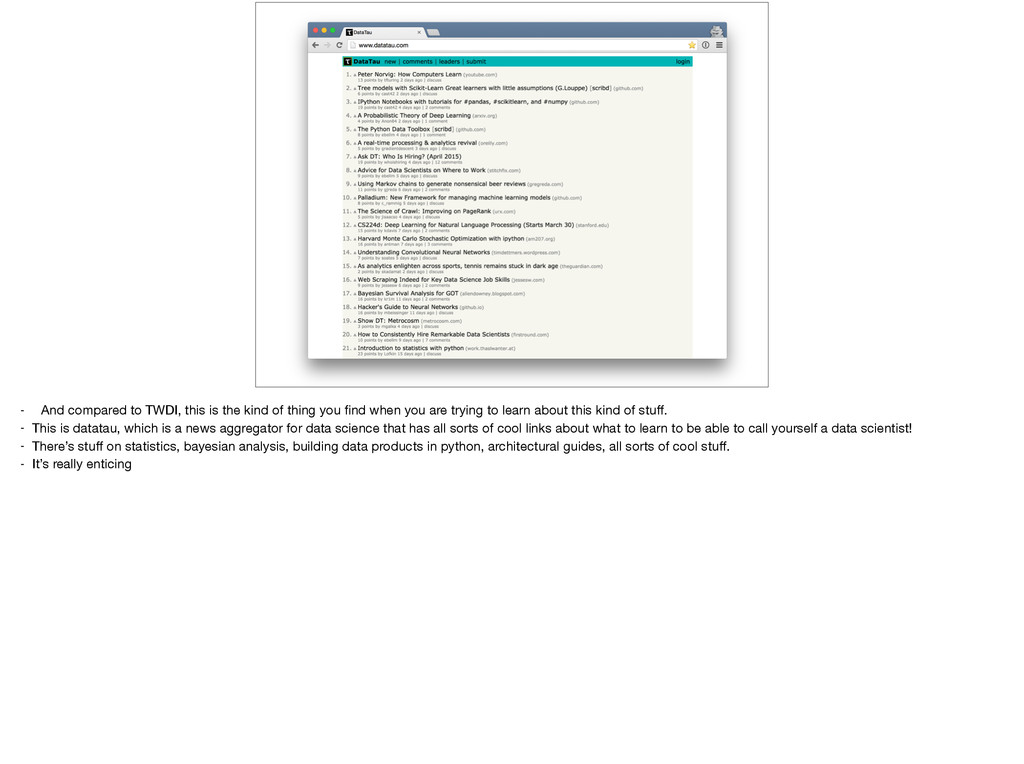
  25. - And compared to TWDI, this is the kind of

    thing you find when you are trying to learn about this kind of stuff. - This is datatau, which is a news aggregator for data science that has all sorts of cool links about what to learn to be able to call yourself a data scientist! - There’s stuff on statistics, bayesian analysis, building data products in python, architectural guides, all sorts of cool stuff. - It’s really enticing
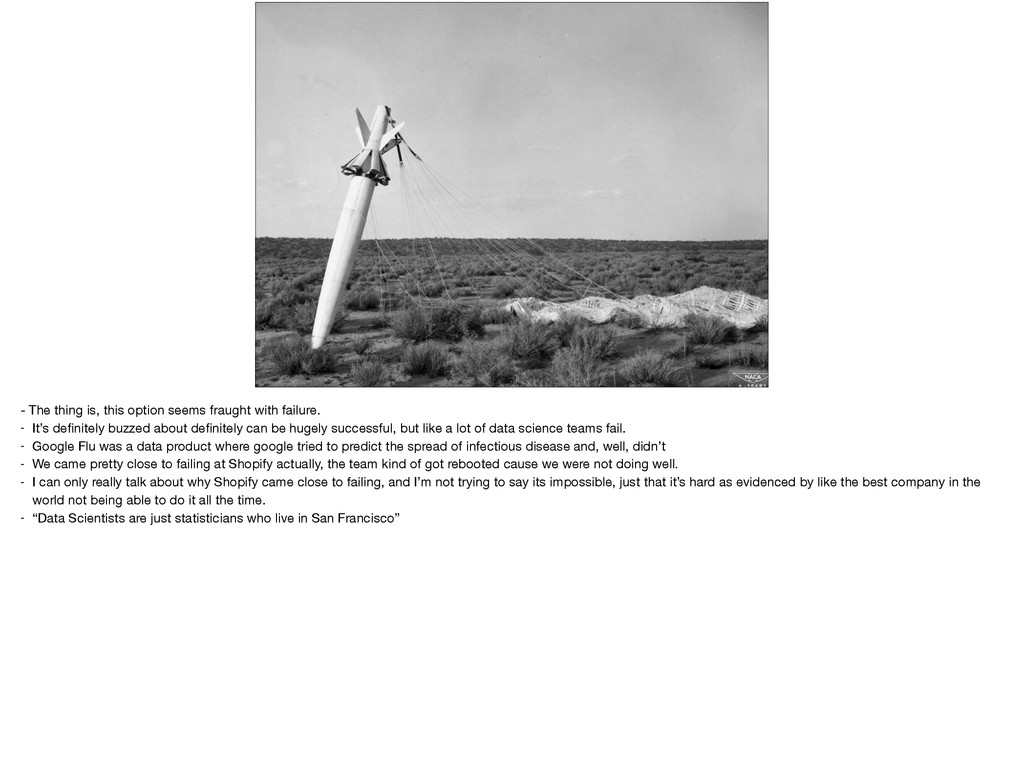
  26. - The thing is, this option seems fraught with failure.

    - It’s definitely buzzed about definitely can be hugely successful, but like a lot of data science teams fail. - Google Flu was a data product where google tried to predict the spread of infectious disease and, well, didn’t - We came pretty close to failing at Shopify actually, the team kind of got rebooted cause we were not doing well. - I can only really talk about why Shopify came close to failing, and I’m not trying to say its impossible, just that it’s hard as evidenced by like the best company in the world not being able to do it all the time. - “Data Scientists are just statisticians who live in San Francisco”
  27. So… what the heck are you saying Harry. Why aren’t

    you talking about cool stuff like Apache Spark and Kafka and the way to build things?
  28. Ya can’t do any of these things sustainably without cleaning

    the data. FARSHYSUFDB #2 - Now, here’s the main thesis of the whole thing. - You need to clean the data to do any of this. - You can’t count beans unless you define what a bean is, and you have to know what beans to filter out. - You can’t make decisions on data you have no confidence in unless they are really high level - Models are only as good as the data you pipe in, so if you don’t clean it or normalize it or bake in your understanding of what is actually right, they’ll be just as shitty as the source data - You can’t make decisions for customers on data you have no confidence in - You can’t bet your user’s time on inaccurate, useless models, because their engagement has opportunity cost - You need to deliver all these things which confidence, and to do that, you need to clean the data.
  29. GMV at Shopify: 12 cases, 4 months, 3 people -

    I will go through a quick example for Shopify - We measure our business in one way using a metric called GMV, or Gross Merchandise Value. It’s the amount of stuff we’ve facilitated the purchase of through our platform, the amount of dollars that move through us. We don’t make the money, but we helped move it, and for a payments platform this is a great indicator of growth and value to the people on top of us. - To compute GMV is one of the hardest things we’ve had to do on the data team. You’d think you’d just have to sum up the orders.total_amount column, but lol, no. - It took a person year to untangle our historic data to even get to a reasonable degree of confidence we had a reliable number that Finance would accept. - The problems weren’t overly complicated, but there were many, and it required massive coordination and determination to actually fix. - A good example is mobile app developer’s test stores: Alan the iOS dev at Shopify opens himself a test store to test a live transaction, and like a good dev goes to test the edge case of a billion dollars or whatever big number should or shouldn’t work. So he runs a $1B transaction, marks it as cash, it works, and he goes on his way. His store isn’t listed anywhere as a staff store, it was on a trial at the time or whatever, and so when we include that in the sum, things go crazy. Now we need to filter this out somehow. - Any bug our platform ever had, any test data anyone forgot to mark as test, any new features that were never backfilled to the old data, any of that shit bubbles up into the raw data, and needs to be cleaned away.
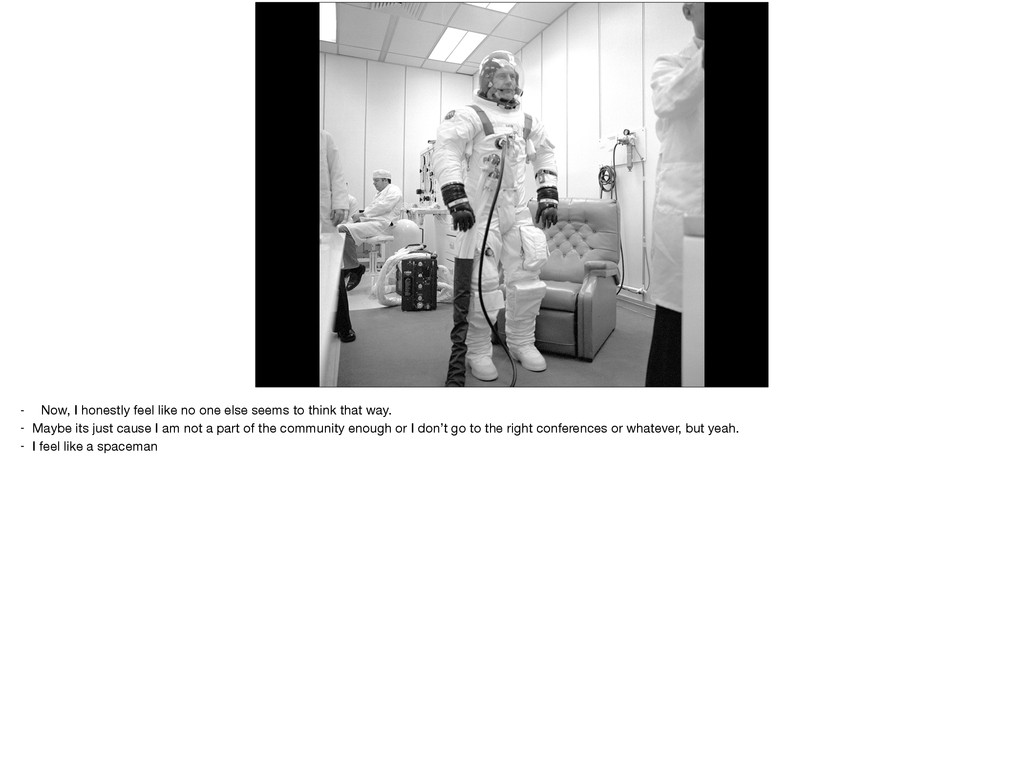
  30. - Now, I honestly feel like no one else seems

    to think that way. - Maybe its just cause I am not a part of the community enough or I don’t go to the right conferences or whatever, but yeah. - I feel like a spaceman
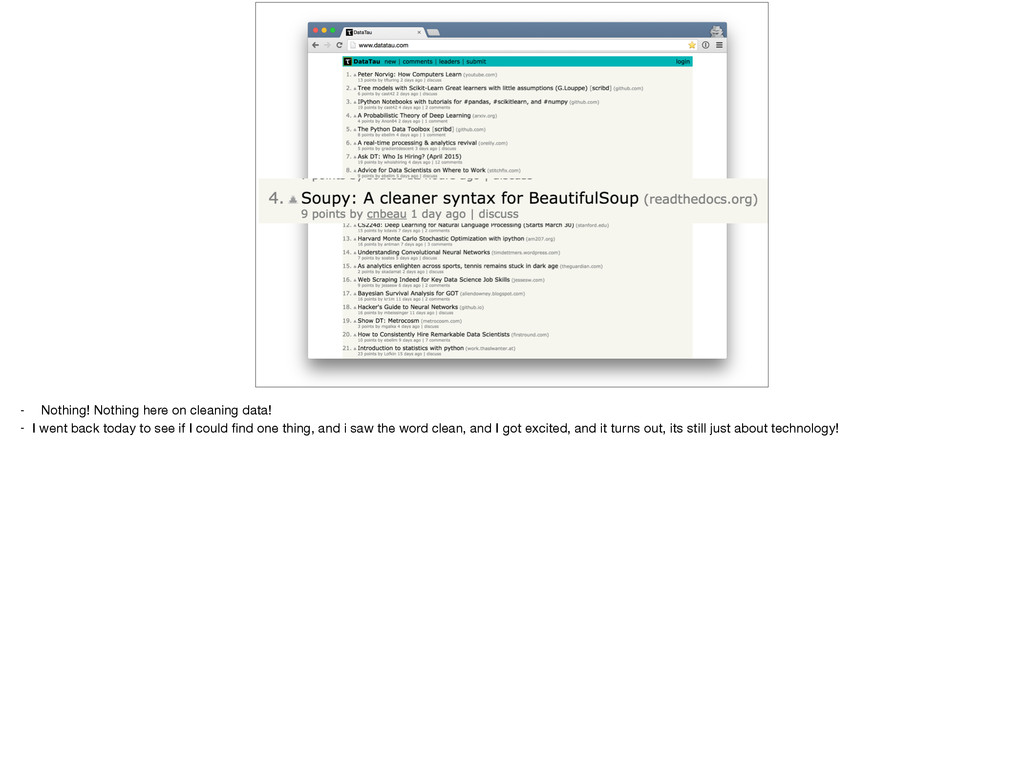
  31. - Nothing! Nothing here on cleaning data! - I went

    back today to see if I could find one thing, and i saw the word clean, and I got excited, and it turns out, its still just about technology!
  32. Collect or Instrument Clean Identify Patterns Productize to Impact Analyse

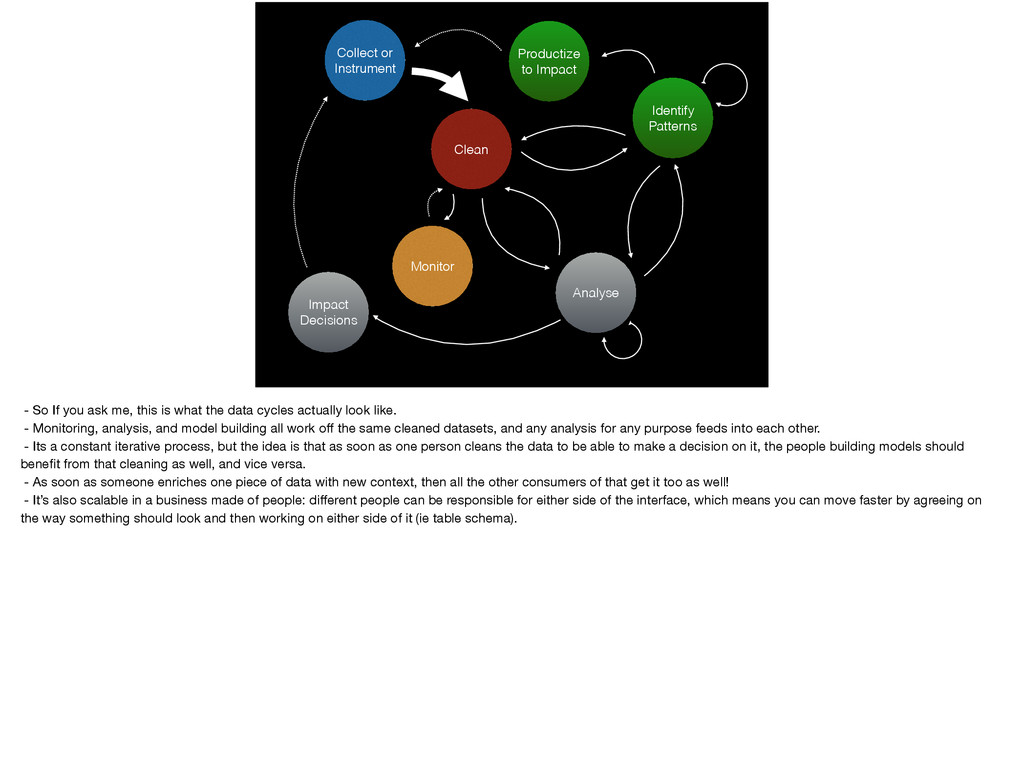
    Impact Decisions Monitor - So If you ask me, this is what the data cycles actually look like. - Monitoring, analysis, and model building all work off the same cleaned datasets, and any analysis for any purpose feeds into each other. - Its a constant iterative process, but the idea is that as soon as one person cleans the data to be able to make a decision on it, the people building models should benefit from that cleaning as well, and vice versa. - As soon as someone enriches one piece of data with new context, then all the other consumers of that get it too as well! - It’s also scalable in a business made of people: different people can be responsible for either side of the interface, which means you can move faster by agreeing on the way something should look and then working on either side of it (ie table schema).
  33. Datasets are abstractions, and abstracting gets you exponential impact from

    linear work. FARSHYSUFDB #3 - So this leads me to my next big grand thesis: datasets are abstractions, just like any other inside your organization. - You build it once, and then many people can consume it for different things you never imagined when you built it at the start. - By building all three options for impact, you end up with a bunch of dependencies, and you need to think about the architecture of those dependencies, the couplings, and where to fix problems
  34. There is already a huge school of thought for how

    to structure your data and build these dependencies! - Now, the best part is that a bunch of people have been doing this for a long time! - Namely, those enterprise people I eschewed for so long.
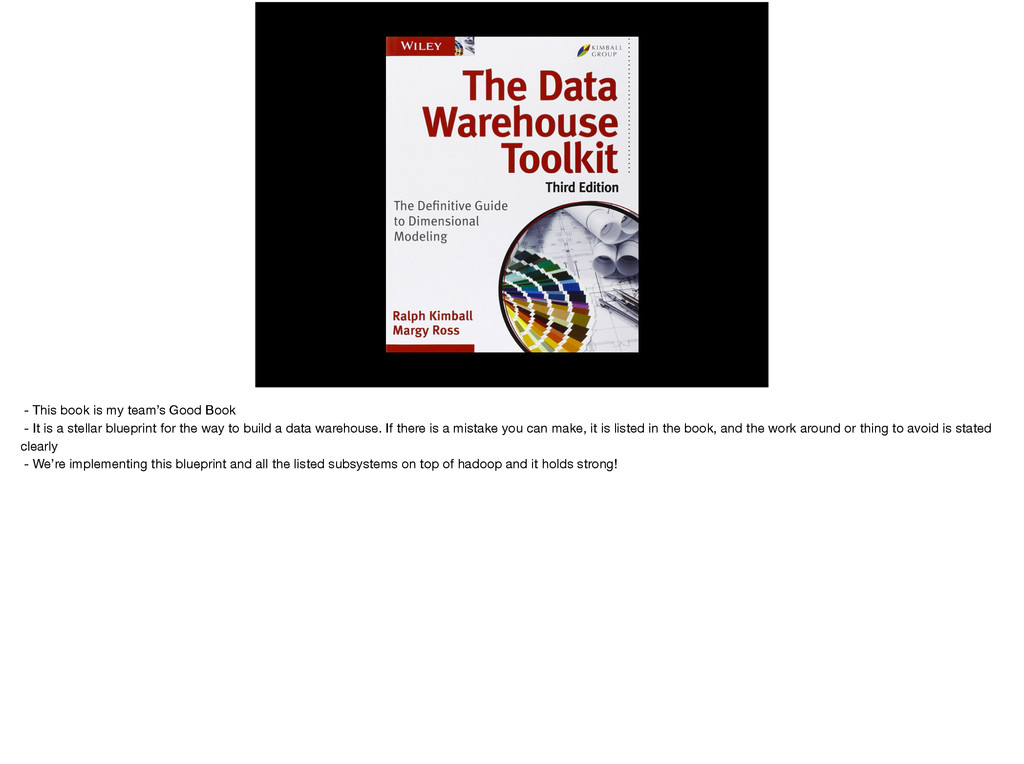
  35. - This book is my team’s Good Book - It

    is a stellar blueprint for the way to build a data warehouse. If there is a mistake you can make, it is listed in the book, and the work around or thing to avoid is stated clearly - We’re implementing this blueprint and all the listed subsystems on top of hadoop and it holds strong!
  36. - Regardless of what school of thought you subscribe to

    or who you listen to when deciding how to build this stuff, - The point I’m trying to make here is that the design of your data’s shape is a thing you need to care about deeply. - It is a design challenge just like any other: you need to make a thing that humans want to use. - You need to create elements that humans can compose to create something greater than the sum of the elements.
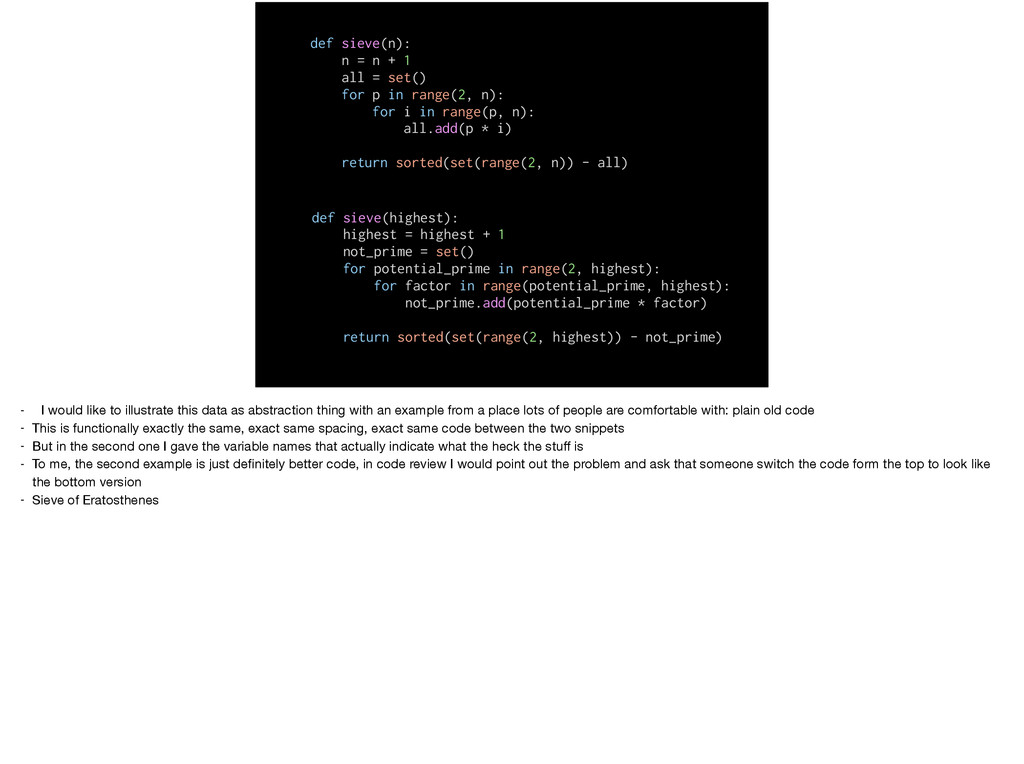
  37. def sieve(n): n = n + 1 all = set()

    for p in range(2, n): for i in range(p, n): all.add(p * i) return sorted(set(range(2, n)) - all) def sieve(highest): highest = highest + 1 not_prime = set() for potential_prime in range(2, highest): for factor in range(potential_prime, highest): not_prime.add(potential_prime * factor) return sorted(set(range(2, highest)) - not_prime) - I would like to illustrate this data as abstraction thing with an example from a place lots of people are comfortable with: plain old code - This is functionally exactly the same, exact same spacing, exact same code between the two snippets - But in the second one I gave the variable names that actually indicate what the heck the stuff is - To me, the second example is just definitely better code, in code review I would point out the problem and ask that someone switch the code form the top to look like the bottom version - Sieve of Eratosthenes
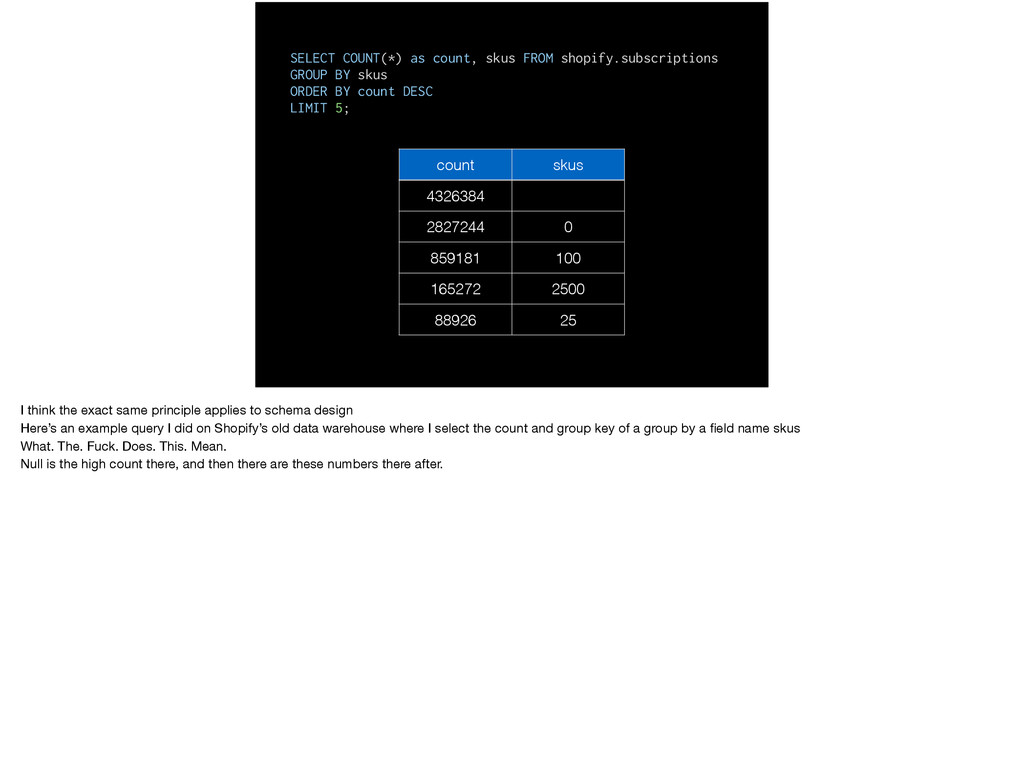
  38. SELECT COUNT(*) as count, skus FROM shopify.subscriptions GROUP BY skus

    ORDER BY count DESC LIMIT 5; count skus 4326384 2827244 0 859181 100 165272 2500 88926 25 I think the exact same principle applies to schema design Here’s an example query I did on Shopify’s old data warehouse where I select the count and group key of a group by a field name skus What. The. Fuck. Does. This. Mean. Null is the high count there, and then there are these numbers there after.
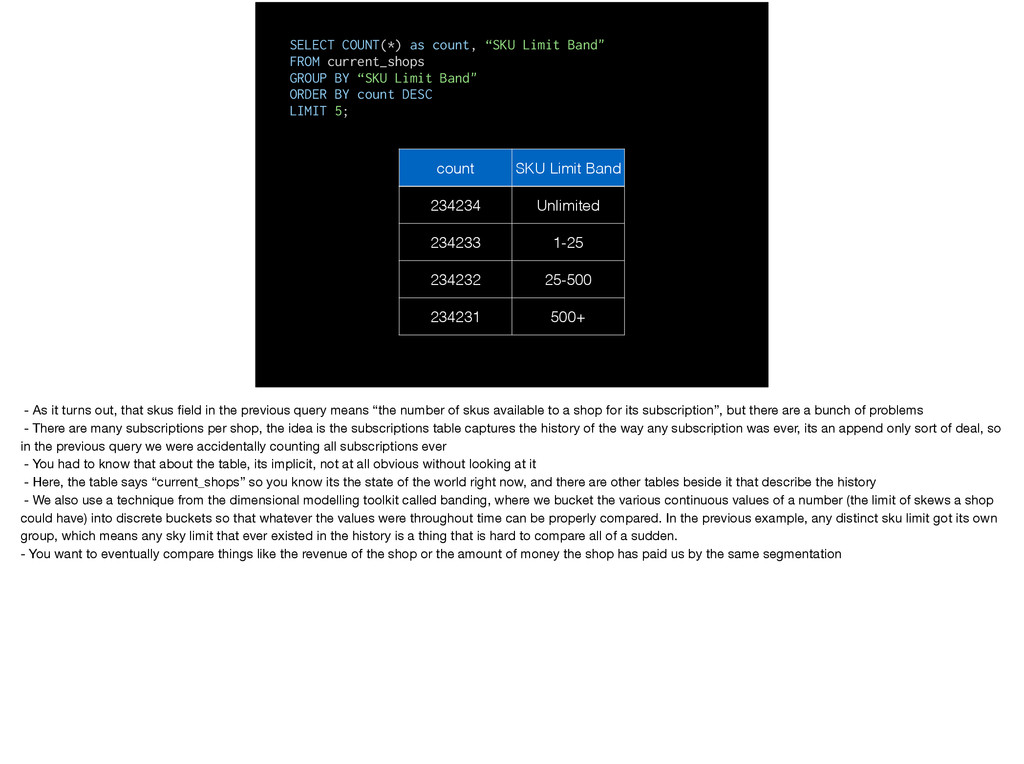
  39. SELECT COUNT(*) as count, “SKU Limit Band" FROM current_shops GROUP

    BY “SKU Limit Band" ORDER BY count DESC LIMIT 5; count SKU Limit Band 234234 Unlimited 234233 1-25 234232 25-500 234231 500+ - As it turns out, that skus field in the previous query means “the number of skus available to a shop for its subscription”, but there are a bunch of problems - There are many subscriptions per shop, the idea is the subscriptions table captures the history of the way any subscription was ever, its an append only sort of deal, so in the previous query we were accidentally counting all subscriptions ever - You had to know that about the table, its implicit, not at all obvious without looking at it - Here, the table says “current_shops” so you know its the state of the world right now, and there are other tables beside it that describe the history - We also use a technique from the dimensional modelling toolkit called banding, where we bucket the various continuous values of a number (the limit of skews a shop could have) into discrete buckets so that whatever the values were throughout time can be properly compared. In the previous example, any distinct sku limit got its own group, which means any sky limit that ever existed in the history is a thing that is hard to compare all of a sudden. - You want to eventually compare things like the revenue of the shop or the amount of money the shop has paid us by the same segmentation
  40. So, are you going to clean at query time or

    before then? aside if we have time Aside if we have time: when to clean the data is an important issue
  41. - Things like drill and a few other hadoop projects

    encourage you to just “get your data into hadoop”
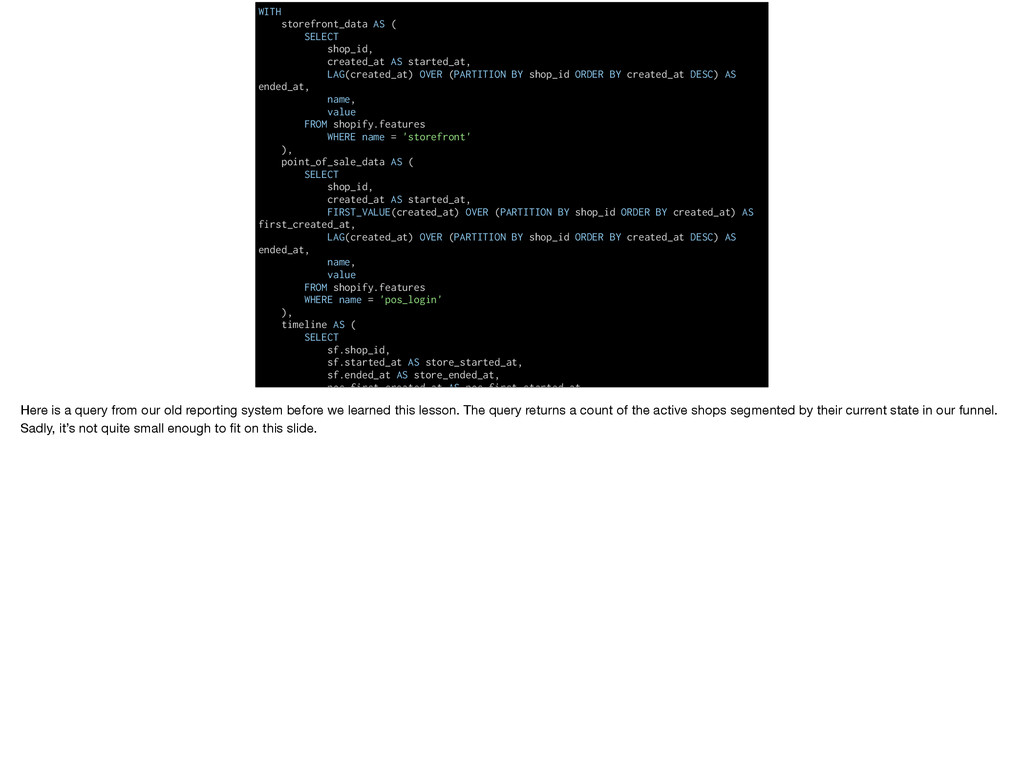
  42. WITH storefront_data AS ( SELECT shop_id, created_at AS started_at, LAG(created_at)

    OVER (PARTITION BY shop_id ORDER BY created_at DESC) AS ended_at, name, value FROM shopify.features WHERE name = 'storefront' ), point_of_sale_data AS ( SELECT shop_id, created_at AS started_at, FIRST_VALUE(created_at) OVER (PARTITION BY shop_id ORDER BY created_at) AS first_created_at, LAG(created_at) OVER (PARTITION BY shop_id ORDER BY created_at DESC) AS ended_at, name, value FROM shopify.features WHERE name = 'pos_login' ), timeline AS ( SELECT sf.shop_id, sf.started_at AS store_started_at, sf.ended_at AS store_ended_at, pos.first_created_at AS pos_first_started_at, Here is a query from our old reporting system before we learned this lesson. The query returns a count of the active shops segmented by their current state in our funnel. Sadly, it’s not quite small enough to fit on this slide.
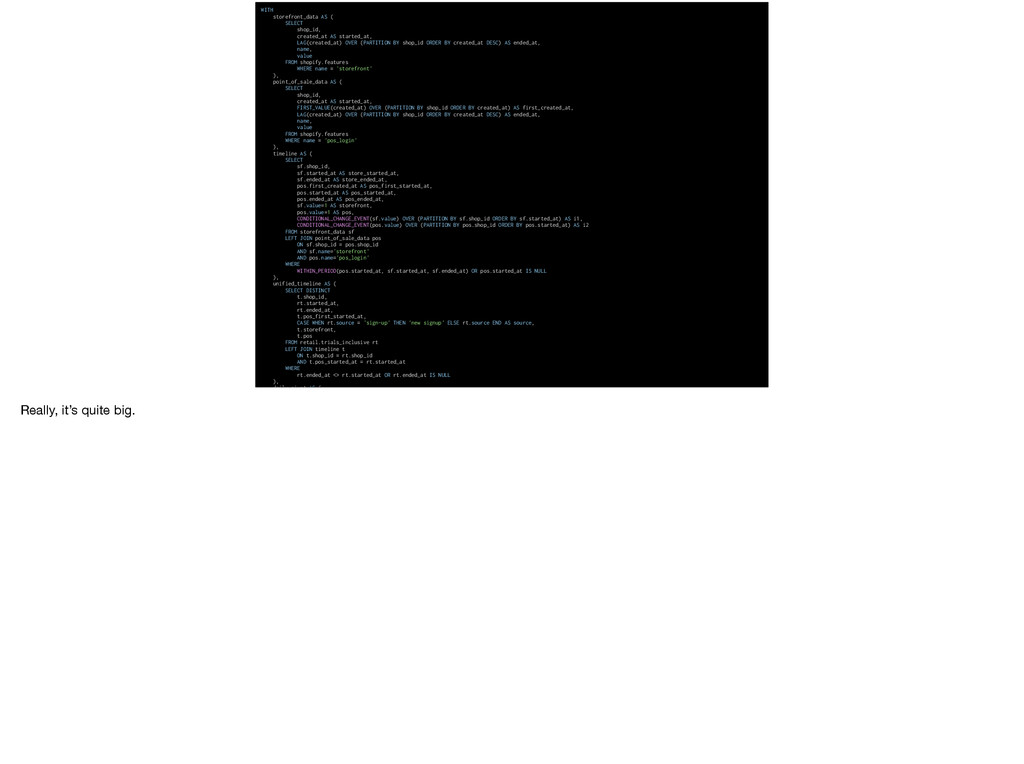
  43. WITH storefront_data AS ( SELECT shop_id, created_at AS started_at, LAG(created_at)

    OVER (PARTITION BY shop_id ORDER BY created_at DESC) AS ended_at, name, value FROM shopify.features WHERE name = 'storefront' ), point_of_sale_data AS ( SELECT shop_id, created_at AS started_at, FIRST_VALUE(created_at) OVER (PARTITION BY shop_id ORDER BY created_at) AS first_created_at, LAG(created_at) OVER (PARTITION BY shop_id ORDER BY created_at DESC) AS ended_at, name, value FROM shopify.features WHERE name = 'pos_login' ), timeline AS ( SELECT sf.shop_id, sf.started_at AS store_started_at, sf.ended_at AS store_ended_at, pos.first_created_at AS pos_first_started_at, pos.started_at AS pos_started_at, pos.ended_at AS pos_ended_at, sf.value=1 AS storefront, pos.value=1 AS pos, CONDITIONAL_CHANGE_EVENT(sf.value) OVER (PARTITION BY sf.shop_id ORDER BY sf.started_at) AS i1, CONDITIONAL_CHANGE_EVENT(pos.value) OVER (PARTITION BY pos.shop_id ORDER BY pos.started_at) AS i2 FROM storefront_data sf LEFT JOIN point_of_sale_data pos ON sf.shop_id = pos.shop_id AND sf.name='storefront' AND pos.name='pos_login' WHERE WITHIN_PERIOD(pos.started_at, sf.started_at, sf.ended_at) OR pos.started_at IS NULL ), unified_timeline AS ( SELECT DISTINCT t.shop_id, rt.started_at, rt.ended_at, t.pos_first_started_at, CASE WHEN rt.source = 'sign-up' THEN 'new signup' ELSE rt.source END AS source, t.storefront, t.pos FROM retail.trials_inclusive rt LEFT JOIN timeline t ON t.shop_id = rt.shop_id AND t.pos_started_at = rt.started_at WHERE rt.ended_at <> rt.started_at OR rt.ended_at IS NULL ), daily_pivot AS ( Really, it’s quite big.
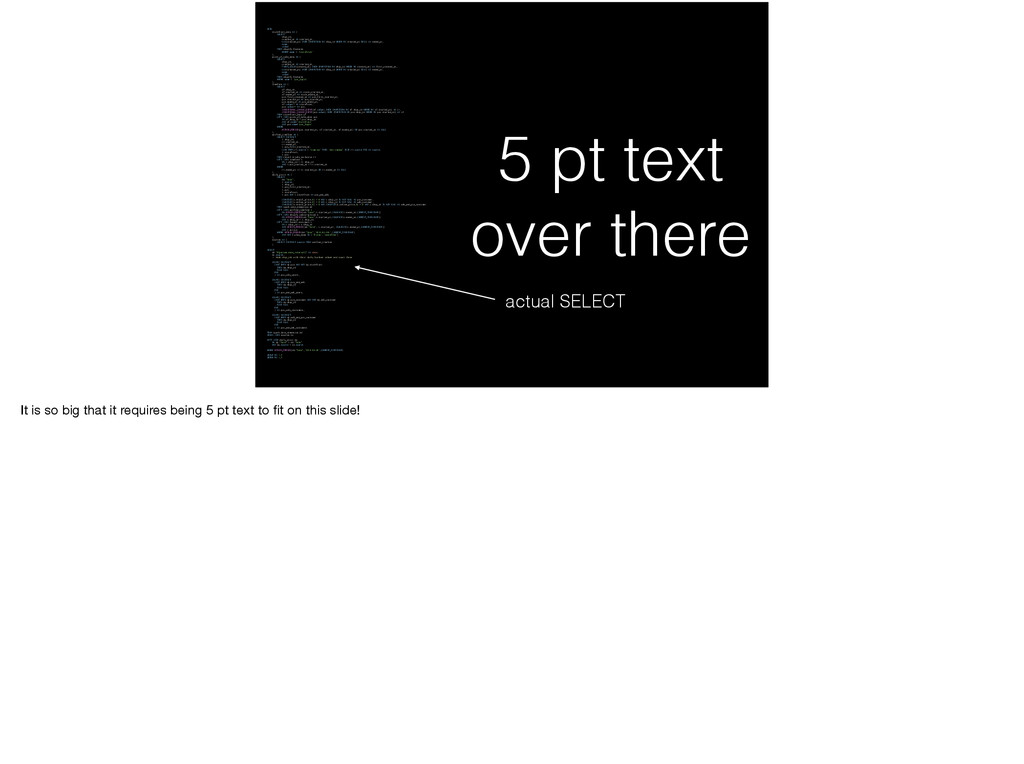
  44. WITH storefront_data AS ( SELECT shop_id, created_at AS started_at, LAG(created_at)

    OVER (PARTITION BY shop_id ORDER BY created_at DESC) AS ended_at, name, value FROM shopify.features WHERE name = 'storefront' ), point_of_sale_data AS ( SELECT shop_id, created_at AS started_at, FIRST_VALUE(created_at) OVER (PARTITION BY shop_id ORDER BY created_at) AS first_created_at, LAG(created_at) OVER (PARTITION BY shop_id ORDER BY created_at DESC) AS ended_at, name, value FROM shopify.features WHERE name = 'pos_login' ), timeline AS ( SELECT sf.shop_id, sf.started_at AS store_started_at, sf.ended_at AS store_ended_at, pos.first_created_at AS pos_first_started_at, pos.started_at AS pos_started_at, pos.ended_at AS pos_ended_at, sf.value=1 AS storefront, pos.value=1 AS pos, CONDITIONAL_CHANGE_EVENT(sf.value) OVER (PARTITION BY sf.shop_id ORDER BY sf.started_at) AS i1, CONDITIONAL_CHANGE_EVENT(pos.value) OVER (PARTITION BY pos.shop_id ORDER BY pos.started_at) AS i2 FROM storefront_data sf LEFT JOIN point_of_sale_data pos ON sf.shop_id = pos.shop_id AND sf.name='storefront' AND pos.name='pos_login' WHERE WITHIN_PERIOD(pos.started_at, sf.started_at, sf.ended_at) OR pos.started_at IS NULL ), unified_timeline AS ( SELECT DISTINCT t.shop_id, rt.started_at, rt.ended_at, t.pos_first_started_at, CASE WHEN rt.source = 'sign-up' THEN 'new signup' ELSE rt.source END AS source, t.storefront, t.pos FROM retail.trials_inclusive rt LEFT JOIN timeline t ON t.shop_id = rt.shop_id AND t.pos_started_at = rt.started_at WHERE rt.ended_at <> rt.started_at OR rt.ended_at IS NULL ), daily_pivot AS ( SELECT dd."Date", t.source, t.shop_id, t.pos_first_started_at, t.pos, t.storefront, t.pos AND t.storefront AS pos_and_web, COALESCE(s.retail_price,0) > 0 AND c.shop_id IS NOT NULL AS pos_customer, COALESCE(s.online_price,0) > 0 AND c.shop_id IS NOT NULL AS web_customer, COALESCE(s.retail_price,0) > 0 AND COALESCE(s.online_price,0) > 0 AND c.shop_id IS NOT NULL AS web_and_pos_customer FROM spark.date_dimension dd LEFT JOIN unified_timeline t ON WITHIN_PERIOD(dd."Date",t.started_at,COALESCE(t.ended_at,CURRENT_TIMESTAMP)) LEFT JOIN shopify.subscriptions s ON WITHIN_PERIOD(dd."Date",s.started_at,COALESCE(s.ended_at,CURRENT_TIMESTAMP)) AND s.shop_id = t.shop_id LEFT JOIN funnel.customers c ON c.shop_id = s.shop_id AND WITHIN_PERIOD(dd."Date", c.started_at, COALESCE(c.ended_at,CURRENT_TIMESTAMP)) AND c.active WHERE WITHIN_PERIOD(dd."Date",'2014-03-24=',CURRENT_TIMESTAMP) AND NOT s.plan_name IN ('frozen','cancelled') ), sources AS ( SELECT DISTINCT source FROM unified_timeline ) SELECT dd."#{params.date_interval}" AS date, ss.source, -- Hash shop_ids with their daily boolean values and count those COUNT( DISTINCT CASE WHEN dp.pos AND NOT dp.storefront THEN dp.shop_id ELSE NULL END ) AS pos_only_users, COUNT( DISTINCT CASE WHEN dp.pos_and_web THEN dp.shop_id ELSE NULL END ) AS pos_and_web_users, COUNT( DISTINCT CASE WHEN dp.pos_customer AND NOT dp.web_customer THEN dp.shop_id ELSE NULL END ) AS pos_only_customers, COUNT( DISTINCT CASE WHEN dp.web_and_pos_customer THEN dp.shop_id ELSE NULL END ) AS pos_and_web_customers FROM spark.date_dimension dd CROSS JOIN sources ss LEFT JOIN daily_pivot dp ON dp."Date" = dd."Date" AND dp.source = ss.source WHERE WITHIN_PERIOD(dd."Date",'2014-03-20',CURRENT_TIMESTAMP) GROUP BY 1,2 ORDER BY 1,2 5 pt text over there actual SELECT It is so big that it requires being 5 pt text to fit on this slide!
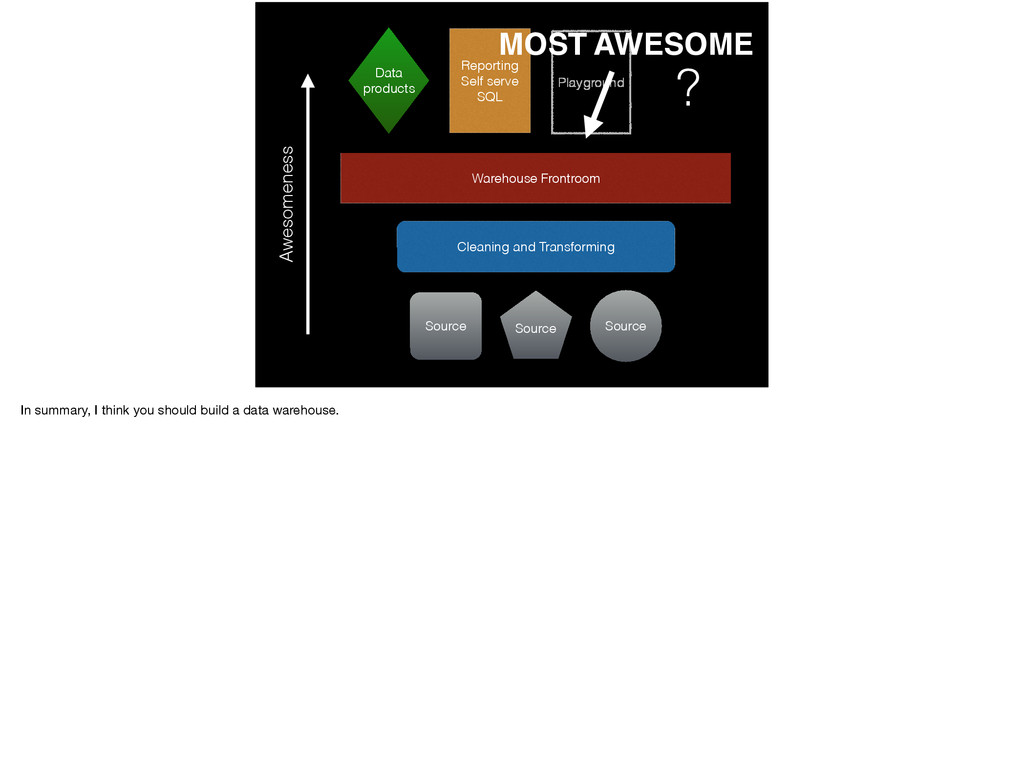
  45. Warehouse Frontroom Source Source Source Cleaning and Transforming Data products

    Reporting Self serve SQL Playground Awesomeness ? MOST AWESOME In summary, I think you should build a data warehouse.