Upgrade to Pro — share decks privately, control downloads, hide ads and more …

Server Monitoring (scaling while bootstrapped)

Ajibz
April 30, 2016

Server Monitoring (scaling while bootstrapped)

Sharing our experience with scaling our news startup while bootstrapped.

Ajibz

April 30, 2016
Tweet

More Decks by Ajibz

Other Decks in Technology

Transcript

  1. Before before... 1 server for everything -1 users J2ME only

    What throughput! Cloudinary as CDN Deployment fails High costs, ignorance is very expensive
  2. Now 5+ servers Hundreds of thousands of users Multi Platform

    apps 18000 req/min throughput Cloudflare as CDN Deployments with zero downtime Managed costs
  3. Server Stack 1 load balancer (layer 4, high availability, failover*)

    3 web servers (vertically & horizontally scalable) 1 database server (replication*, redundancy*) 1 staging server $65 monthly serving over 100 million requests Cloudflare secret weapon, caches static requests (70%).
  4. Technology Stack Haproxy (load balancer) Nginx, Php-fpm (web server, php

    interpreter) Phalcon, Php-Resque (framework, scheduler) Redis, MongoDB, MariaDB (in-memory cache, datastores) Git (BitBucket), Packer, Ansible (server provisioning, code provisioning) SetCronJob, CloudFlare, Fastly (3rd party)
  5. Why Iaas not Paas? All about the pricing page! Bandwidth

    costs too high Code optimizations are hidden behind computing power Mission critical? Offload to PaaS selectively, e.g. Parse EOL, death by acquisition...
  6. Why monitor? Get Visibility Improve usability & stability Complicated technology

    stacks with hard to trace errors Mission critical More sleep!
  7. Server Metrics (infrastructure) Ram usage, spikes Bandwidth usage, highs vs

    lows CPU usage over time, peak usage Disk I/O Open source vs Saas Free mostly
  8. Tech Stack (Application Performance Monitoring) Request throughput Resource usage Service

    Health Database monitoring Infrastructure bottlenecks Failure Alerts Code Errors High level overview with deep dive
  9. Log Tracking Better way to tail -f Http stack errors

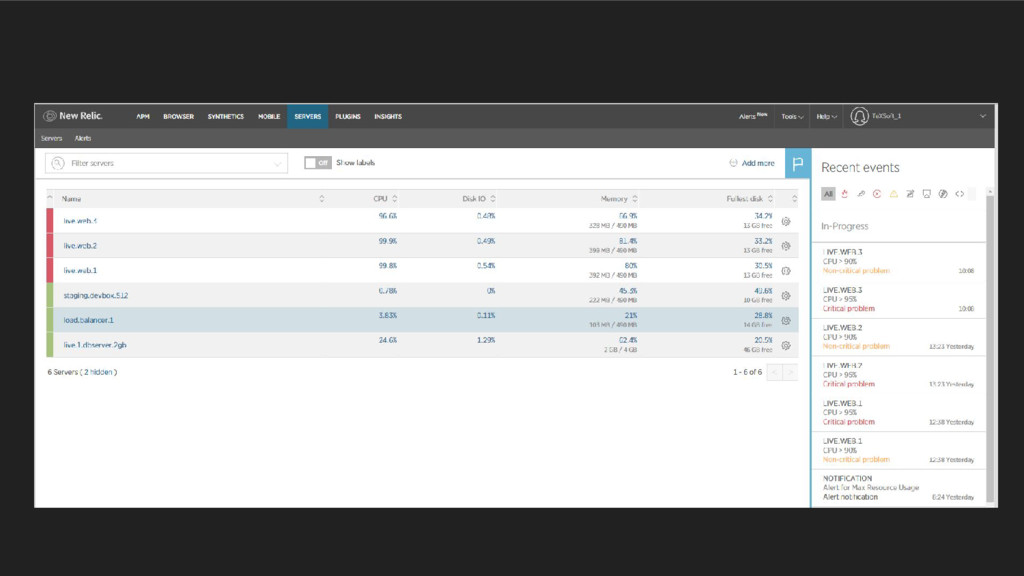
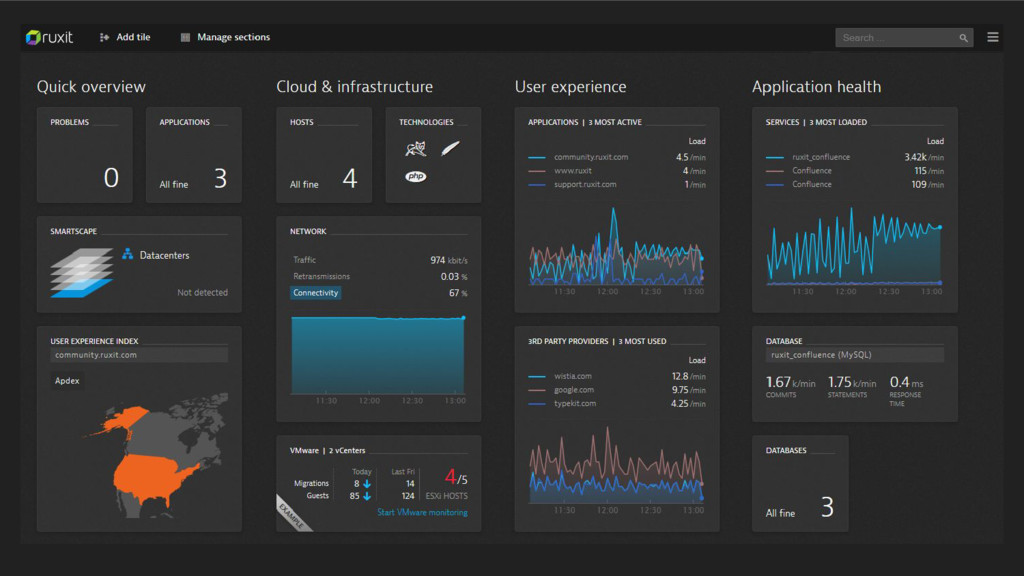
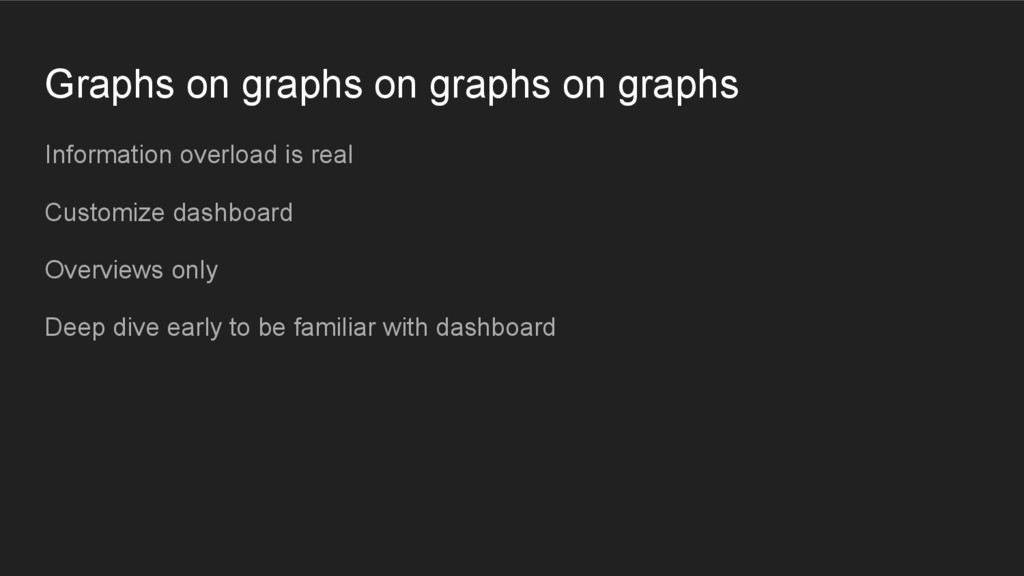
    & anomalies Multiple log files from diff services Manual tailing is difficult Get pre configured graphs based on logs All server traffic is logged, access_log
  10. Client Errors (Mobile) Client side stack traces post deployment Valuable

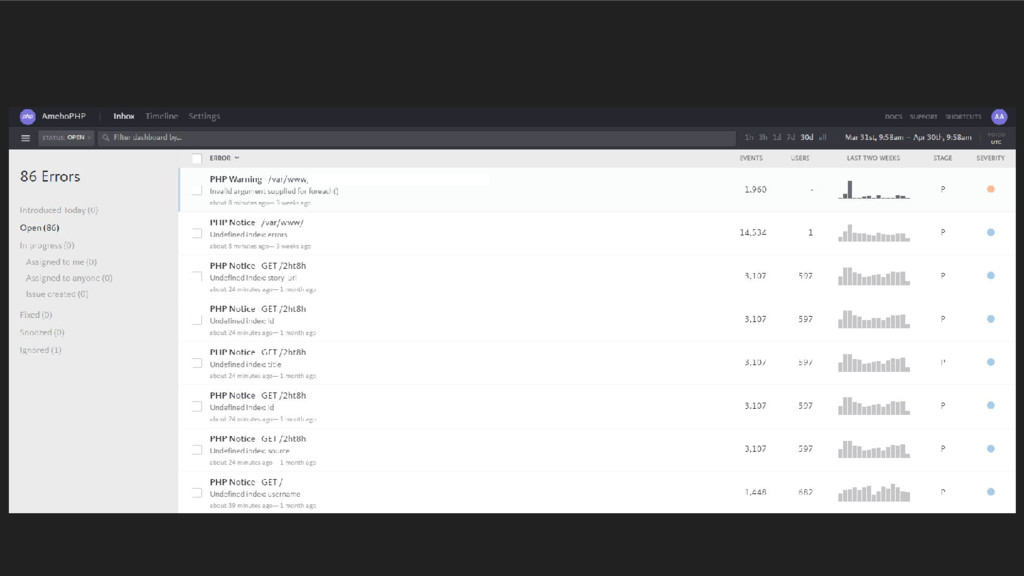
    version & device insight Very handy at debug time & post Catch all errors …. mostly Memory leaks & stack traces 3rd party library errors or platform errors
  11. Open Source vs Proprietary Vendor lockin Community support DIY vs

    training Industry standards & experience Fault tolerance Enterprise customer experience
  12. 3rd Party vs Native monitoring tools Core business? Pricing again!

    Support lifecycle and responsiveness Product version, beta or 5.0? Dashboard simplicity Security implications? firewalled? https? localhost only? Install certs?
  13. What now? Congratulations, you reward is more work! Customize alerts

    Fix errors Webhooks Send to slack Ignore at own risk
  14. Graphs on graphs on graphs on graphs Information overload is

    real Customize dashboard Overviews only Deep dive early to be familiar with dashboard
  15. Conclusion Why Monitor What to Monitor How to monitor Pricing

    Dashboards Discuss your stack with peers