Graph Art with Charts API – Beyond Data Visualization
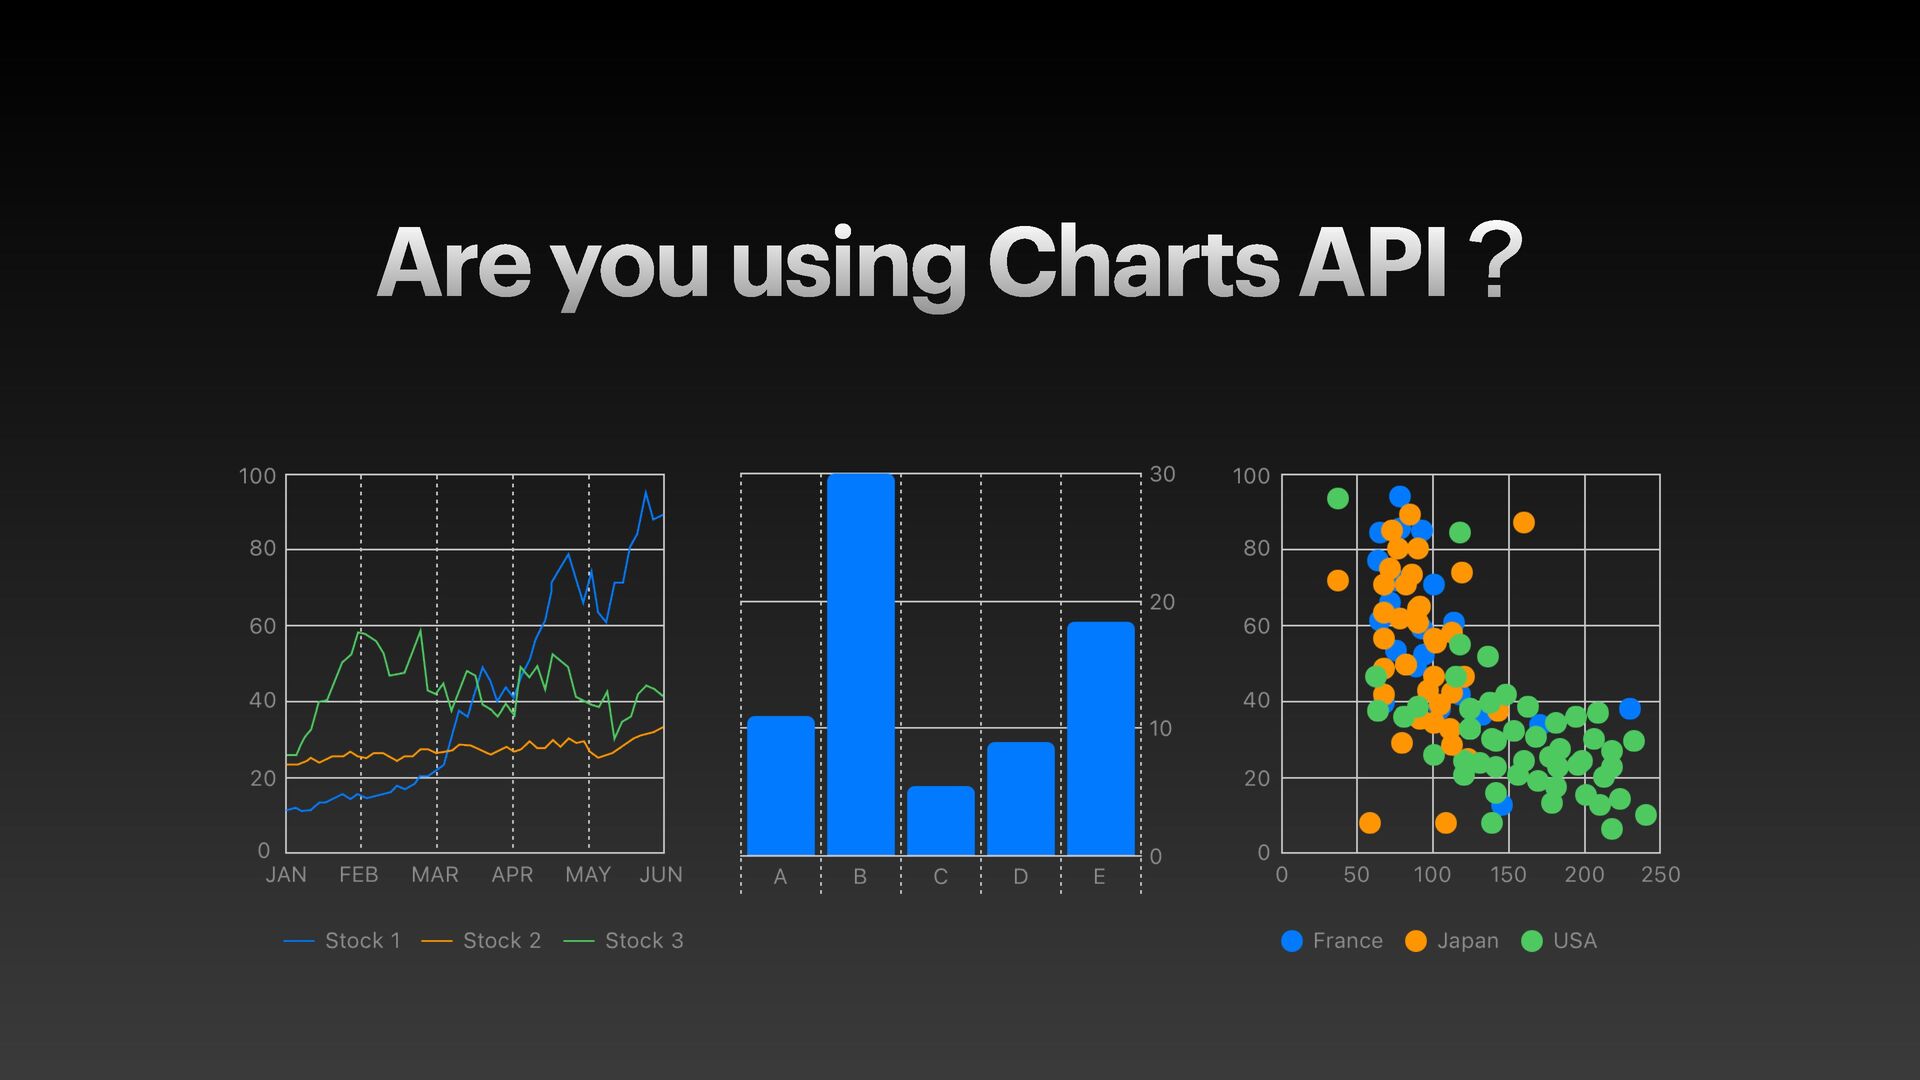
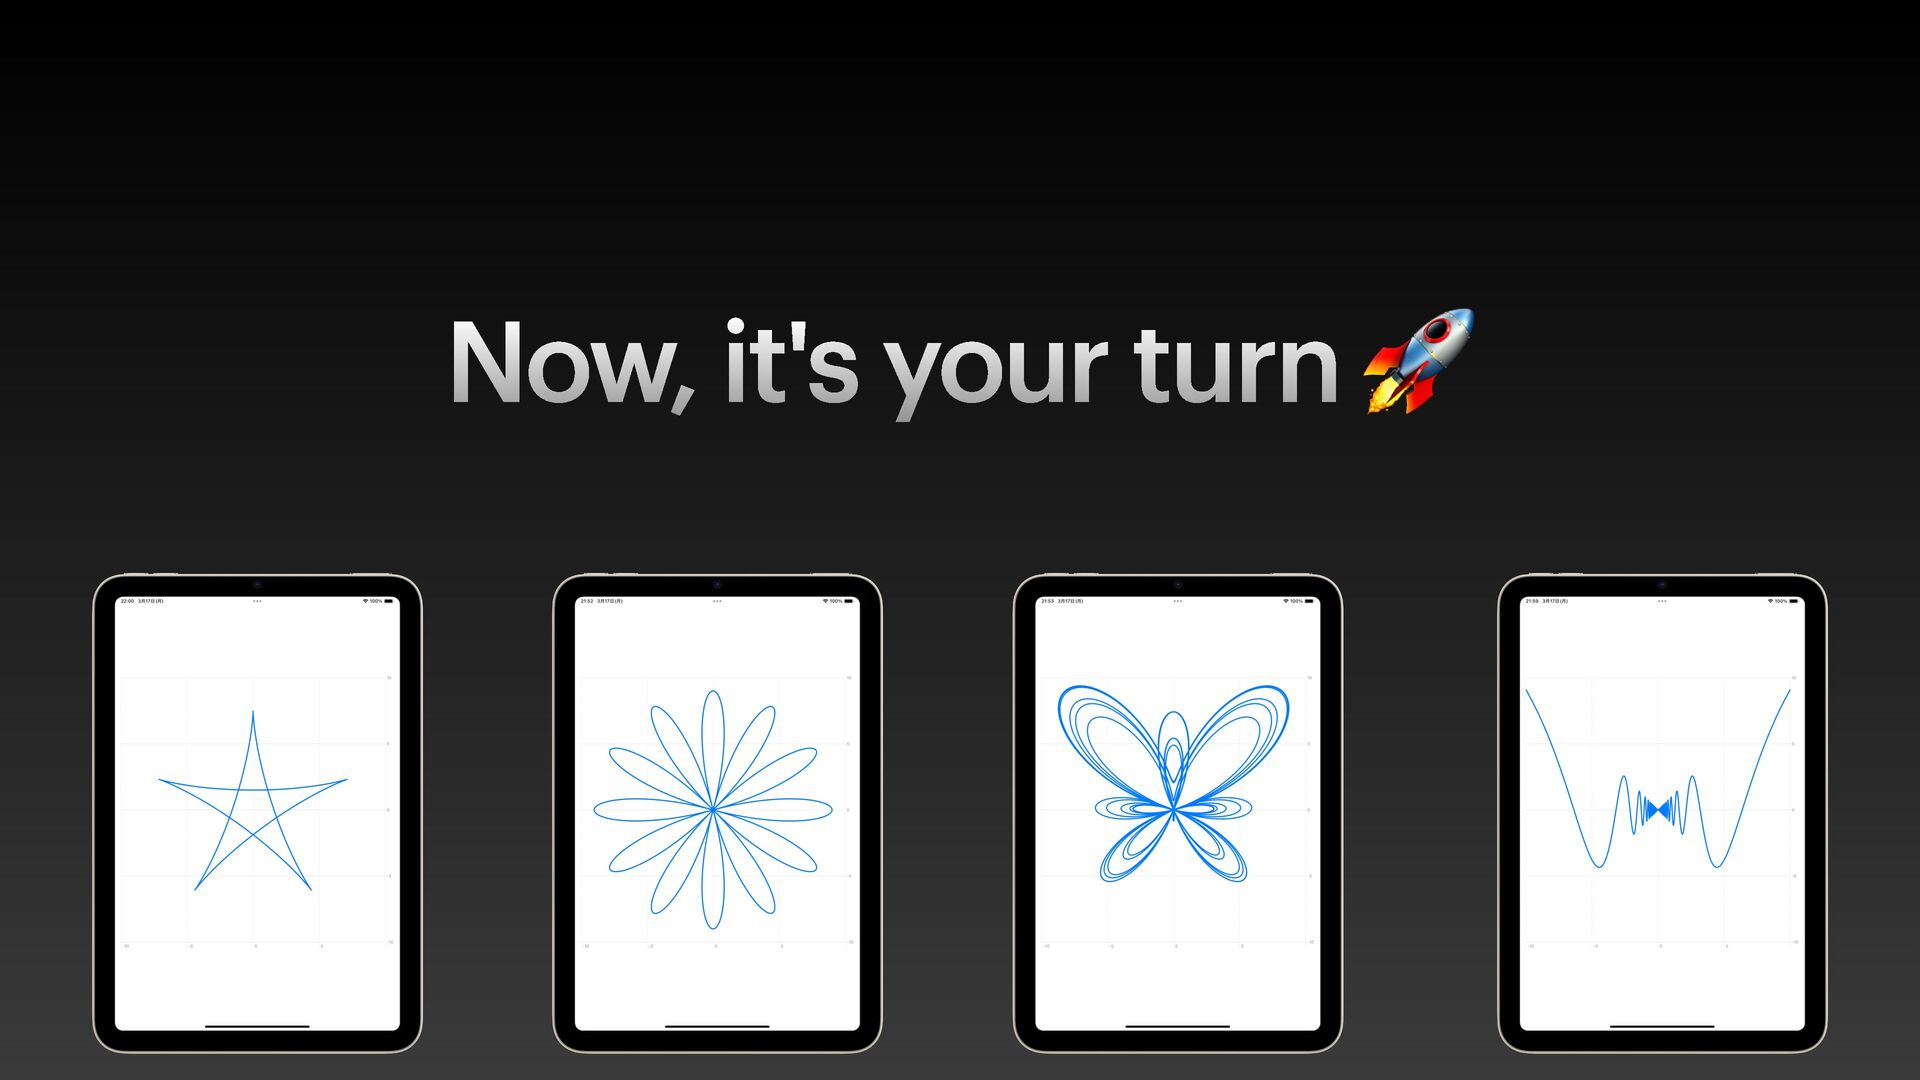
Swift's Charts API is more than just a tool for data visualization—it's a canvas for creative expression. In this session, discover how mathematical equations and plotting techniques transform into evocative visual art.
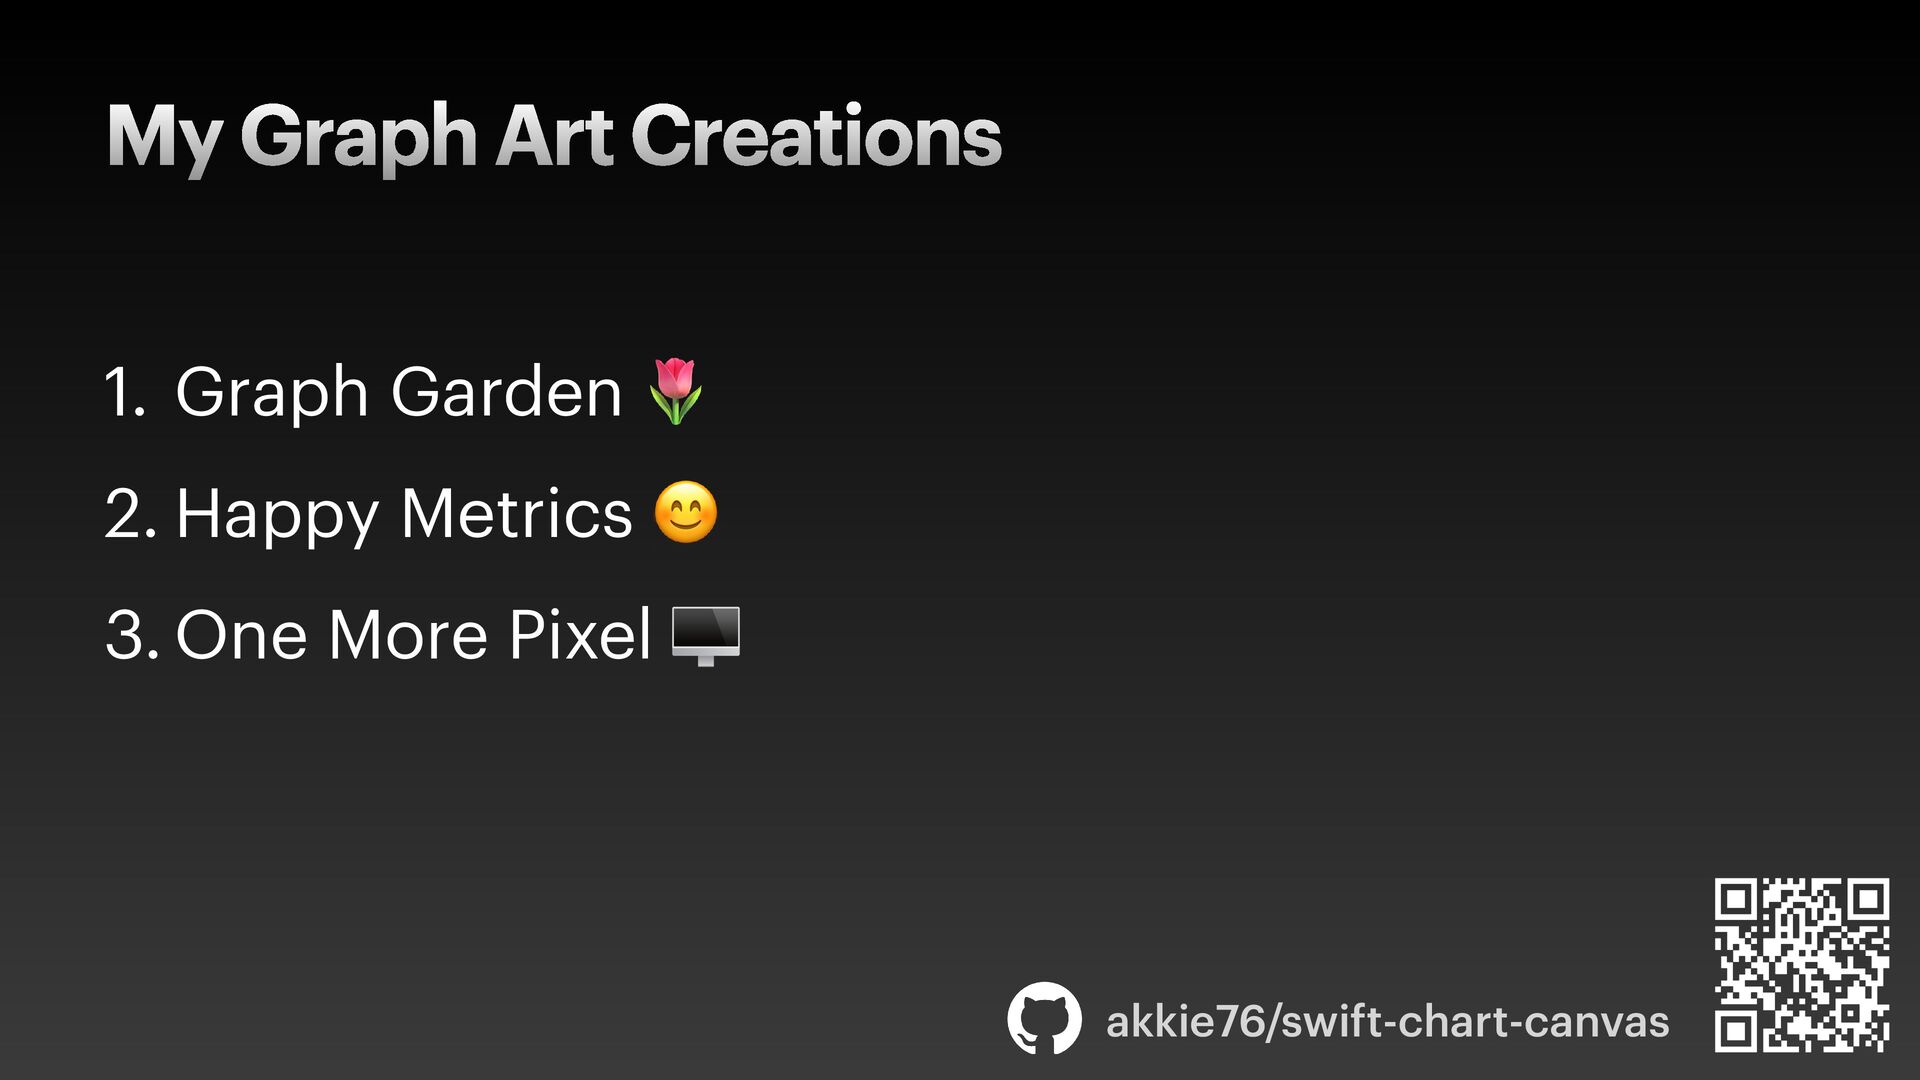
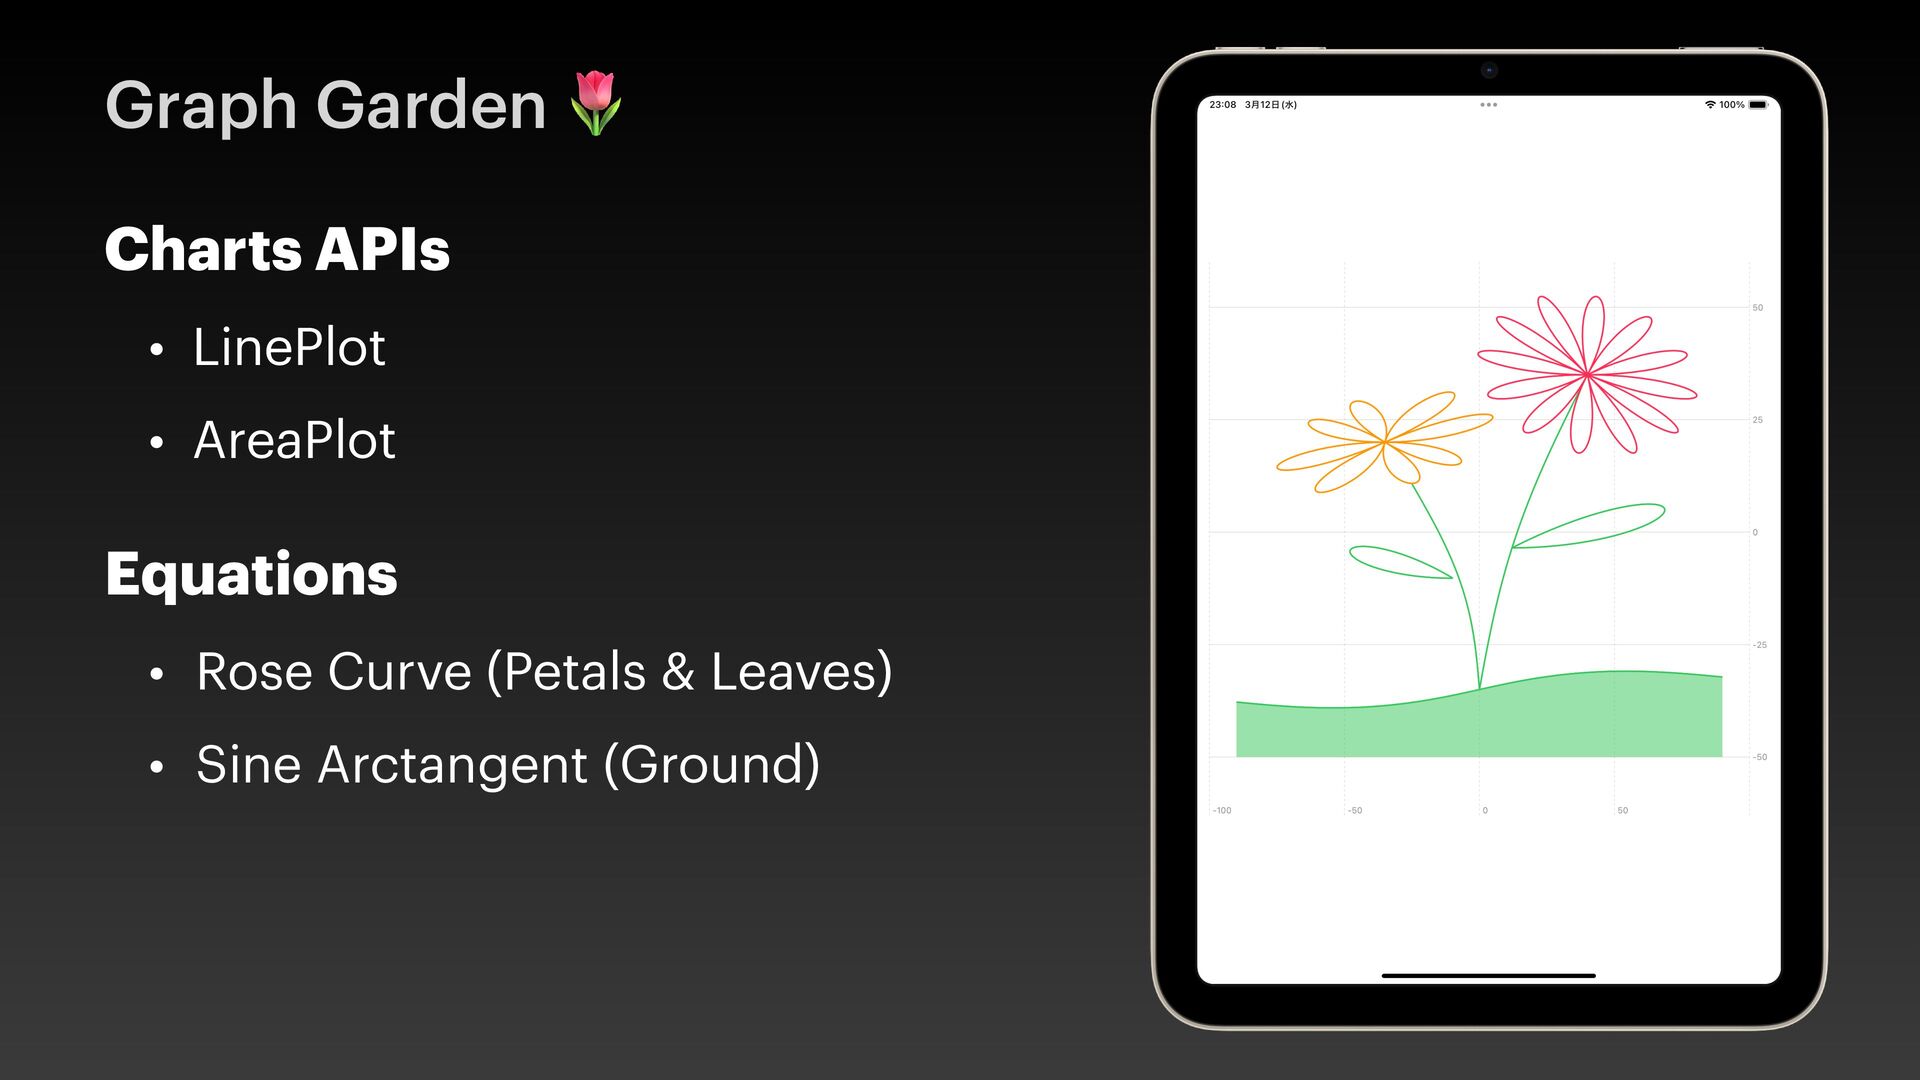
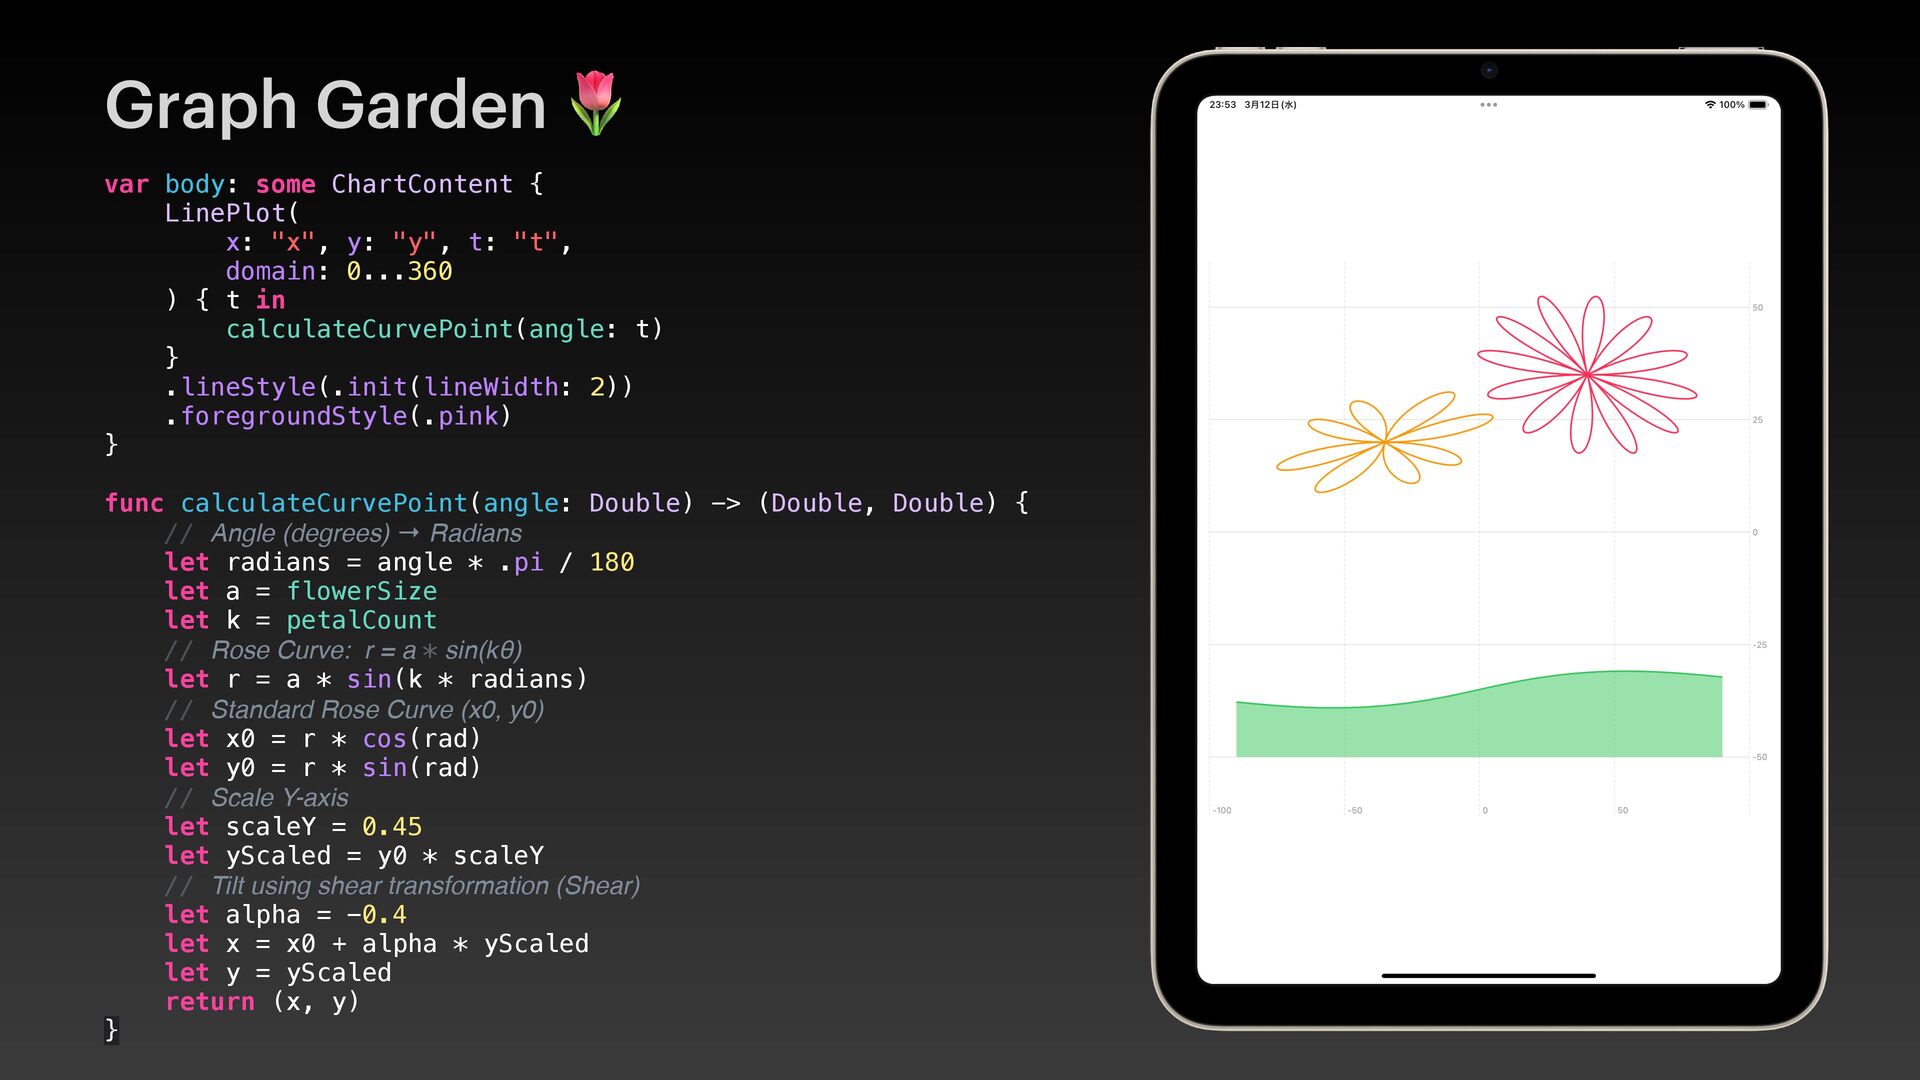
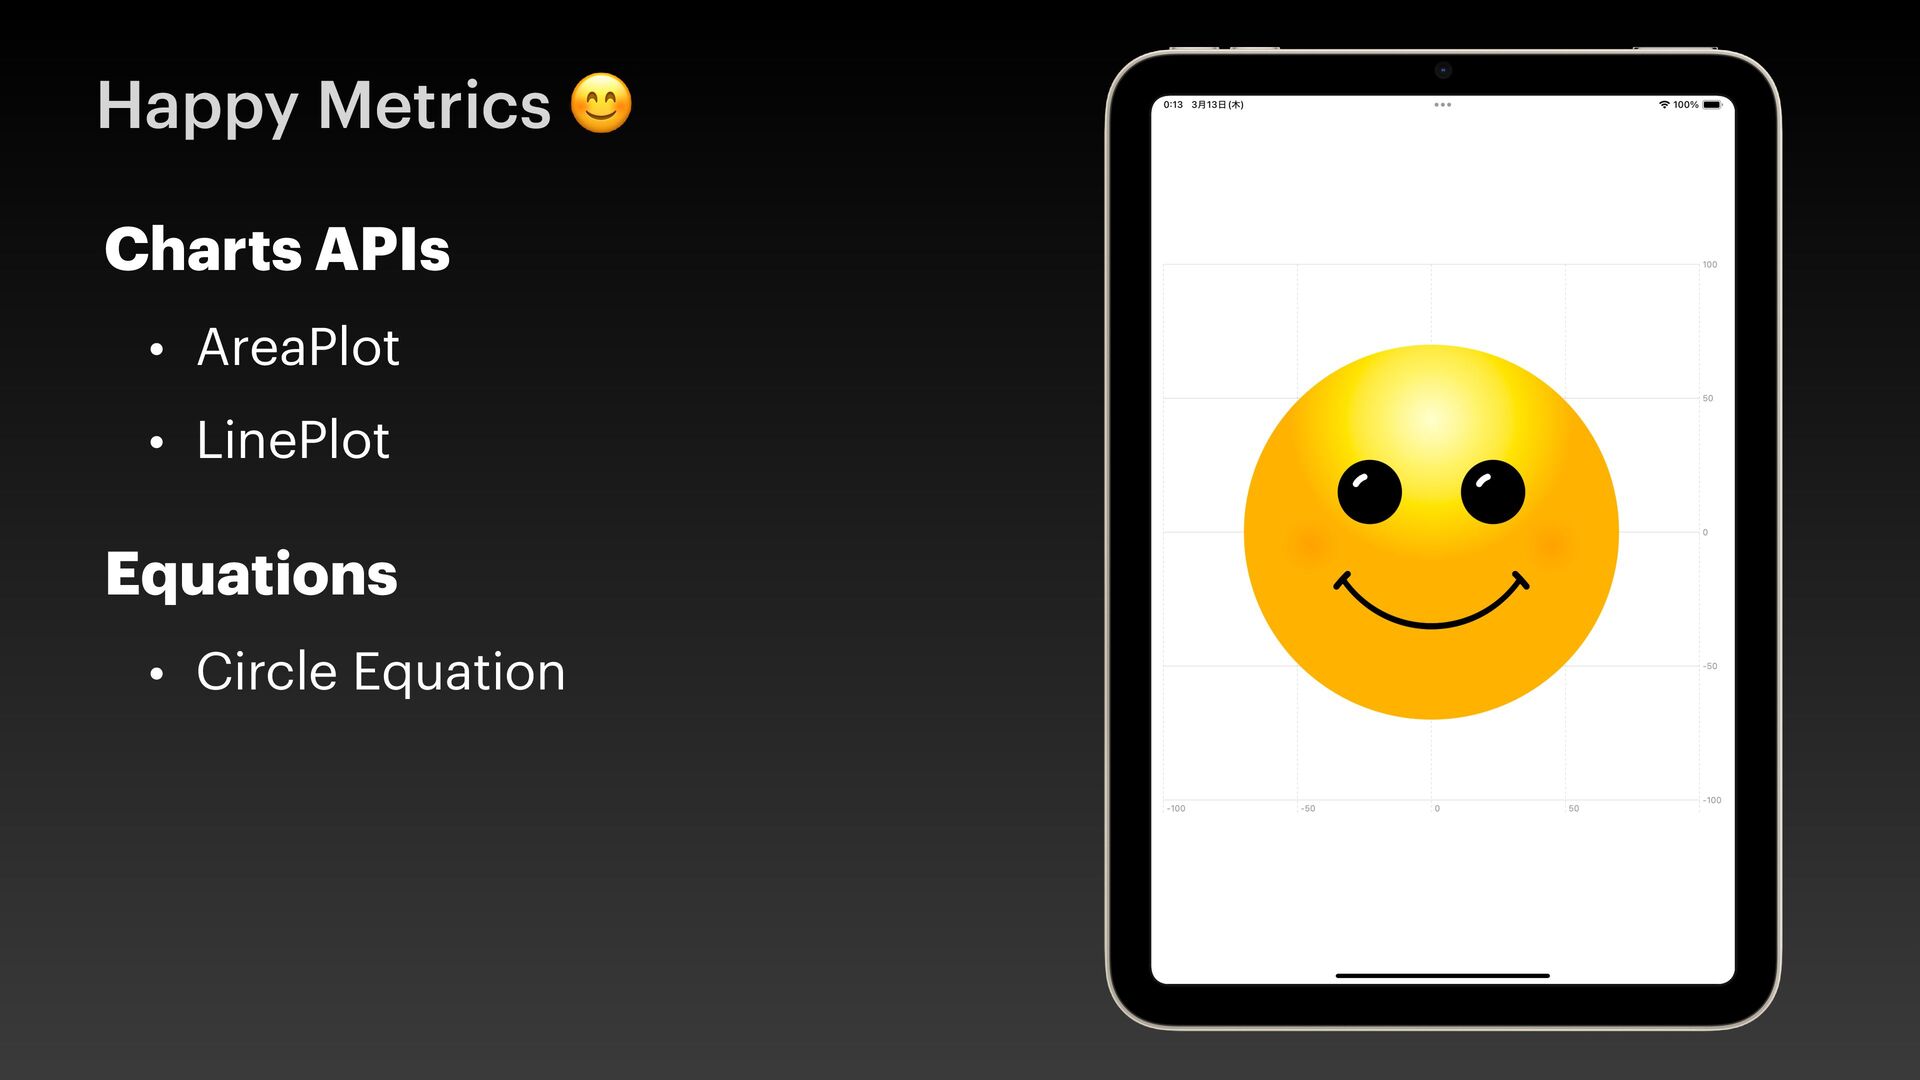
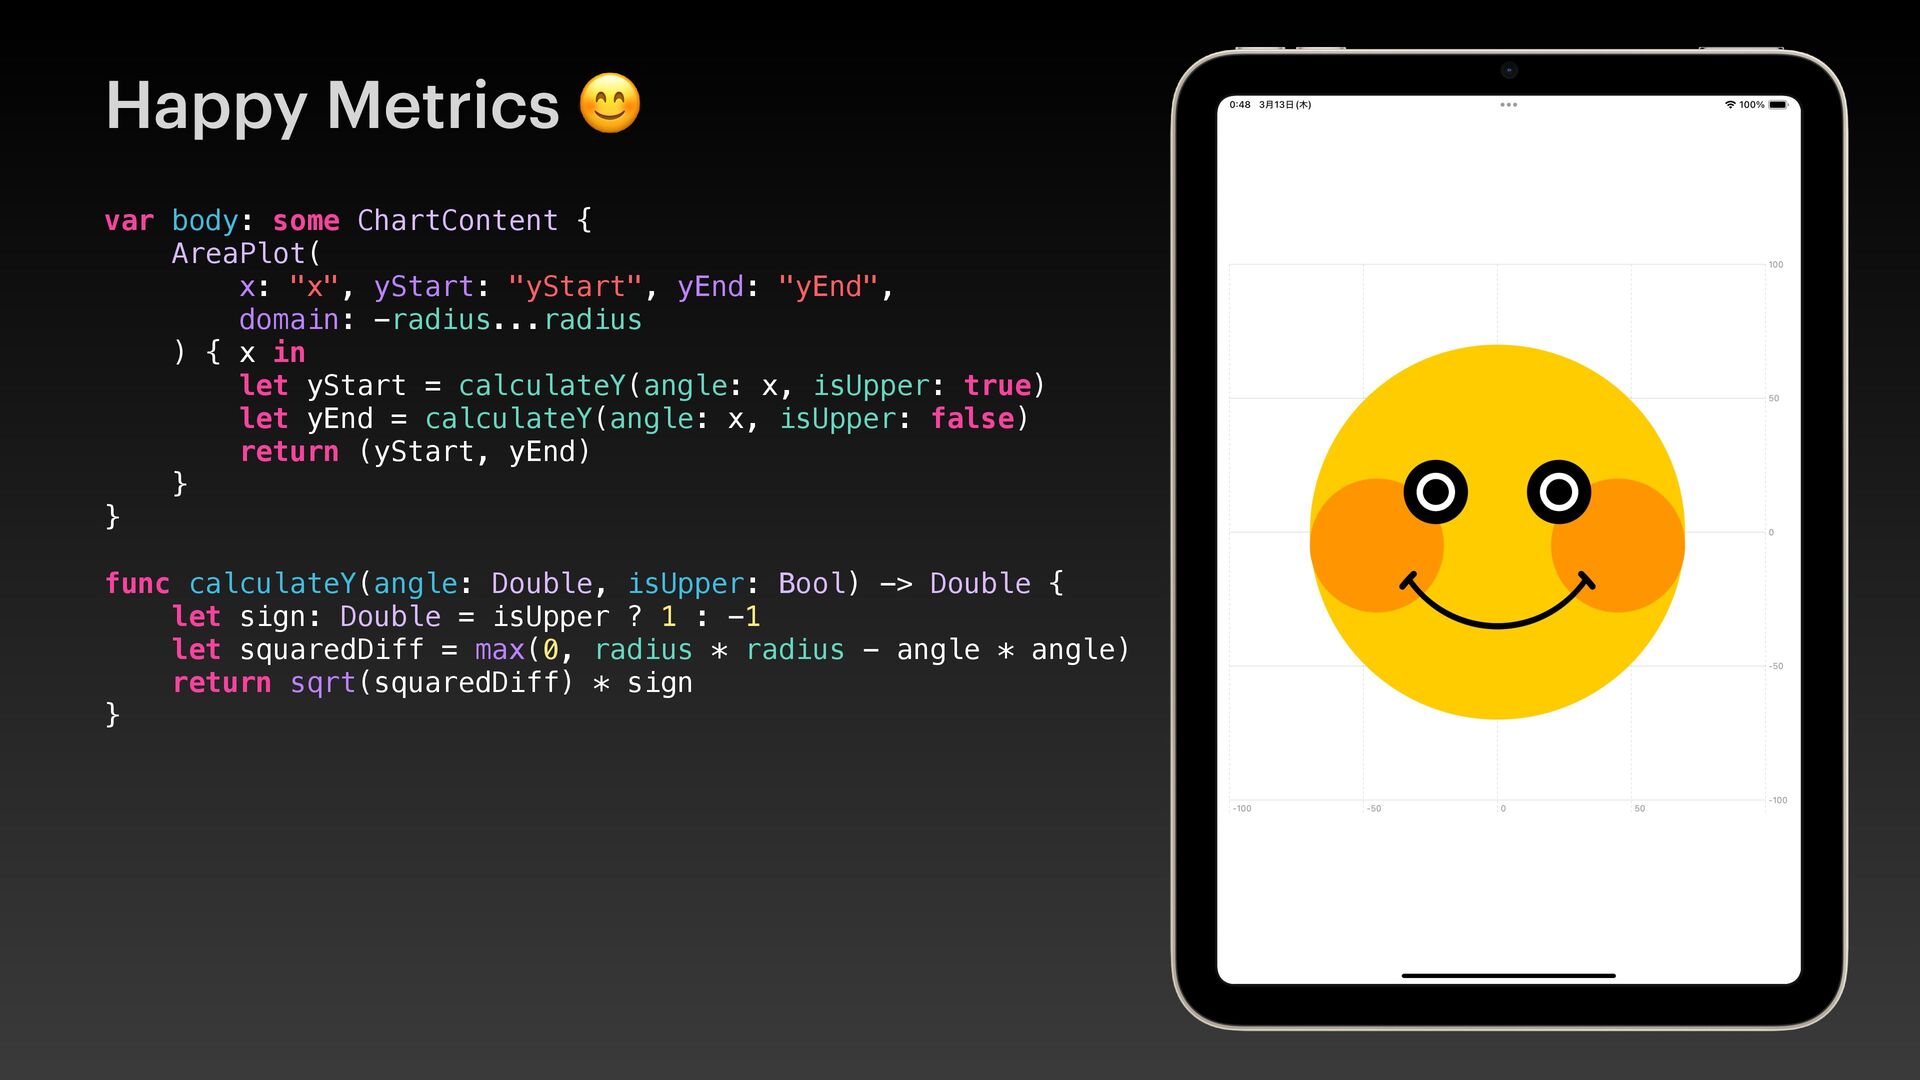
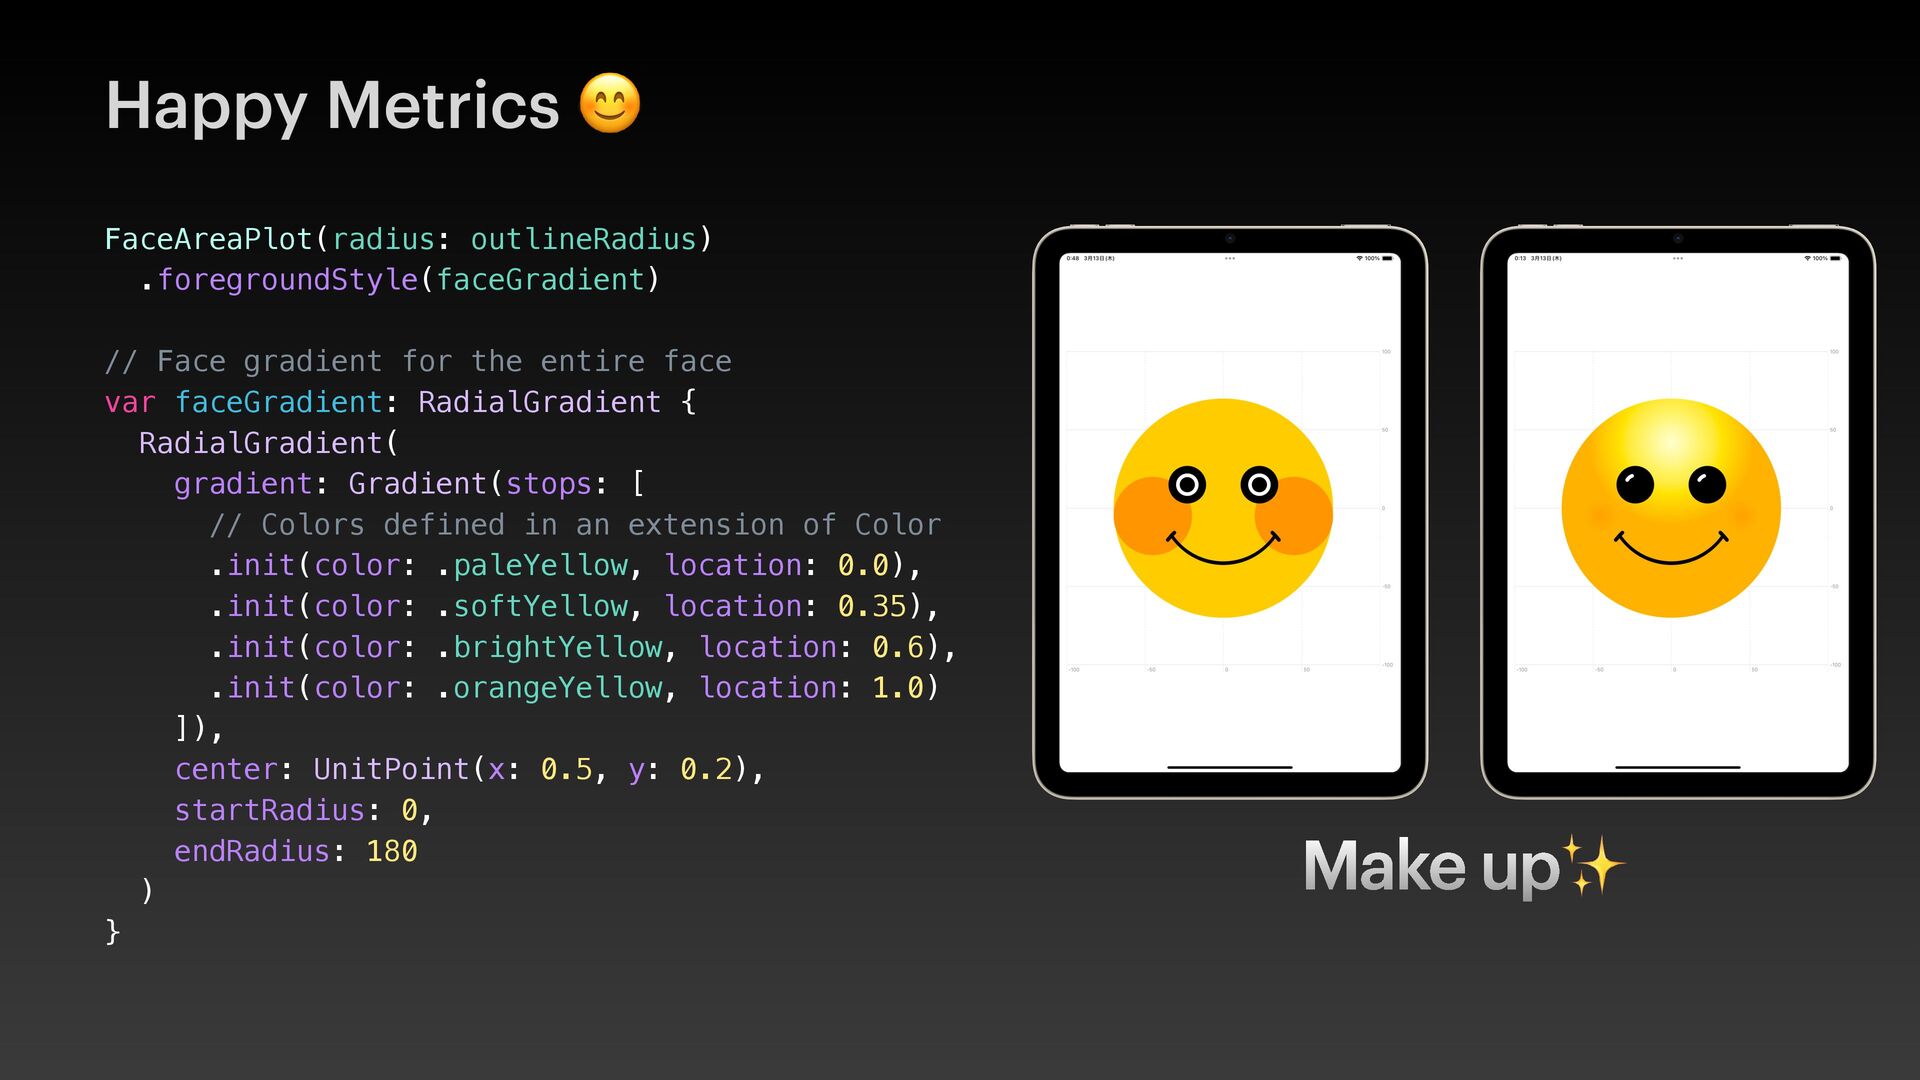
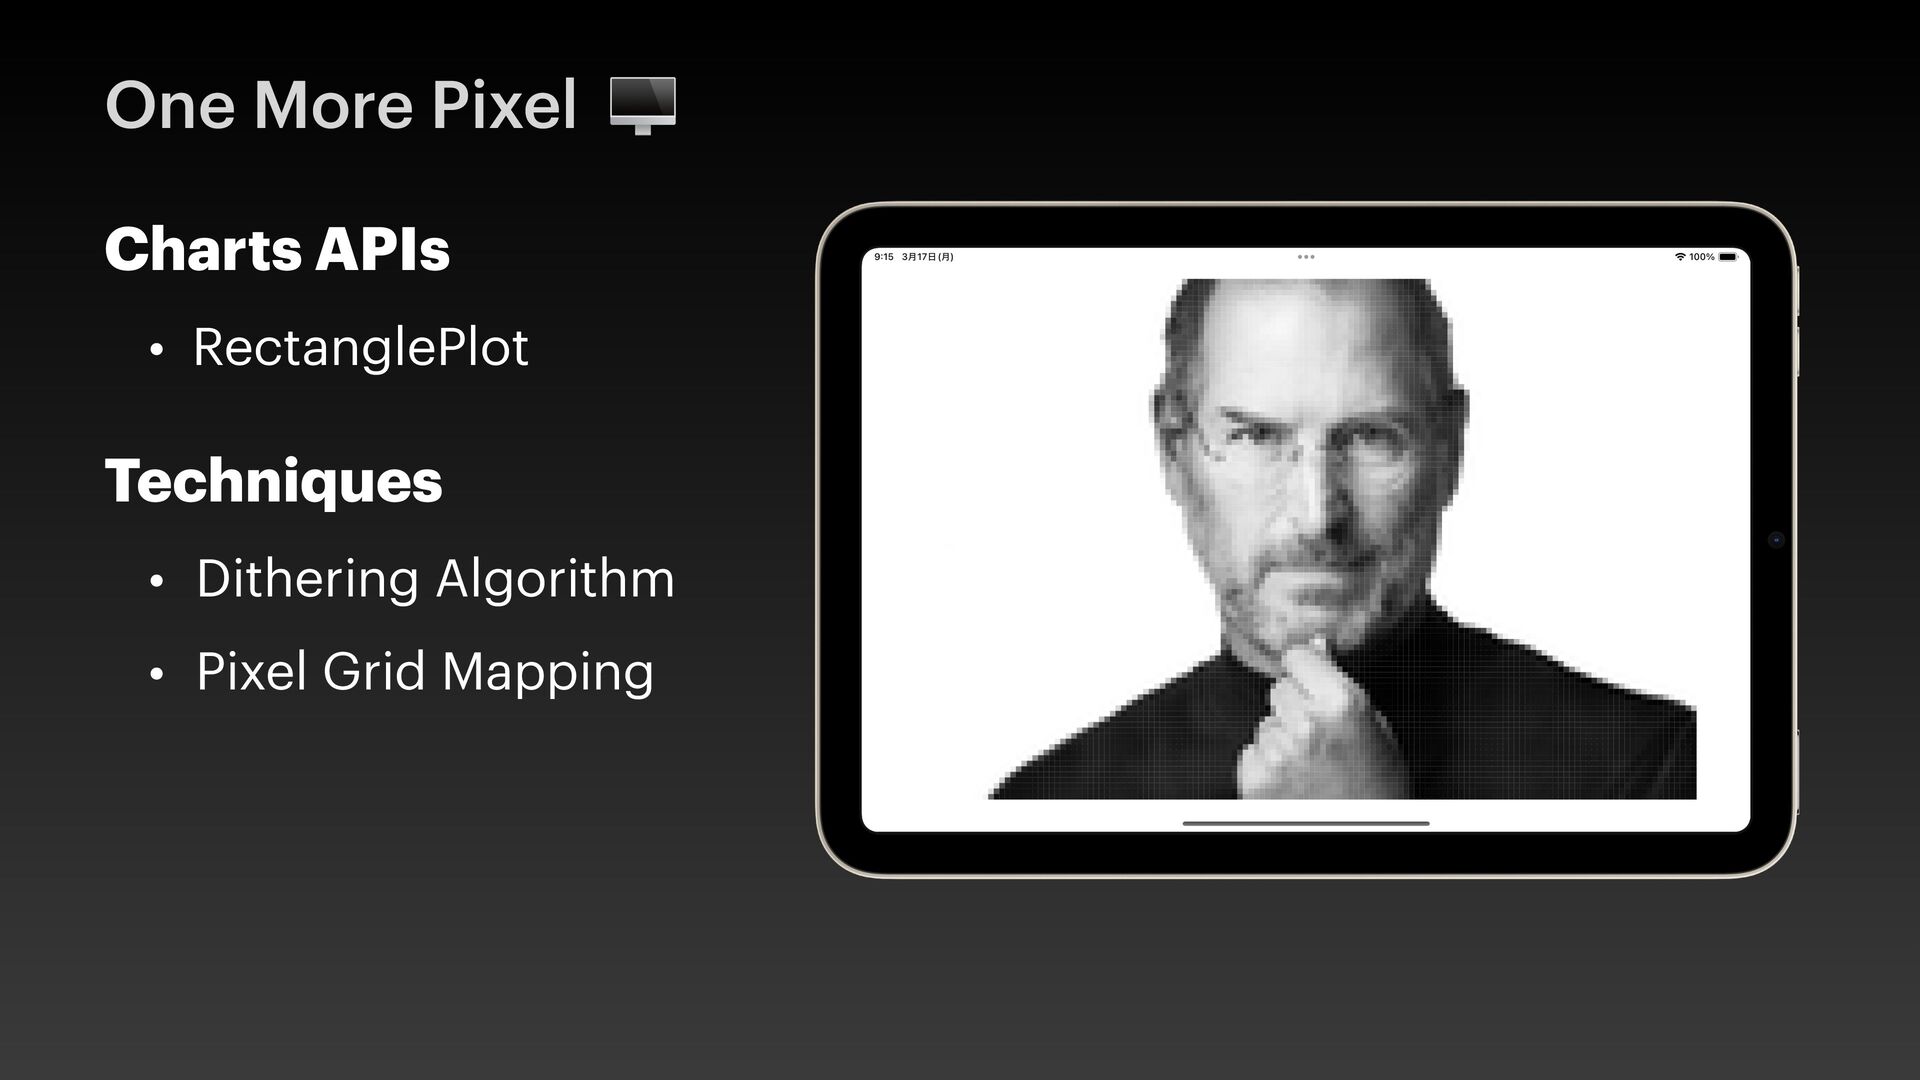
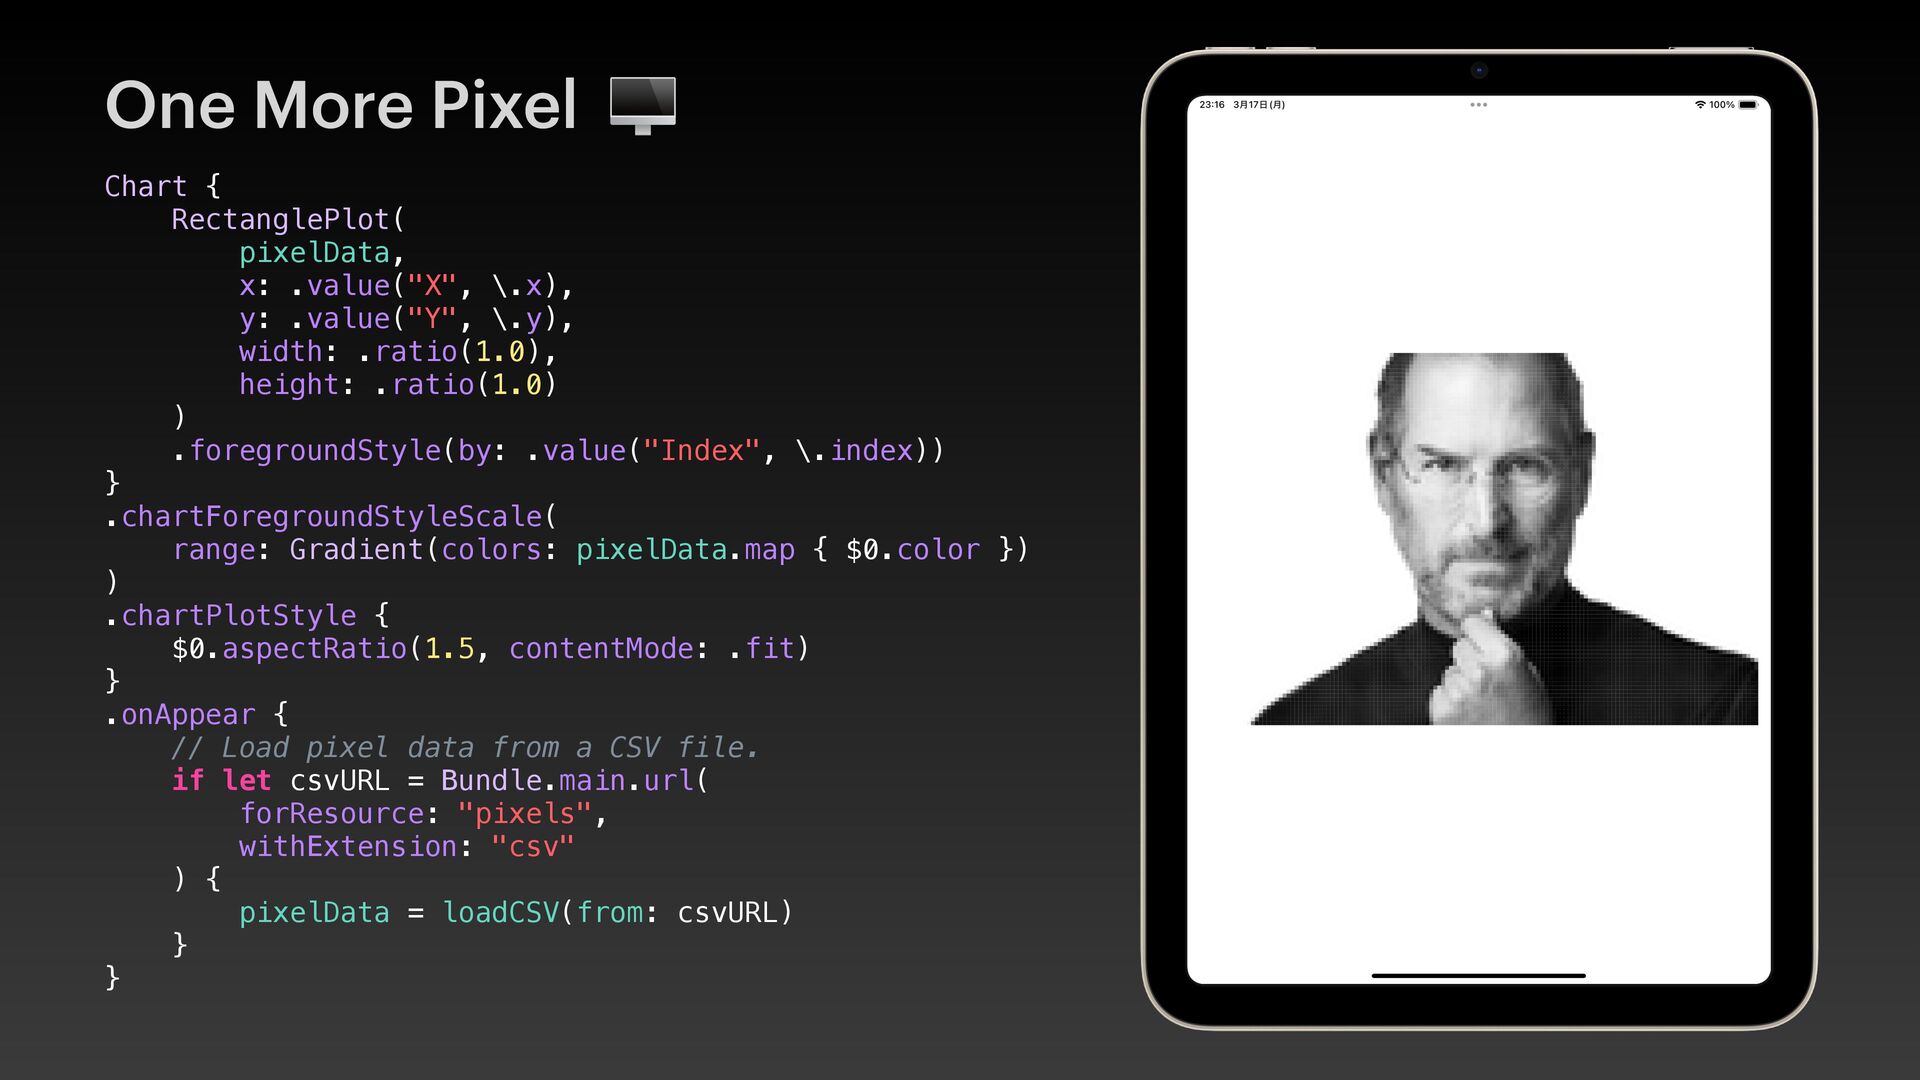
From the delicate patterns of Graph Garden to the playful charm of Happy Metrics and the pixel precision of One More Pixel, explore innovative ways to blend technology and creativity.
Join us and see how numbers can paint a picture—at try! Swift Tokyo 2025.
Sample code available on GitHub: github.com/akkie76/swift-charts-canvas