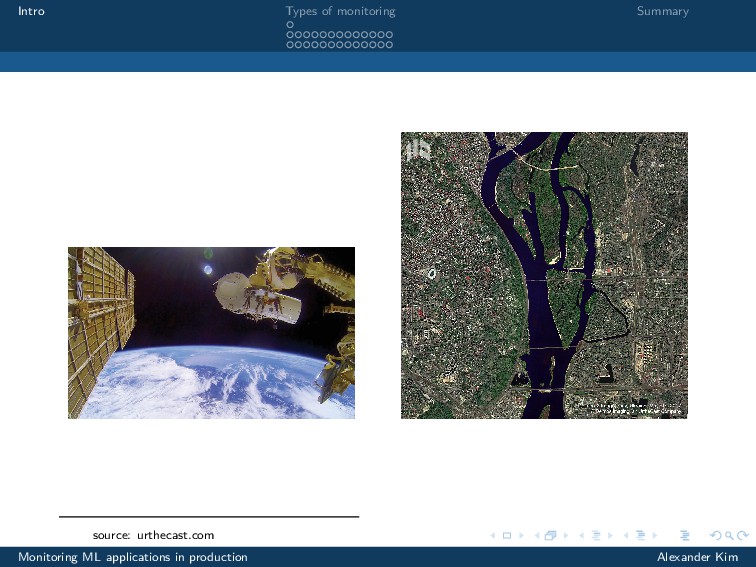
& M.Sc. in Physics @ (Moscow State University, University of Alberta) • Data Analysis & Image Processing @ UrtheCast • Data Science @ Splunk Currently: • Data Science @ [some private company ] • Organizer @ PyData Montreal Monitoring ML applications in production Alexander Kim
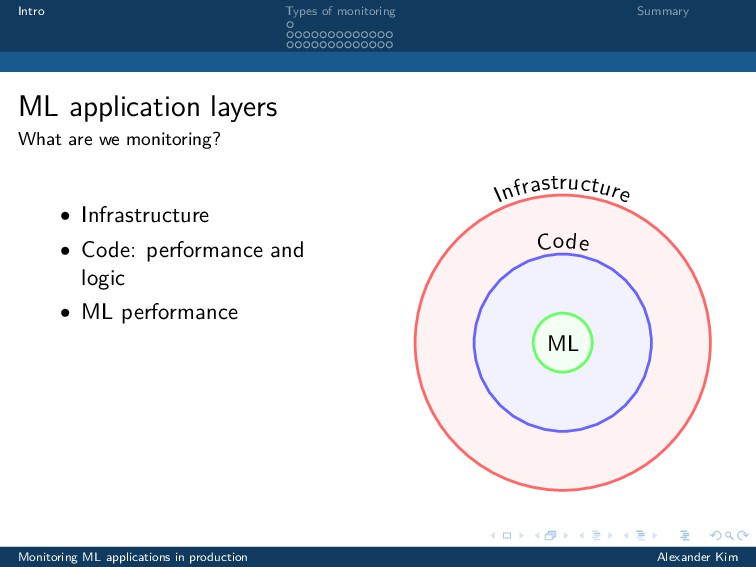
we monitoring? • Infrastructure • Code: performance and logic • ML performance Infrastructure Code ML Monitoring ML applications in production Alexander Kim
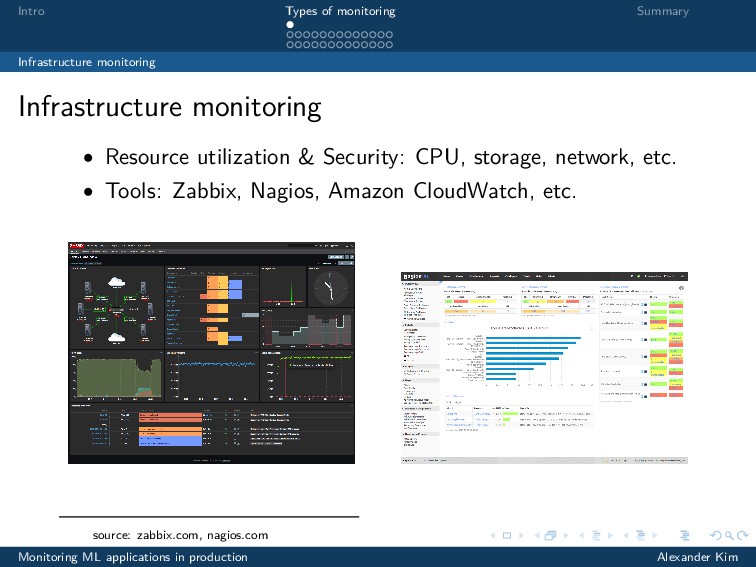
Resource utilization & Security: CPU, storage, network, etc. • Tools: Zabbix, Nagios, Amazon CloudWatch, etc. source: zabbix.com, nagios.com Monitoring ML applications in production Alexander Kim
Instrumentation & metrics: statsd, prometheus, etc. • Event logging & tracing: logstash, splunk, etc. Monitoring ML applications in production Alexander Kim
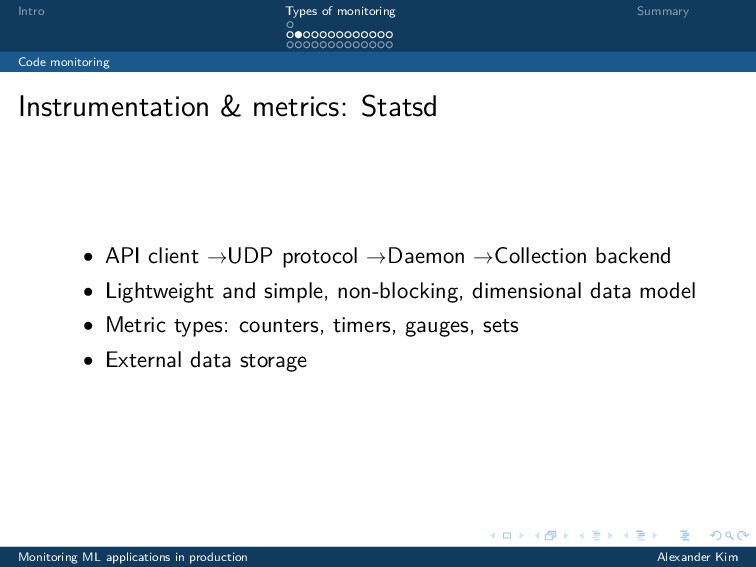
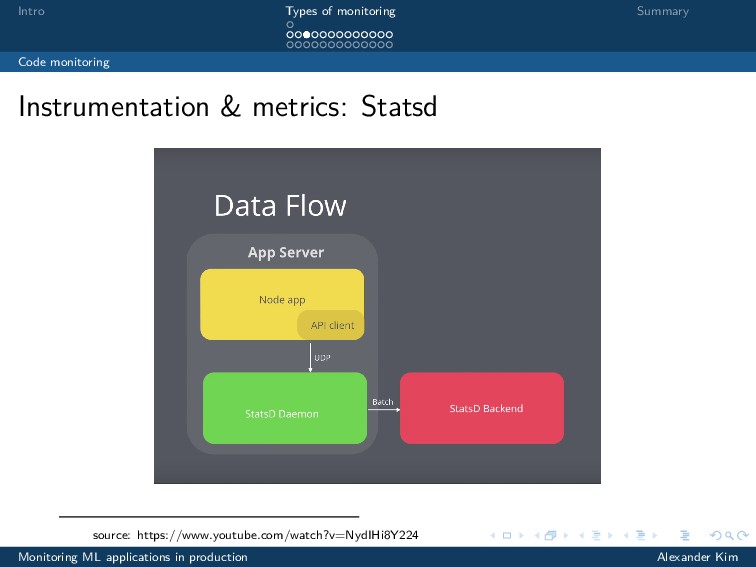
Statsd • API client →UDP protocol →Daemon →Collection backend • Lightweight and simple, non-blocking, dimensional data model • Metric types: counters, timers, gauges, sets • External data storage Monitoring ML applications in production Alexander Kim
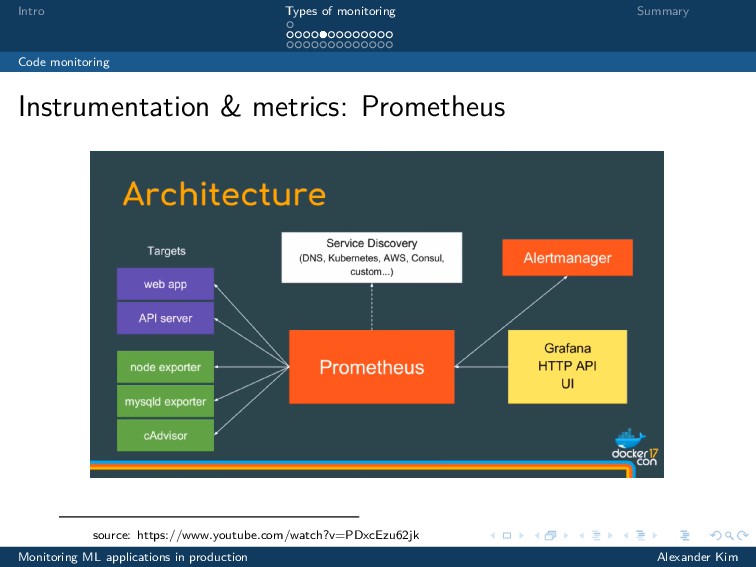
Prometheus • Statsd-like functionality and more • Built-in TSDB and dashboard, local storage* • PromQL, Alerting Monitoring ML applications in production Alexander Kim
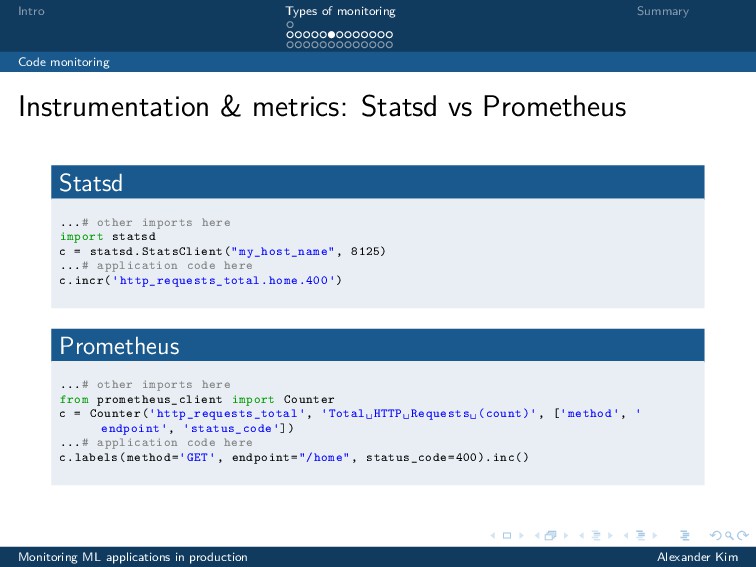
Statsd vs Prometheus Statsd ...# other imports here import statsd c = statsd.StatsClient("my_host_name", 8125) ...# application code here c.incr('http_requests_total.home.400') Prometheus ...# other imports here from prometheus_client import Counter c = Counter('http_requests_total', 'Total␣HTTP␣Requests␣(count)', ['method', ' endpoint', 'status_code']) ...# application code here c.labels(method='GET', endpoint="/home", status_code=400).inc() Monitoring ML applications in production Alexander Kim
Statsd vs Prometheus • Simplicity and low overhead →Statsd • Large number of service instances →Prometheus • from Statsd to Prometheus: https://github.com/prometheus/statsd_exporter Monitoring ML applications in production Alexander Kim
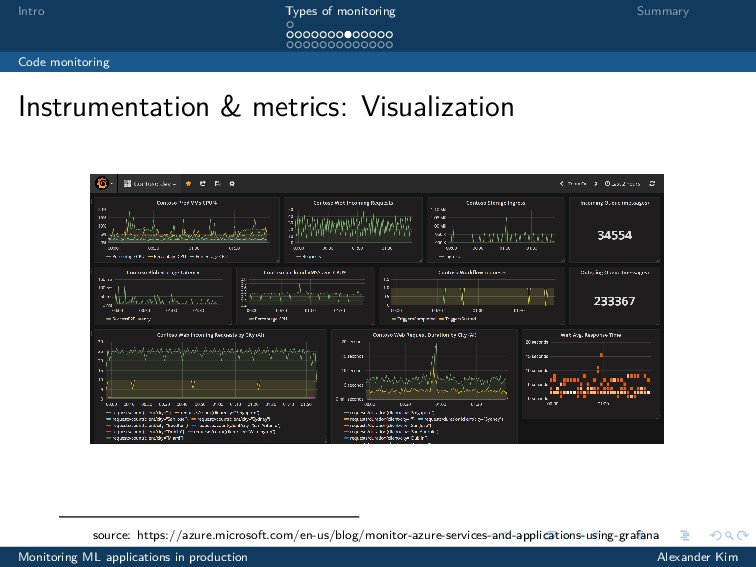
Visualization source: https://azure.microsoft.com/en-us/blog/monitor-azure-services-and-applications-using-grafana Monitoring ML applications in production Alexander Kim
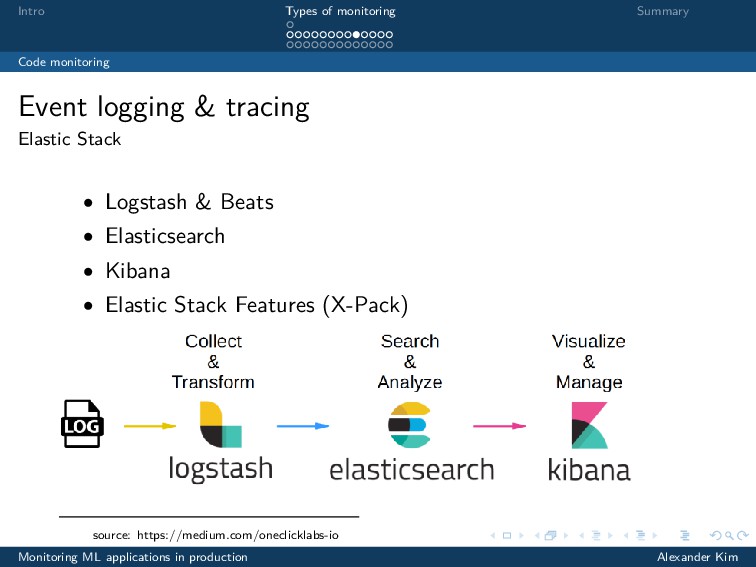
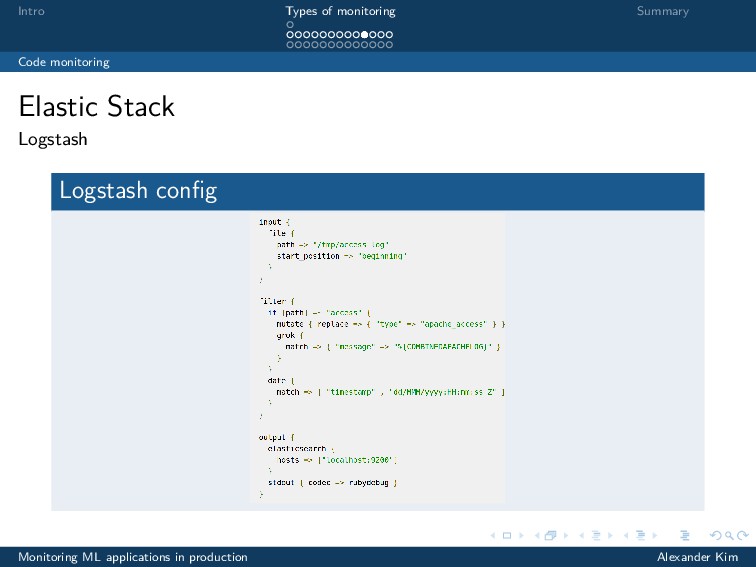
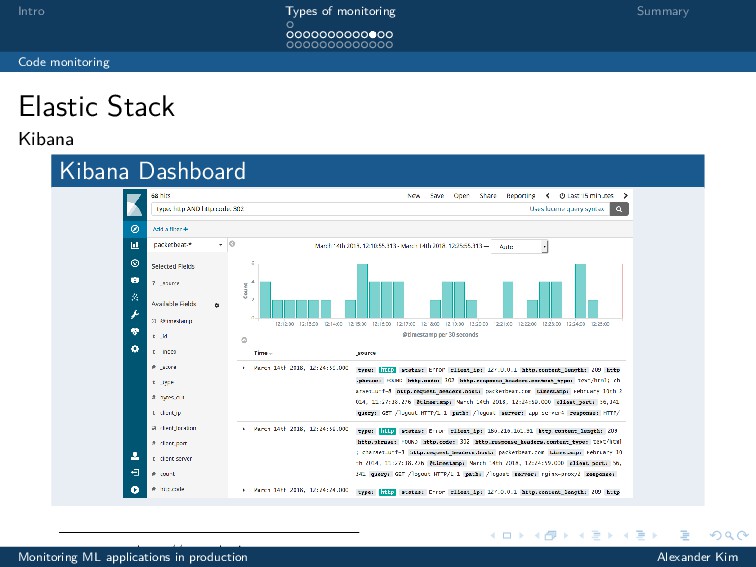
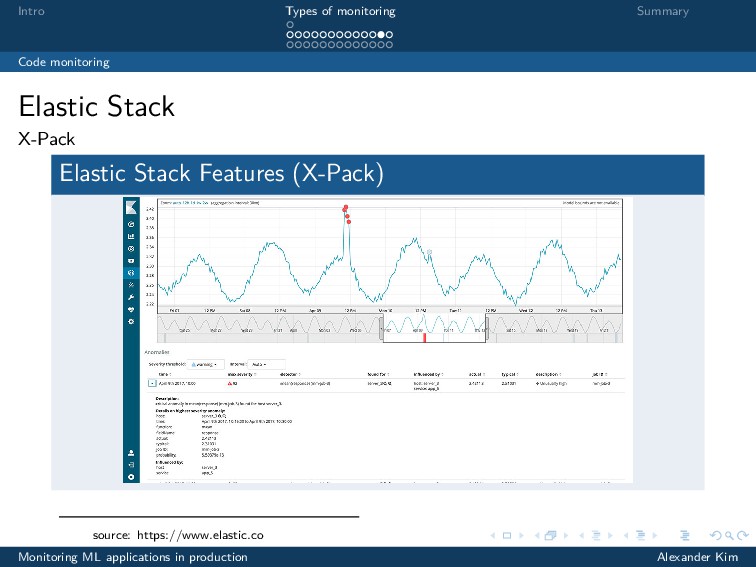
tracing Elastic Stack • Logstash & Beats • Elasticsearch • Kibana • Elastic Stack Features (X-Pack) source: https://medium.com/oneclicklabs-io Monitoring ML applications in production Alexander Kim
tracing Elastic Stack • Logstash & Beats • Elasticsearch • Kibana • Elastic Stack Features (X-Pack) source: https://medium.com/oneclicklabs-io Monitoring ML applications in production Alexander Kim
Splunk, Sumo Logic, etc. • Open-source vs proprietary • Customization vs off-the-shelf features • Pay developers vs pay company Monitoring ML applications in production Alexander Kim
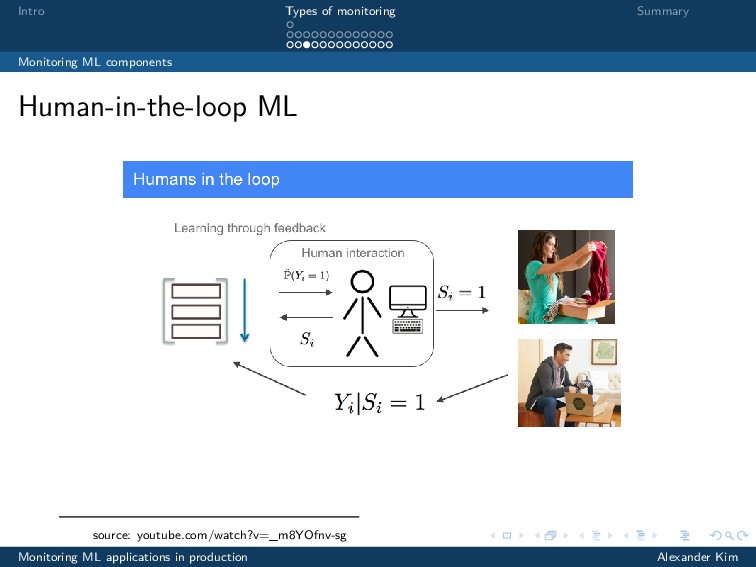
• Frees engineers from edge cases • Might be critical in some industries or mandated by law • Content moderation teams, medical professionals, stylists, etc. Monitoring ML applications in production Alexander Kim
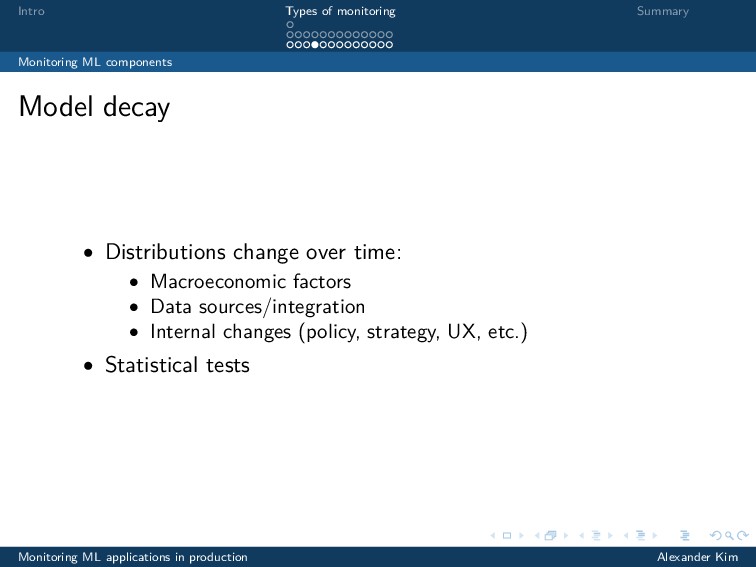
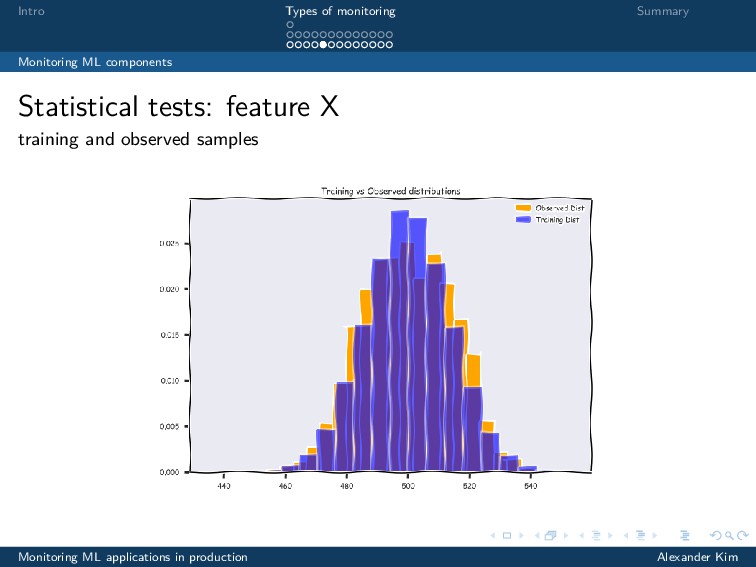
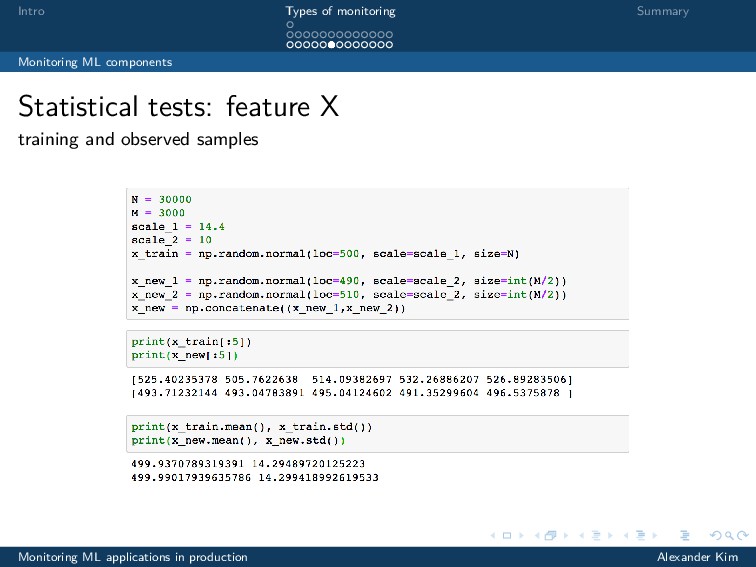
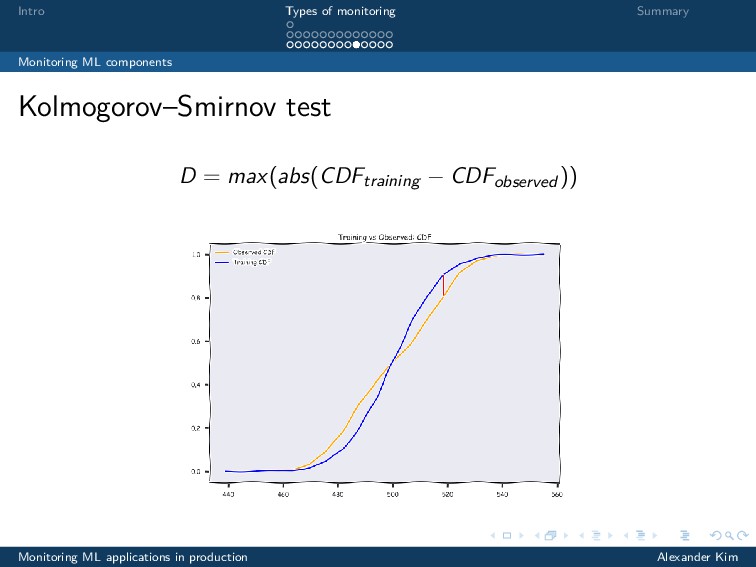
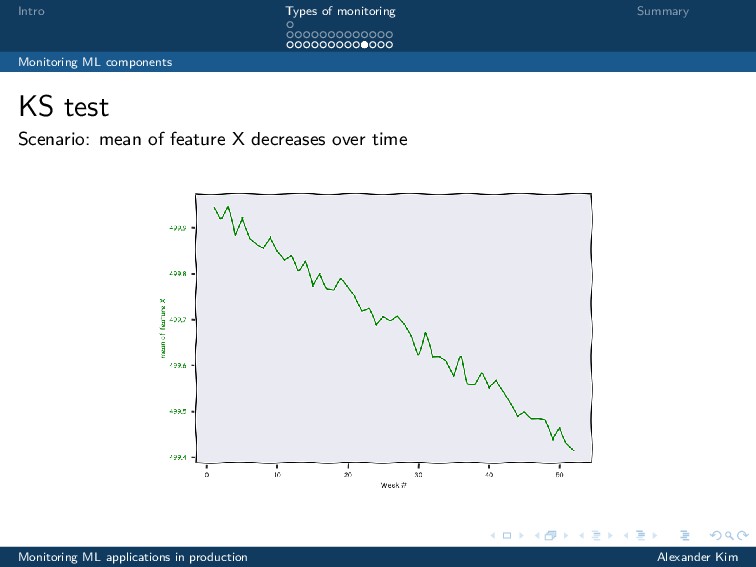
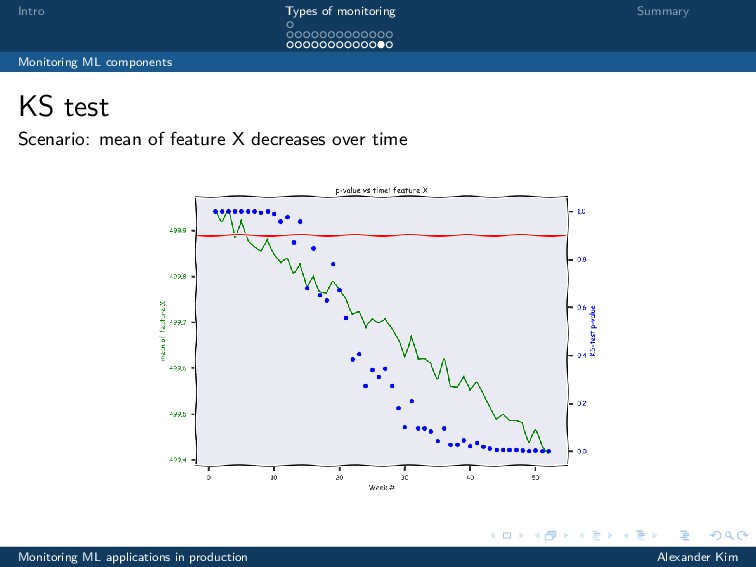
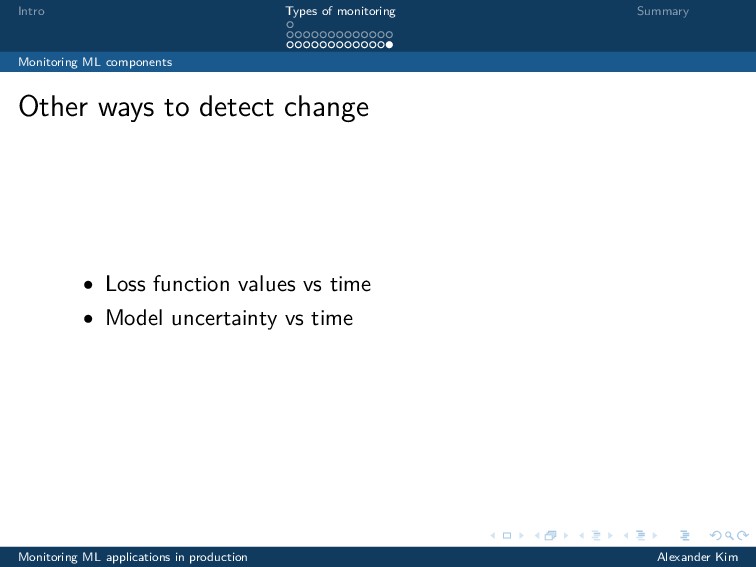
• Distributions change over time: • Macroeconomic factors • Data sources/integration • Internal changes (policy, strategy, UX, etc.) • Statistical tests Monitoring ML applications in production Alexander Kim
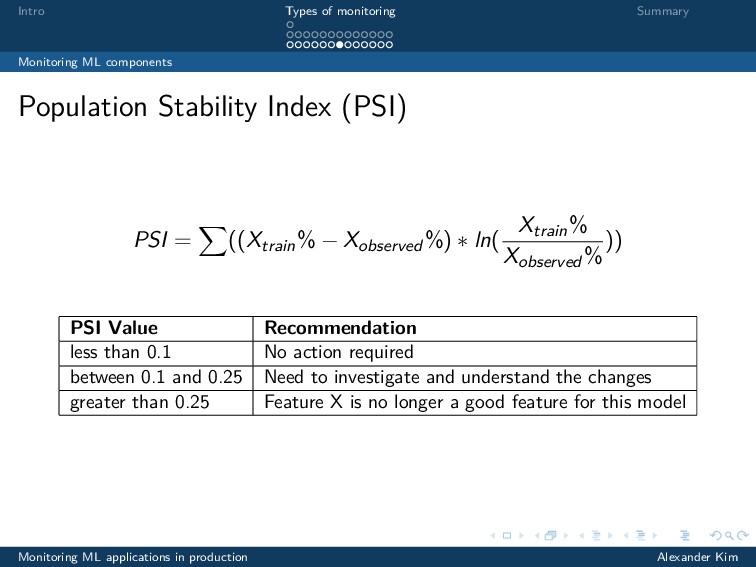
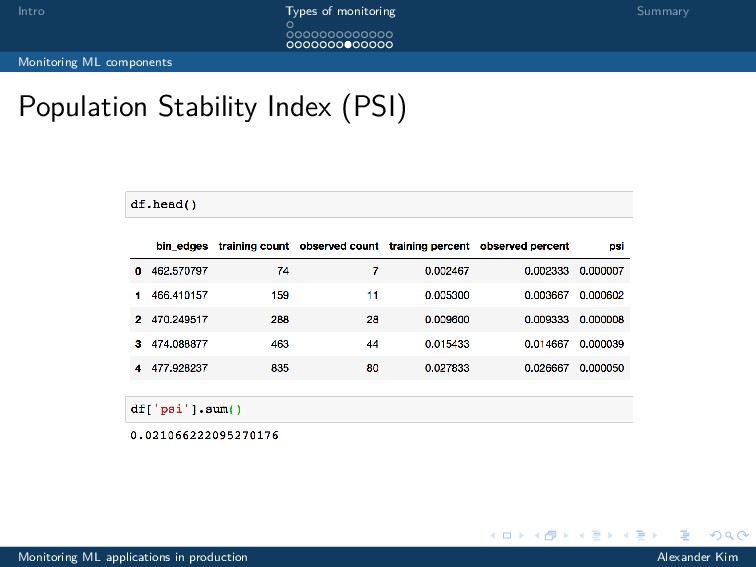
Index (PSI) PSI = ((Xtrain% − Xobserved%) ∗ ln( Xtrain% Xobserved% )) PSI Value Recommendation less than 0.1 No action required between 0.1 and 0.25 Need to investigate and understand the changes greater than 0.25 Feature X is no longer a good feature for this model Monitoring ML applications in production Alexander Kim
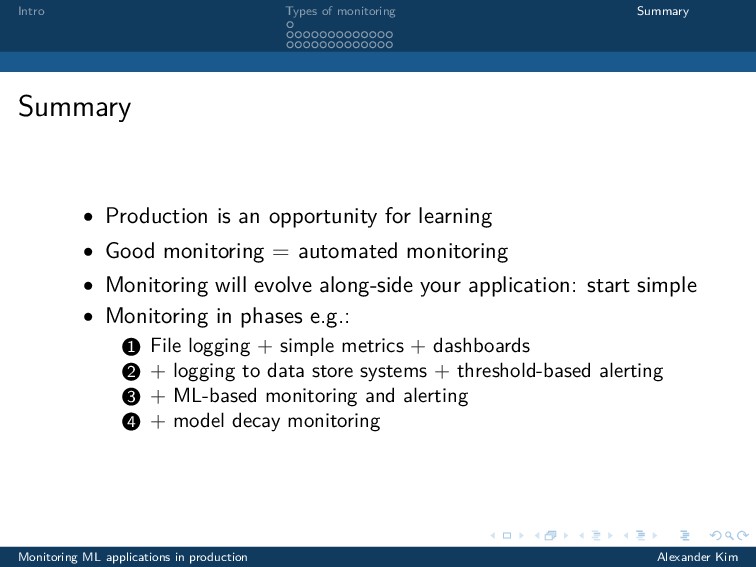
opportunity for learning • Good monitoring = automated monitoring • Monitoring will evolve along-side your application: start simple • Monitoring in phases e.g.: 1 File logging + simple metrics + dashboards 2 + logging to data store systems + threshold-based alerting 3 + ML-based monitoring and alerting 4 + model decay monitoring Monitoring ML applications in production Alexander Kim
et al. ”Hidden technical debt in machine learning systems.” Advances in neural information processing systems. 2015. • Breck, Eric, et al. ”What’s your ML Test Score? A rubric for ML production systems.” (2016). • Polyzotis, Neoklis, et al. ”Data management challenges in production machine learning.” Proceedings of the 2017 ACM International Conference on Management of Data. ACM, 2017. Monitoring ML applications in production Alexander Kim