Upgrade to Pro — share decks privately, control downloads, hide ads and more …

Тестовая презентация

Avatar for Andrey Obukhov Andrey Obukhov
July 24, 2018
38

Тестовая презентация

Описание тестовой презентации

Avatar for Andrey Obukhov

Andrey Obukhov

July 24, 2018
Tweet

Transcript

  1. 1 © GfK November 2, 2017 Crossmedia Landscape Report 2017

    Uncover media and marketing potential based on GfK Crossmedia Panel Panels
  2. 2 © GfK November 2, 2017 Content of GfK Crossmedia

    Landscape Report Key areas to be explored In this chapter you will gain insights into the consumption of video content. It explores the online and offline viewership of TV channels and the consumption of digital streaming offerings. 2 TV Viewership and Digital Streaming This chapter explores the country's top e-commerce offerings and evaluates their usage based on several KPIs. Additionally, the usage of e-commerce offerings by millennials is shown. 4 Industry Chapter: E-Commerce This chapter explores the usage of PCs and mobile devices. This includes the overlaps between devices, top activities and apps, and the device usage in the course of the day. 1 Digital Crossmedia Usage In this part of the report, we inform you about the top social media platforms and the devices which are used to access them. Furthermore, the profiles of social media users are explored. 3 Usage of Social Media
  3. 3 © GfK November 2, 2017 1 2 3E-Commerce: AliExpress

    is the leading e- commerce product in Russia, with the most loyal and engaged users. Video Streaming: The PC is by far the leading device for video streaming usage. With YouTube as, in terms of reach, the most popular streaming brand. Social Media: In Russia VK.com is the leading social media platform followed by Odnoklassniki.ru. Overall, social media is primarily used per smartphone & via apps. The majority of the Russians people are online, either per PC, smartphone or tablet. Most Russian users (32%) are using the PC and smartphones to access the internet. Smartphones are most likely to be used during the morning hours, whereas devices with bigger screens, PCs and tablets, are more likely to be used after work at home. GfK Crossmedia Landscape Report Summary
  4. 6 © GfK November 2, 2017 13% 32% 7% Tablet

    Smartphone PC All three devices 30% 13% PC & Smartphone 1% PC & Tablet Smartphone & Tablet 4% Digital device usage and all device combinations Most users in Russia access the internet with two devices, PC and smartphone. ▪ Most users use a combination of PC and smartphone, followed by PC only users. ▪ 13% use all three devices: PC, smartphone and tablet. ▪ Only 1% of people use tablet only. Source: GfK Crossmedia Panel Russia | March 2017, Online Population 14+ | Base: Online population, users of any device in time slot divided by all the time slots
  5. 7 © GfK November 2, 2017 Internet usage per device

    based on visits The Smartphone is the leading device for internet visits in Russia. Source: GfK Crossmedia Panel Russia | March 2017, Online Population 14+ Based on absolute visits, the smartphone is the leading device within the Russian online population, but closely followed by the PC. Smartphones and tablets are used predominantly for app usage, tablet shows also a strong browsing usage (39%). 30,335 31,063 7,014 PC Smartphone Tablet Visits generated on respective device 39% 61% 44% 45% 10% 21% 79% Smartphone Tablet Shares Mobile app Mobile browsing Mobile app Mobile browsing Absolute visits in millions
  6. 8 © GfK November 2, 2017 Internet usage per device

    based on duration 50% of the internet usage duration in Russia happens on the PC. Source: GfK Crossmedia Panel Russia | March 2017, Online Population 14+ Based on the share of duration usage, the PC is the leading device within the Russian online population. In total 172.696.060.099 minutes were spend on the PC on the internet in March 2017. Smartphones and tablets are used predominantly for app usage. 172,696 136,114 32,982 PC Smartphone Tablet 27% 73% 12% 88% Mobile app Mobile browsing Smartphone Tablet Mobile app Mobile browsing Duration in minutes per device 50% 40% 10% Shares Absolute duration (min.) in millions
  7. 10 © GfK November 2, 2017 93% 90% 85% 78%

    78% Web Search News / Information Social Networking On-Site Search Communication Source: GfK Crossmedia Panel Russia | March 2017, Online Population 14+ | Based on Taxonomy Activity level (see appendix, chart 61 & 62) PC Top 5 activities based on net reach Web search has the highest reach on the PC, while on mobile it is shopping. The activity web search has the highest reach on the PC, followed by news/information. On mobile devices on the other hand communication and social networking has the highest reach. Mobile devices 90% 90% 86% 86% 86% Communication Social Networking News / Information On-Site Search Web Search
  8. 11 © GfK November 2, 2017 25% 18% 8% 7%

    6% Social Networking Communication News / Information Gaming Web Search 24% 18% 15% 9% 9% News / Information Web Search Social Networking Communication Shopping / Auctions / Rent Source: GfK Crossmedia Panel Russia | March 2017, Online Population 14+ | Based on Taxonomy Activity level (see appendix, chart 61 & 62) PC Top 5 activities based on visits In terms of visits the mobile device usage is characterized by social networking. Based on visits, the category news/information holds the highest share on the PC, while on mobile devices it is held by social networking, followed by communication. Mobile devices
  9. 12 © GfK November 2, 2017 32% 18% 12% 10%

    6% Social Networking News / Information Media On-Demand Shopping / Auctions / Rent Communication Source: GfK Crossmedia Panel Russia | March 2017, Online Population 14+ | Based on Taxonomy Activity level (see appendix, chart 61 & 62) PC Top 5 activities based on duration Most time on mobile devices is spent on social networking, the same goes for PC. Based on duration, the highest share on the PC and mobile devices is held by social networking. While on the PC it is followed by news / information, on mobile devices it is followed by communication. Mobile devices 39% 13% 12% 8% 5% Social Networking Communication Gaming Media On-Demand Shopping / Auctions / Rent
  10. 13 © GfK November 2, 2017 13.5 11.9 9.0 7.7

    7.2 Social Networking Gaming Media On-Demand Shopping / Auctions / Rent Gambling Source: GfK Crossmedia Panel Russia | March 2017, Online Population 14+ | Based on Taxonomy Activity level (see appendix, chart 61 & 62) PC Top 5 activities based on average time per visit The most time spent per visit is on the PC on social networking and gaming. Based on the average time per visit, the most visited category on the PC is social networking. On mobile devices media on-demand (8,2 mins on average per visit) and gaming (7,7 mins on average per visit) have the highest average time per visit. Mobile devices 8.2 7.7 7.3 4.7 4.7 Media On-Demand Gaming Social Networking Media Broadcasting Gambling
  11. 15 © GfK November 2, 2017 28 20 96 73

    53 22 73 4 13 13 257 38 943 328 191 130 362 14 34 20 9.2 1.9 9.8 4.5 3.6 6.0 4.9 3.1 2.6 1.5 Top 10 apps on mobile devices YouTube with the highest reach, Vk.com has by far the highest duration. 61% 59% 58% 52% 39% 37% 36% 32% 32% 29% YouTube Watchpage Google Search Vk.com WhatsApp Messenger Viber AliExpress Instagram Google Maps Sberbank online Gmail Source: GfK Crossmedia Panel Russia | March 2017, Online Population 14+ YouTube Watchpage has the highest reach in Russia. Vk.com generates the highest duration and unique visits per user per month. The avg. time per visit is highest for Vk.com (nearly 10 mins.) Avg. visits per user per month Duration (min.) per user per month Avg. time per visit (min.) Net Reach
  12. 18 © GfK November 2, 2017 Online and offline viewership

    of TV programs With a reach of 68% Первый Канал is the leading TV channel in Russia. 60% 57% 56% 54% 45% 35% 25% 34% 27% 27% 25% 16% 18% 15% 18% 2% 1% 1% 3% 6% 7% 3% 1% 3% 6% 4% 2% 3% 5% 5% 5% Offline only viewers Online only viewers Super-viewership* Первый Канал, as the leading TV channel, has the highest overall reach (68%) of which 6% are due to super-viewership*. Первый Канал also reaches the highest offline viewership (60%) whereas Россия 24 has the highest online viewership (7%). Source: GfK Crossmedia Panel Russia | March 2017, Online Population 14+ *Super-viewers = viewers who view the offline as well as the online version of given TV channel
  13. 20 © GfK November 2, 2017 Streaming usage per device

    based on visits With 58% share of visits the PC is the leading device for streaming in Russia. Source: GfK Crossmedia Panel Russia | March 2017, Online Population 14+ Based on visits, PC is the leading device used for streaming within the Russian online population. Smartphones and tablets are used predominantly for mobile app streaming. 2,134 1,058 489 PC Smartphone Tablet Visits generated on respective device 58% 29% 13% Shares 25% 75% 21% 79% Mobile app Mobile browsing Smartphone Tablet Mobile app Mobile browsing Absolute visits in millions
  14. 21 © GfK November 2, 2017 Streaming usage per device

    based on duration Russian users spent more streaming time on the PC than on mobile devices. Source: GfK Crossmedia Panel Russia | March 2017, Online Population 14+ Based on duration, the PC is the leading device used for streaming within the Russian online population. 18.544.630.398 minutes in total are generated on the PC in March 2017 for video streaming. Smartphones and tablets are used predominantly for mobile app streaming. 18,545 8,220 4,181 PC Smartphone Tablet 41% 59% 20% 80% Duration in minutes per device 60% 27% 14% Shares 20% 80% 11% 89% Mobile app Mobile browsing Smartphone Tablet Mobile app Mobile browsing Absolute duration (min.) in millions
  15. 23 © GfK November 2, 2017 Social media usage per

    device based on visits Social media visits are by far lead by smartphones. Source: GfK Crossmedia Panel Russia | March 2017, Online Population 14+ With a share of 62% of all social media visits, the smartphone is the leading device that is most frequented. Within the Russian Online Population 14+. Smartphones and tablets are used predominantly by app. 3,428 7,200 1,039 PC Smartphone Tablet Visits generated on respective device 29% 62% 9% Shares 34% 66% 13% 87% Mobile app Mobile browsing Smartphone Tablet Mobile app Mobile browsing Absolute visits in millions
  16. 24 © GfK November 2, 2017 Social media usage per

    device based on duration Smartphone is the leading device with approx. 50% of the usage duration. Source: GfK Crossmedia Panel Russia | March 2017, Online Population 14+ Also based on the duration of social media usage within the Russian Online Population, the smartphone is the leading device. 52.165.424.188 minutes are spend on the smartphone on social media. 46,313 52,165 7,744 PC Smartphone Tablet Duration in minutes per device 44% 49% 7% Shares 20% 80% 7% 93% Mobile app Mobile browsing Smartphone Tablet Mobile app Mobile browsing Absolute duration (min.) in millions
  17. 25 © GfK November 2, 2017 27 19 10 5

    429 325 62 27 16.2 16.7 6.5 5.1 Top 4 Social media products on the PC VK.com with 70% reach is leading within the social media products. 70% 44% 29% 18% Vk.com Odnoklassniki.ru Facebook Instagram Source: GfK Crossmedia Panel Russia | March 2017, Online Population 14+ Based on the net reach, Vk.com is the leading social media product on the PC. Vk.com is used 429 minutes per month on average and has an average time per visit of 16,2 minutes. Avg. visits per user per month Duration (min.) per user per month Avg. time per visit (min.) Net Reach
  18. 26 © GfK November 2, 2017 86 32 63 12

    773 181 309 59 9.0 5.7 4.9 4.9 Top 4 Social media products on mobile devices Vk.com is by far leading on all usage KPIs (reach, visit, duration). 77% 43% 43% 32% Vk.com Odnoklassniki.ru Instagram Facebook Source: GfK Crossmedia Panel Russia | March 2017, Online Population 14+ Based on the net reach, Vk.com is the leading social media product on mobile devices. Vk.com is observed 773 minutes per month on average and has an average time per visit of 9 minutes. Avg. visits per user per month Duration (min.) per user per month Avg. time per visit (min.) Net Reach
  19. 27 © GfK November 2, 2017 Reach overlaps between social

    media products Two out of three Vk.com users also use Odnoklassniki.ru. Reading example: 66% of Vk.com users also use Odnoklassniki.ru Source: GfK Crossmedia Panel Russia | March 2017, Online Population 14+ Vk.com Odnoklassniki.ru Facebook Instagram Vk.com 100% 91% 94% 98% Odnoklassniki.ru 66% 100% 74% 73% Facebook 51% 54% 100% 65% Instagram 47% 49% 59% 100% While more than 90% of all users of the other offerings use Vk.com. A similar picture is drawn for Odnoklassniki.ru: More than 70% of the users of Facebook, Instagram and Mail.Ru Answers are also using Odnoklassniki.ru.
  20. 29 © GfK November 2, 2017 8 4 4 2

    1 3 4 2 2 2 98 28 56 14 5 31 43 19 22 9 12.3 7.7 14.6 6.5 3.7 9.4 10.0 8.4 9.3 4.1 Top 10 e-commerce products on PCs AliExpress has the highest reach, Wildberries the highest avg. time per visit. 31% 17% 10% 9% 9% 9% 9% 8% 8% 8% AliExpress Ozon.ru Wildberries M.Video Tiu ru Eldorado eBay Yulmart DNS Shop Apteka.RU Based on the net reach, AliExpress is the leading e-commerce product on PC devices. AliExpress users spends most time in minutes per month on average, 98 minutes. However, the avg. time per visit is highest on Wildberries (14,6 min.). Avg. visits per user per month Duration (min.) per user per month Avg. time per visit (min.) Net Reach Source: GfK Crossmedia Panel Russia | March 2017, Online Population 14+
  21. 30 © GfK November 2, 2017 19 4 7 2

    2 10 2 6 3 2 113 24 38 7 9 56 4 30 9 2 5.8 6.0 5.5 3.1 4.0 5.7 2.0 4.7 2.7 1.4 Top 10 e-commerce products on mobile devices AliExpress is, in terms of reach, by far the leading e-commerce product. 45% 8% 7% 7% 6% 5% 5% 5% 5% 5% AliExpress Ozon.ru Wildberries M.Video Eldorado LitRes Alibaba eBay Apteka.RU Piluli.ru Based on the net reach, AliExpress is the leading e-commerce product on mobile devices. AliExpress users spends most time in minutes per month on average, 113 minutes. Avg. visits per user per month Duration (min.) per user per month Avg. time per visit (min.) Net Reach Source: GfK Crossmedia Panel Russia | March 2017, Online Population 14+
  22. 31 © GfK November 2, 2017 Loyalty and engagement per

    visit for key e-commerce products AliExpress is the platform with the most loyal and engaged user. 0 1 2 3 4 5 6 7 8 9 0 2 4 6 8 10 3 4 5 6 5 6 7 5 5 9 Tiu ru Apteka.RU M.Video Yulmart DNS Shop Eldorado Wildberries Ozon.ru eBay AliExpress Loyalty (Visits per UU) Engagement (Avg. Duration per Visit) Size of the circles indicates the number of unique users in millions.
  23. 32 © GfK November 2, 2017 Reach overlaps between e-commerce

    products Highest cross-usage (76%) is between Eldorado users and AliExpress. AliExpress Ozon.ru Wildberries M.Video Eldorado AliExpress 100% 70% 70% 71% 76% Ozon.ru 29% 100% 42% 46% 49% Wildberries 20% 29% 100% 28% 26% M.Video 19% 29% 26% 100% 41% Eldorado 19% 29% 23% 38% 100% Reading example: 29% of AliExpress users also use Ozon.ru. More than 70% of the other e-commerce product users use also the leading product AliExpress. Source: GfK Crossmedia Panel Russia | March 2017, Online Population 14+
  24. 33 © GfK November 2, 2017 We can provide this

    information for many different industries. Below are some examples: Travel Finance Gaming Retail Home & Garden Cosmetics Food Telecommunication Beverages Automotive Medical Electronics Based on the GfK Crossmedia Visualizer taxonomy.
  25. 35 © GfK November 2, 2017 For questions, please contact:

    Frank Landeck Commercial Lead GfK Crossmedia Panel [email protected] T + 49 911 395 3285 | M +49 171 2083985 Stanislav Arkhipov Consultant GfK Crossmedia Panel [email protected] T +7 495 937 72 22
  26. 37 © GfK November 2, 2017 The composition of the

    online population In total, 85 million Russian over the age of 14 have access to the internet. Online 85.1 mio Tablet 21.4 mio PC 69.7 mio Smartphone 52.7 mio Source: GfK Crossmedia Panel Russia, Online Population 14+
  27. 39 © GfK November 2, 2017 The data is based

    on a combination of passive digital and survey-based TV and print behaviour measurement.
  28. 40 © GfK November 2, 2017 Overview of all included

    media channels Passive measurement Internet ▪ access ▪ personal use ▪ intensity of usage ▪ weekly usage duration ▪ used genres, services ▪ type of connection at home ▪ provider at home ▪ usage of selected websites TV Survey Magazines and newspapers ▪ various TV genres ▪ time slots per days ▪ pay-TV-access ▪ lifestyle magazines ▪ food magazines ▪ computer/game magazines ▪ auto/yachting magazines ▪ women‘s magazines ▪ men‘s magazines ▪ home/garden magazines ▪ business/financial news ▪ travel/nature magazines ▪ daily, weekly and weekend newspapers
  29. 41 © GfK November 2, 2017 *Sessions are often also

    known as ‚Visits‘ Unique User (UU): ▪ indicates the number of users visiting a website. A person is hereby counted only once per month, though the user has visited the website more often. Net reach ▪ : share of users within universe, with at least one contact with a website or app Sessions* ▪ (absolute): total number of website visits in one month Sessions per UU: ▪ average number of visits of an unique user within one month Impressions ▪ (absolute): number of page / app requests per month Impressions per UU: ▪ average number of page / app requests per month of an unique user Duration: ▪ absolute usage time (how much time spend on website/app?) Duration per user ▪ (duration/user in minutes): duration per user specifies how long a user was on average on the website / app throughout the month. Usage days ▪ (average per UU): average number of days per month, where a site / app has been used INDEX Engagement: ▪ is a combination of net reach per device and duration and takes visits on a website/app into account as well as intensity of usage (duration). (Index Engagement = 0,3 * Index Net Reach Device + 0,7 * Index Duration) INDEX net reach device ▪ = Net Reach device (Target audience) * 100 / Net Reach device (basis settings) INDEX Duration ▪ (not displayed, only for calculation of the engagement index) = Duration UU(Target audience) * 100 / Duration UU (basis settings) Description of available KPI‘s
  30. 43 © GfK November 2, 2017 We provide an innovative

    view on the market hierarchy: The A2C Taxonomy. Activity Context Content Product The Product Level provides an overview of the ownership hierarchy of the entities on the market. (e.g. Booking.com – Booking.com) On the Content Level there are three basic dimensions: Activity: Basic information on what is being done Booking.com: Price / Product Comparison Context: Determines the business owner Booking.com: Travel Content: Understanding of the content Booking.com: Service Sector Brand
  31. 44 © GfK November 2, 2017 Examples of activities based

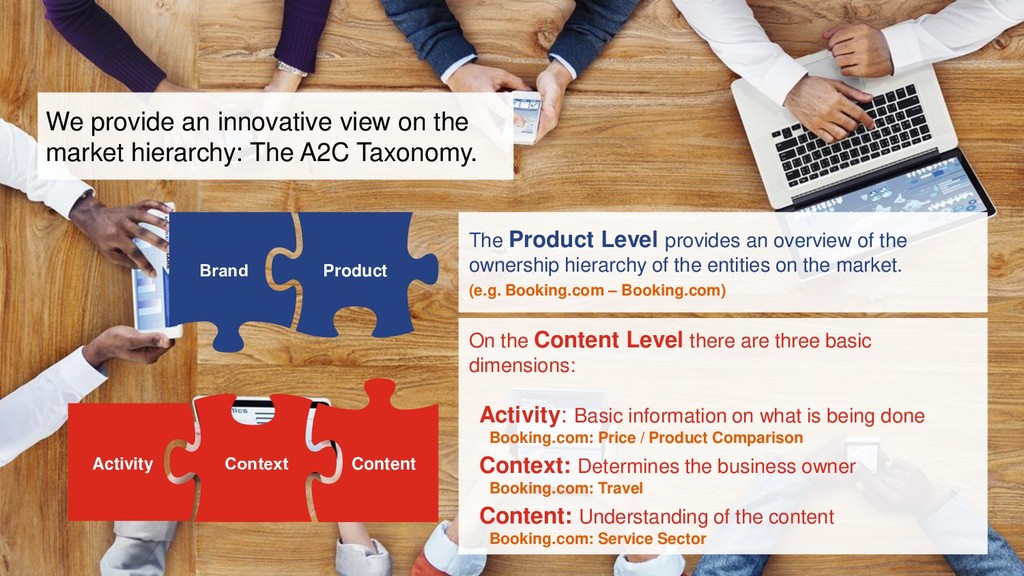
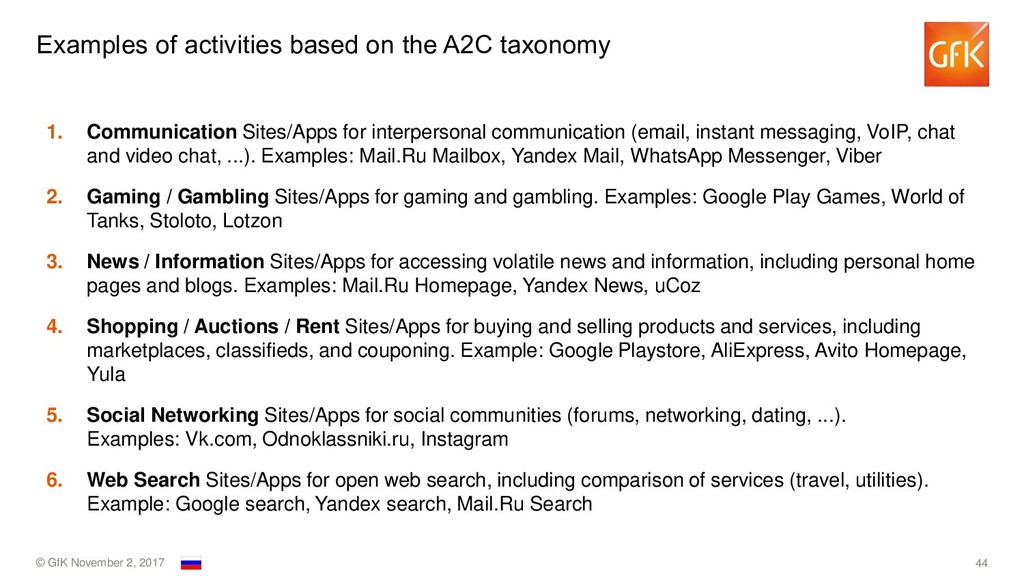
    on the A2C taxonomy 1. Communication Sites/Apps for interpersonal communication (email, instant messaging, VoIP, chat and video chat, ...). Examples: Mail.Ru Mailbox, Yandex Mail, WhatsApp Messenger, Viber 2. Gaming / Gambling Sites/Apps for gaming and gambling. Examples: Google Play Games, World of Tanks, Stoloto, Lotzon 3. News / Information Sites/Apps for accessing volatile news and information, including personal home pages and blogs. Examples: Mail.Ru Homepage, Yandex News, uCoz 4. Shopping / Auctions / Rent Sites/Apps for buying and selling products and services, including marketplaces, classifieds, and couponing. Example: Google Playstore, AliExpress, Avito Homepage, Yula 5. Social Networking Sites/Apps for social communities (forums, networking, dating, ...). Examples: Vk.com, Odnoklassniki.ru, Instagram 6. Web Search Sites/Apps for open web search, including comparison of services (travel, utilities). Example: Google search, Yandex search, Mail.Ru Search