Upgrade to Pro — share decks privately, control downloads, hide ads and more …

Discovering Meaning in Baseball Statistics Through Information Visualization

Discovering Meaning in Baseball Statistics Through Information Visualization

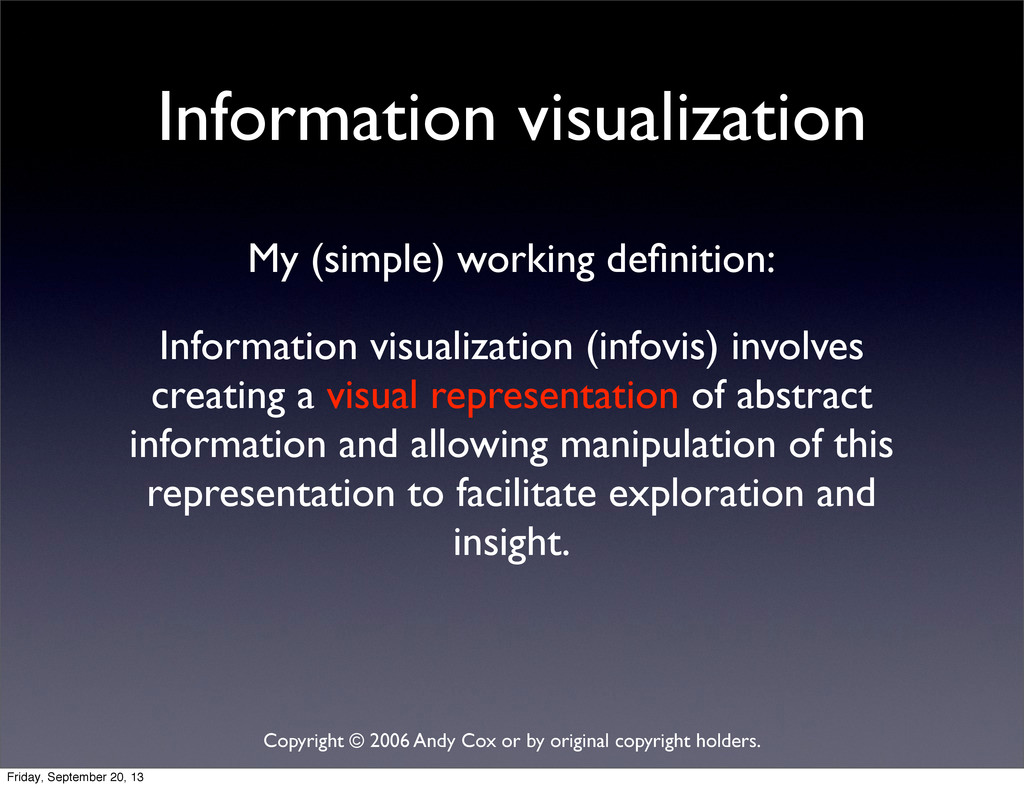
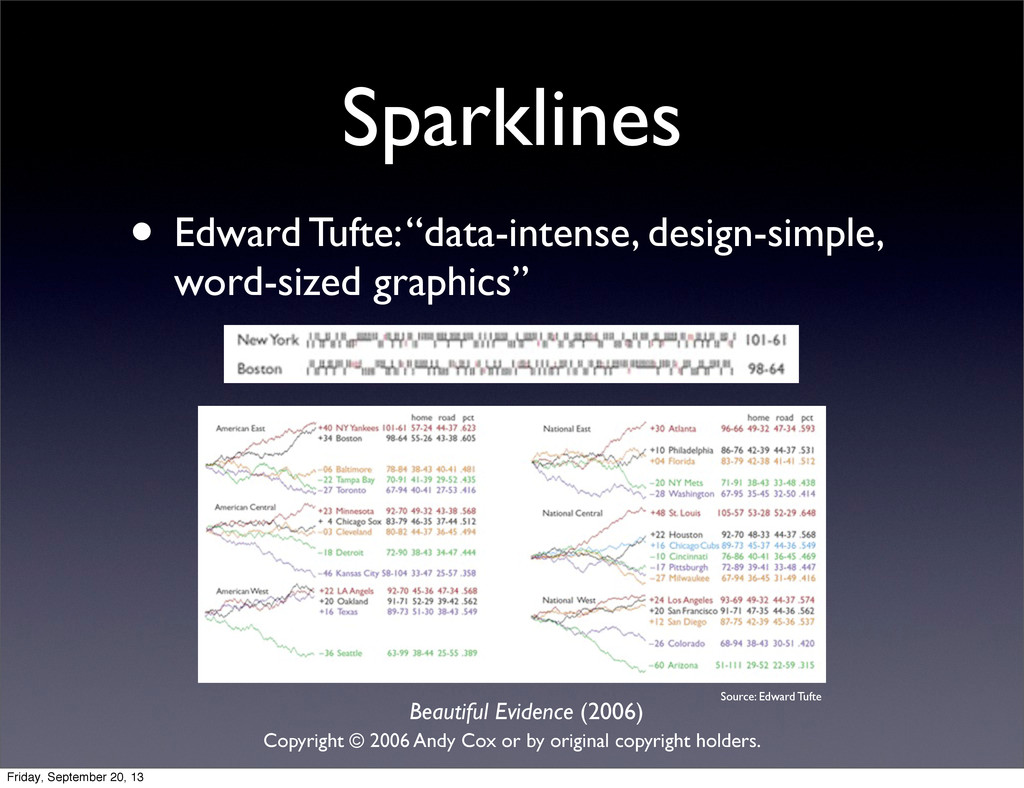
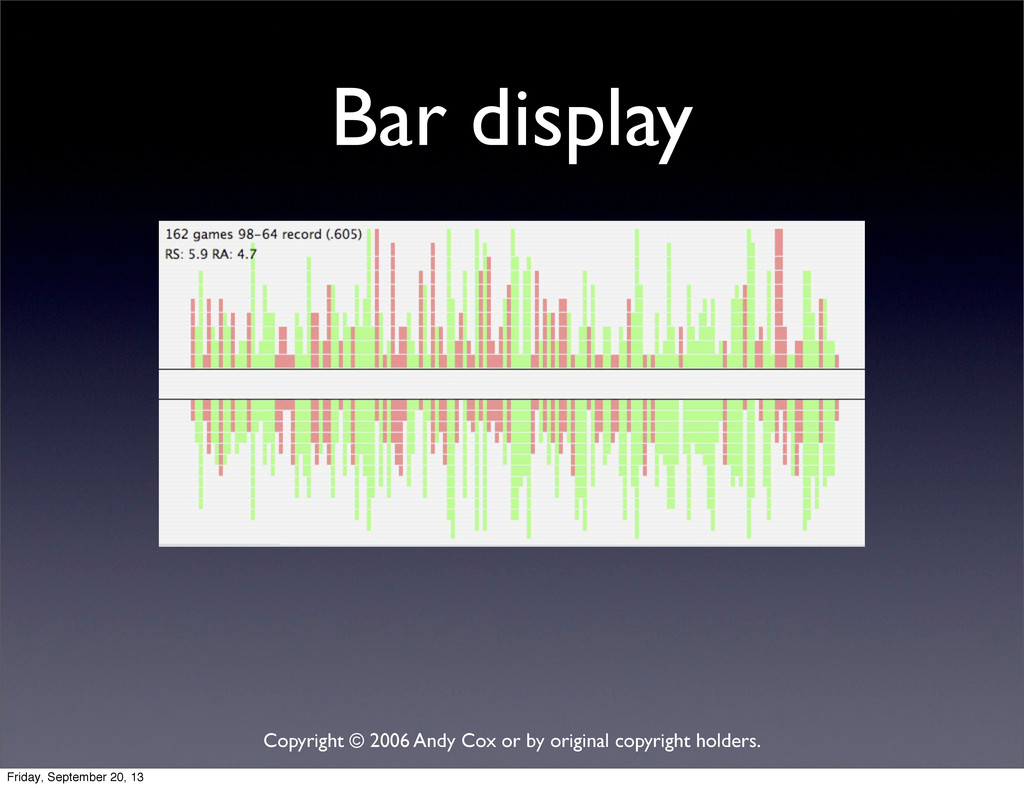
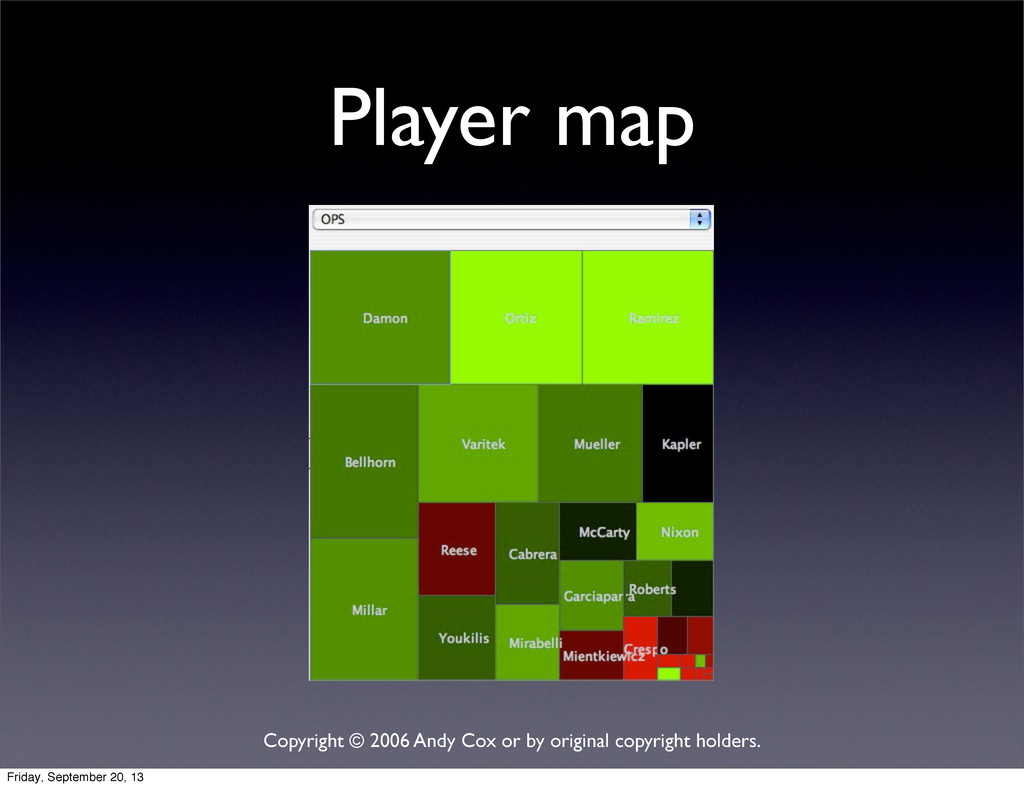
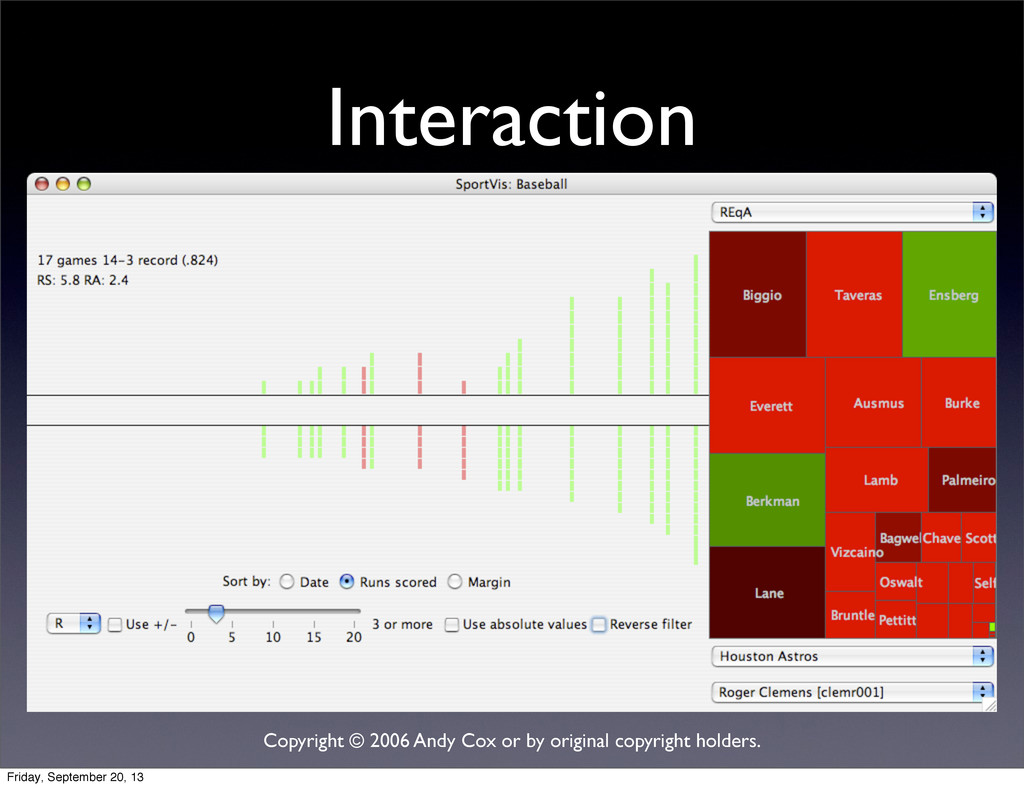
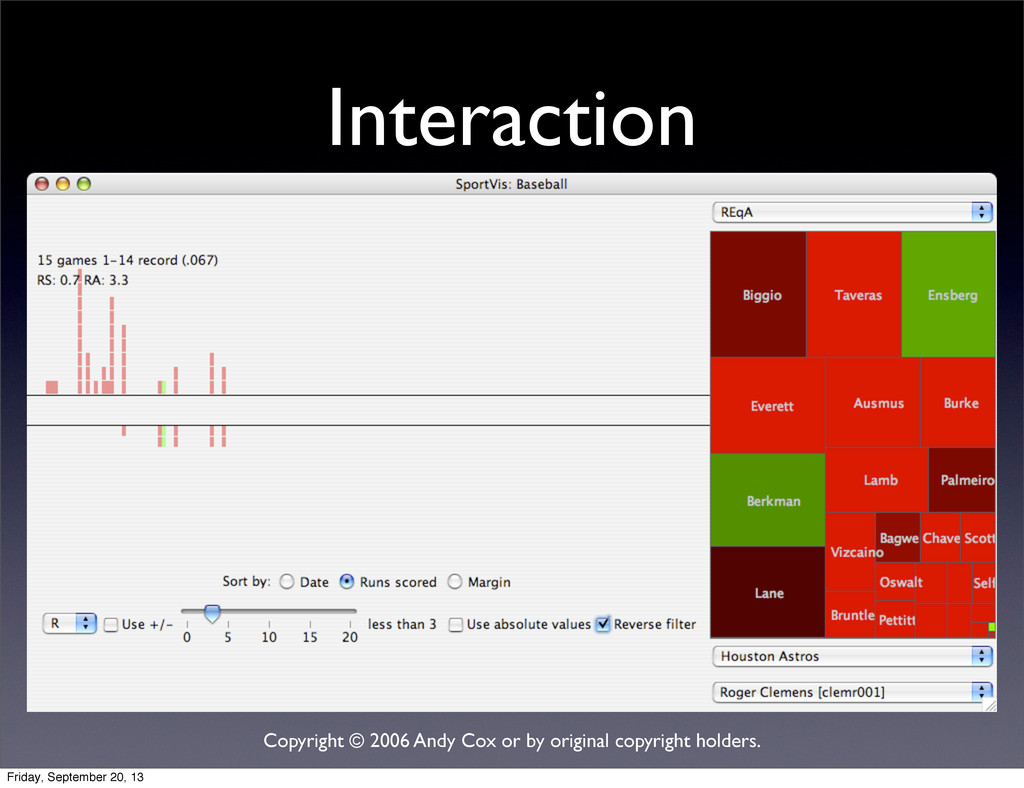
We humans are visual creatures. Thus, any tool that might improve our capacity to understand large datasets through visual display of information patterns deserves our attention. After defining and describing infovis (“information visualization”) systems and their principles, Andy Cox presents applications he has developed, using Retrosheet data and other large-scale datasets, to demonstrate the utility of infovis for rapid summarizing, analyzing, filtering, and understanding baseball data and their interrelationships.

Andy Cox

July 01, 2006
Tweet

More Decks by Andy Cox

Other Decks in Technology

Transcript

  1. Copyright © 2006 Andy Cox or by original copyright holders.

    What is information visualization? Friday, September 20, 13
  2. Copyright © 2006 Andy Cox or by original copyright holders.

    Information visualization Friday, September 20, 13
  3. Copyright © 2006 Andy Cox or by original copyright holders.

    Information visualization • Not the “silver bullet” • Another (valuable) tool for the toolbox Friday, September 20, 13
  4. Copyright © 2006 Andy Cox or by original copyright holders.

    Information visualization • Not the “silver bullet” • Another (valuable) tool for the toolbox • No single definition, but general consensus • 20+ years as research topic Friday, September 20, 13
  5. Copyright © 2006 Andy Cox or by original copyright holders.

    Information visualization • Not the “silver bullet” • Another (valuable) tool for the toolbox • No single definition, but general consensus • 20+ years as research topic • “Infovis in under 10 minutes” • This is my 5-10 minute summary • Nowhere near enough time • Plenty of references at the end Friday, September 20, 13
  6. Copyright © 2006 Andy Cox or by original copyright holders.

    Information visualization My (simple) working definition: Friday, September 20, 13
  7. Copyright © 2006 Andy Cox or by original copyright holders.

    Information visualization Information visualization (infovis) involves creating a visual representation of abstract information and allowing manipulation of this representation to facilitate exploration and insight. My (simple) working definition: Friday, September 20, 13
  8. Copyright © 2006 Andy Cox or by original copyright holders.

    Information visualization Information visualization (infovis) involves creating a visual representation of abstract information and allowing manipulation of this representation to facilitate exploration and insight. My (simple) working definition: Friday, September 20, 13
  9. Copyright © 2006 Andy Cox or by original copyright holders.

    Information visualization Information visualization (infovis) involves creating a visual representation of abstract information and allowing manipulation of this representation to facilitate exploration and insight. My (simple) working definition: Friday, September 20, 13
  10. Copyright © 2006 Andy Cox or by original copyright holders.

    Information visualization Information visualization (infovis) involves creating a visual representation of abstract information and allowing manipulation of this representation to facilitate exploration and insight. My (simple) working definition: Friday, September 20, 13
  11. Copyright © 2006 Andy Cox or by original copyright holders.

    Statistical analysis Friday, September 20, 13
  12. Copyright © 2006 Andy Cox or by original copyright holders.

    Statistical analysis • Useful for finding meaning behind data • Nothing new in baseball performance analysis Friday, September 20, 13
  13. Copyright © 2006 Andy Cox or by original copyright holders.

    Statistical analysis • Useful for finding meaning behind data • Nothing new in baseball performance analysis • Plenty of techniques, tools • e.g., linear regression, Excel, R Friday, September 20, 13
  14. Copyright © 2006 Andy Cox or by original copyright holders.

    Statistical analysis Friday, September 20, 13
  15. Copyright © 2006 Andy Cox or by original copyright holders.

    Statistical analysis • Often must know specific question • Is there a relationship between X and Y? Friday, September 20, 13
  16. Copyright © 2006 Andy Cox or by original copyright holders.

    Statistical analysis • Often must know specific question • Is there a relationship between X and Y? • What if we don’t have a specific question? Friday, September 20, 13
  17. Copyright © 2006 Andy Cox or by original copyright holders.

    Statistical analysis • Often must know specific question • Is there a relationship between X and Y? • What if we don’t have a specific question? • Hypothesis testing vs. exploratory data analysis (Shneiderman, 2001) Friday, September 20, 13
  18. Copyright © 2006 Andy Cox or by original copyright holders.

    Information visualization Information visualization (infovis) involves creating a visual representation of abstract information and allowing manipulation of this representation to facilitate exploration and insight. My (simple) working definition: Friday, September 20, 13
  19. Copyright © 2006 Andy Cox or by original copyright holders.

    Visual representation Friday, September 20, 13
  20. Copyright © 2006 Andy Cox or by original copyright holders.

    Visual representation • Traditional statistical/data graphics • Charts and graphs • Usage dates back to 1800’s (Playfair) • For 2D, hard to beat Friday, September 20, 13
  21. Copyright © 2006 Andy Cox or by original copyright holders.

    Visual representation • Traditional statistical/data graphics • Charts and graphs • Usage dates back to 1800’s (Playfair) • For 2D, hard to beat • Better than aggregates Friday, September 20, 13
  22. Copyright © 2006 Andy Cox or by original copyright holders.

    Visual representation • Traditional statistical/data graphics • Charts and graphs • Usage dates back to 1800’s (Playfair) • For 2D, hard to beat • Better than aggregates • Excel, R, etc. can generate graphics Friday, September 20, 13
  23. Copyright © 2006 Andy Cox or by original copyright holders.

    Visual representation But... Friday, September 20, 13
  24. Copyright © 2006 Andy Cox or by original copyright holders.

    Visual representation • What about more than 2 (or 3) variables? But... Friday, September 20, 13
  25. Copyright © 2006 Andy Cox or by original copyright holders.

    Visual representation • What about more than 2 (or 3) variables? • What about more complex data? • Hierarchical, networks But... Friday, September 20, 13
  26. Copyright © 2006 Andy Cox or by original copyright holders.

    Visual representation Friday, September 20, 13
  27. Copyright © 2006 Andy Cox or by original copyright holders.

    Visual representation • Edward Tufte • Infovis = Tufte not true! Friday, September 20, 13
  28. Copyright © 2006 Andy Cox or by original copyright holders.

    Visual representation • Edward Tufte • Infovis = Tufte not true! • Principles for designing good graphics • Maximize the data/ink ratio • Avoid “chartjunk” Friday, September 20, 13
  29. Copyright © 2006 Andy Cox or by original copyright holders.

    Perception A simple example 0932475091273023857109871 8123739803245798198236731 7527187391877987791610828 9735901870398382095809004 Friday, September 20, 13
  30. Copyright © 2006 Andy Cox or by original copyright holders.

    Perception A simple example 0932475091273023857109871 8123739803245798198236731 7527187391877987791610828 9735901870398382095809004 Friday, September 20, 13
  31. Copyright © 2006 Andy Cox or by original copyright holders.

    Information visualization Information visualization (infovis) involves creating a visual representation of abstract information and allowing manipulation of this representation to facilitate exploration and insight. My (simple) working definition: Friday, September 20, 13
  32. Copyright © 2006 Andy Cox or by original copyright holders.

    Interaction • Biggest difference between infovis and traditional statistical graphics Friday, September 20, 13
  33. Copyright © 2006 Andy Cox or by original copyright holders.

    Interaction • Biggest difference between infovis and traditional statistical graphics • Facilitates rapid browsing and discovery • Select what and how to display • (remember hypothesis testing vs. exploratory data analysis) Friday, September 20, 13
  34. Copyright © 2006 Andy Cox or by original copyright holders.

    Interaction • Biggest difference between infovis and traditional statistical graphics • Facilitates rapid browsing and discovery • Select what and how to display • (remember hypothesis testing vs. exploratory data analysis) • Maybe not so much answering questions as asking better ones... Friday, September 20, 13
  35. Copyright © 2006 Andy Cox or by original copyright holders.

    Interaction • Selecting data you want to see Friday, September 20, 13
  36. Copyright © 2006 Andy Cox or by original copyright holders.

    Interaction • Selecting data you want to see • Selecting a different representation Friday, September 20, 13
  37. Copyright © 2006 Andy Cox or by original copyright holders.

    Interaction • Selecting data you want to see • Selecting a different representation • Selecting the perspective Friday, September 20, 13
  38. Copyright © 2006 Andy Cox or by original copyright holders.

    Interaction Example technique: Dynamic Queries Friday, September 20, 13
  39. Copyright © 2006 Andy Cox or by original copyright holders.

    Interaction • Rapid, incremental filtering of data Example technique: Dynamic Queries Friday, September 20, 13
  40. Copyright © 2006 Andy Cox or by original copyright holders.

    Interaction • Rapid, incremental filtering of data • Immediate and continuous display of results Example technique: Dynamic Queries Friday, September 20, 13
  41. Copyright © 2006 Andy Cox or by original copyright holders.

    Interaction • Rapid, incremental filtering of data • Immediate and continuous display of results • Based on idea that questions are imprecise, evolve during discovery Example technique: Dynamic Queries Friday, September 20, 13
  42. Copyright © 2006 Andy Cox or by original copyright holders.

    Interaction Example technique: Dynamic Queries Source: Maryland HCIL Friday, September 20, 13
  43. Copyright © 2006 Andy Cox or by original copyright holders.

    Interaction Example technique: Dynamic Queries Source: Maryland HCIL Friday, September 20, 13
  44. Copyright © 2006 Andy Cox or by original copyright holders.

    Exploration and insight Friday, September 20, 13
  45. Copyright © 2006 Andy Cox or by original copyright holders.

    Exploration and insight Visual Information Seeking Mantra: Friday, September 20, 13
  46. Copyright © 2006 Andy Cox or by original copyright holders.

    Exploration and insight Visual Information Seeking Mantra: Overview first, Friday, September 20, 13
  47. Copyright © 2006 Andy Cox or by original copyright holders.

    Exploration and insight Visual Information Seeking Mantra: Overview first, zoom and filter, Friday, September 20, 13
  48. Copyright © 2006 Andy Cox or by original copyright holders.

    Exploration and insight Visual Information Seeking Mantra: Overview first, zoom and filter, then details-on-demand Friday, September 20, 13
  49. Copyright © 2006 Andy Cox or by original copyright holders.

    Exploration and insight Visual Information Seeking Mantra: Overview first, zoom and filter, then details-on-demand (Shneiderman, The Eyes Have It, 1996) Friday, September 20, 13
  50. Copyright © 2006 Andy Cox or by original copyright holders.

    Enough talk. How about some examples? Friday, September 20, 13
  51. Copyright © 2006 Andy Cox or by original copyright holders.

    Parallel coordinates Friday, September 20, 13
  52. Copyright © 2006 Andy Cox or by original copyright holders.

    Parallel coordinates • Helps solve the “more than 2D” problem Friday, September 20, 13
  53. Copyright © 2006 Andy Cox or by original copyright holders.

    Parallel coordinates • Helps solve the “more than 2D” problem • Detecting relationships in multivariate data Friday, September 20, 13
  54. Copyright © 2006 Andy Cox or by original copyright holders.

    Source: XmdvTool Friday, September 20, 13
  55. Copyright © 2006 Andy Cox or by original copyright holders.

    Map of the Market Friday, September 20, 13
  56. Copyright © 2006 Andy Cox or by original copyright holders.

    Map of the Market • SmartMoney.com Friday, September 20, 13
  57. Copyright © 2006 Andy Cox or by original copyright holders.

    Map of the Market • SmartMoney.com • Treemap technique for stock market data • Recursively divides rectangle by some attribute of the data • Hierarchy: Sector>Industry>Company • Area: Market Capitalization ($) • Color: Change in stock price Friday, September 20, 13
  58. Copyright © 2006 Andy Cox or by original copyright holders.

    Source: SmartMoney.com Friday, September 20, 13
  59. Copyright © 2006 Andy Cox or by original copyright holders.

    So what does this have to do with baseball? Friday, September 20, 13
  60. Copyright © 2006 Andy Cox or by original copyright holders.

    Baseball examples Friday, September 20, 13
  61. Copyright © 2006 Andy Cox or by original copyright holders.

    Baseball examples • Statistical graphics are everywhere Friday, September 20, 13
  62. Copyright © 2006 Andy Cox or by original copyright holders.

    Baseball examples • Statistical graphics are everywhere • A lot of Excel charts Friday, September 20, 13
  63. Copyright © 2006 Andy Cox or by original copyright holders.

    Baseball examples • Statistical graphics are everywhere • A lot of Excel charts • General infovis techniques and systems that use baseball data Friday, September 20, 13
  64. Copyright © 2006 Andy Cox or by original copyright holders.

    Table Lens Rao & Card (1994) Source: ACM Friday, September 20, 13
  65. Copyright © 2006 Andy Cox or by original copyright holders.

    Sparklines • Edward Tufte: “data-intense, design-simple, word-sized graphics” Beautiful Evidence (2006) Source: Edward Tufte Friday, September 20, 13
  66. Copyright © 2006 Andy Cox or by original copyright holders.

    Sparklines • Hardball Times has sparkline generator Source: The Hardball Times Friday, September 20, 13
  67. Copyright © 2006 Andy Cox or by original copyright holders.

    Other sports Tennis Viewer Source: IEEE Friday, September 20, 13
  68. Copyright © 2006 Andy Cox or by original copyright holders.

    But nothing specifically for baseball Friday, September 20, 13
  69. Copyright © 2006 Andy Cox or by original copyright holders.

    Future ideas • Player info per game • More granular display • Plate appearances vs. games • Love to hear yours! Friday, September 20, 13
  70. Copyright © 2006 Andy Cox or by original copyright holders.

    • Not “better than” - “in addition to” Conclusions Friday, September 20, 13
  71. Copyright © 2006 Andy Cox or by original copyright holders.

    • Not “better than” - “in addition to” • A tool for helping to ask better questions Conclusions Friday, September 20, 13
  72. Copyright © 2006 Andy Cox or by original copyright holders.

    • Not “better than” - “in addition to” • A tool for helping to ask better questions • Think about applications Conclusions Friday, September 20, 13
  73. Copyright © 2006 Andy Cox or by original copyright holders.

    References • Human-Centered Computing Educational Digital Library http://hcc.cc.gatech.edu • Readings in Information Visualization, Card, Mackinlay, Shneiderman (1998) • Information Visualization, Spence (2001) • Information Visualization: Perception for Design, Ware (2004) • Information Dashboard Design, Few (2006) • SmartMoney.com Map of the Market http://www.smartmoney.com/maps/ Friday, September 20, 13
  74. Copyright © 2006 Andy Cox or by original copyright holders.

    References • Ben Shneiderman (University of Maryland) • Dynamic queries (1994, with C. Ahlberg) • Visual Information Seeking Mantra (1996) • Edward Tufte • The Visual Display of Quantitative Information (2001 2e) • Envisioning Information (1990) • Visual Explanations (1997) • Beautiful Evidence (2006) Friday, September 20, 13
  75. Copyright © 2006 Andy Cox or by original copyright holders.

    References • http://www.sportvis.com (My site) Friday, September 20, 13
  76. Copyright © 2006 Andy Cox or by original copyright holders.

    Acknowledgements • Retrosheet • John Stasko (Georgia Tech) • SABR Friday, September 20, 13
  77. Copyright © 2006 Andy Cox or by original copyright holders.

    Thank you! http://www.sportvis.com [email protected] Friday, September 20, 13