Upgrade to Pro — share decks privately, control downloads, hide ads and more …

Big Data as a game-changer of clinical research strategies by Rafael San Miguel & Dr. Javier Gómez Pavón at Big Data Spain 2015

Big Data as a game-changer of clinical research strategies by Rafael San Miguel & Dr. Javier Gómez Pavón at Big Data Spain 2015

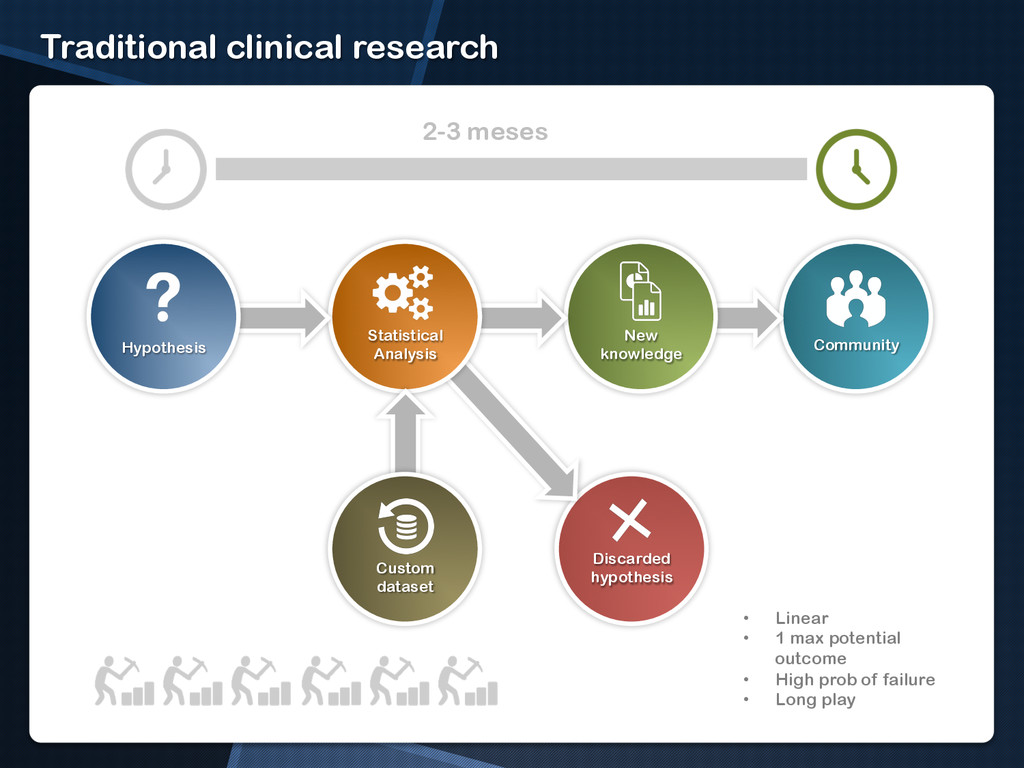
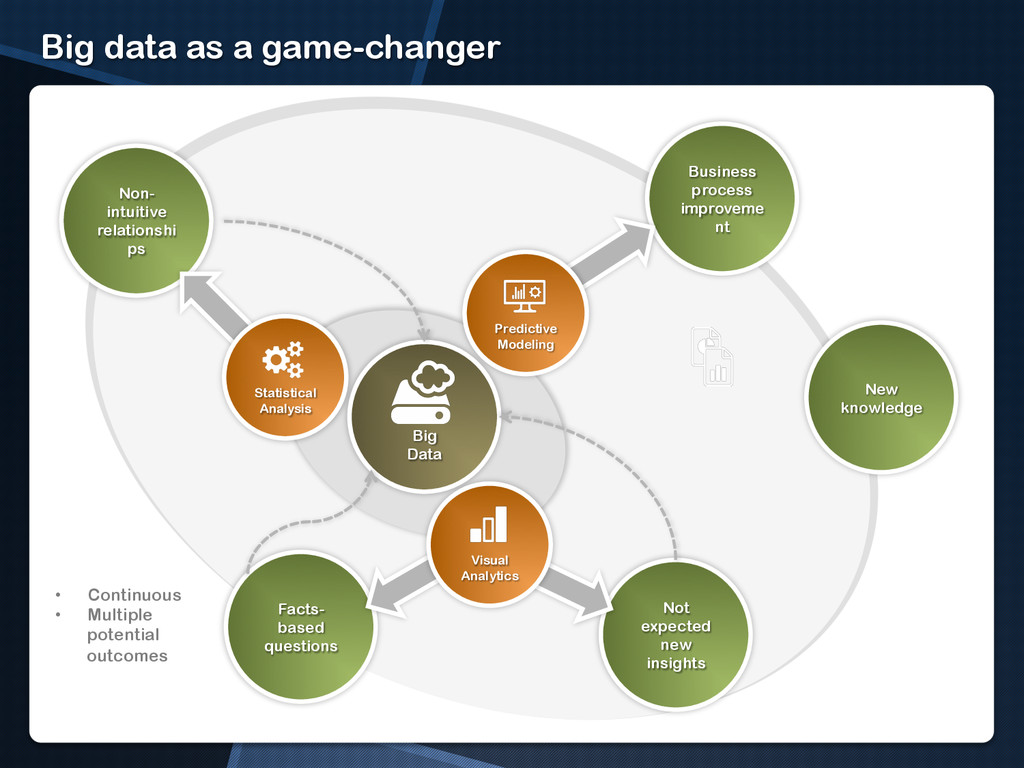
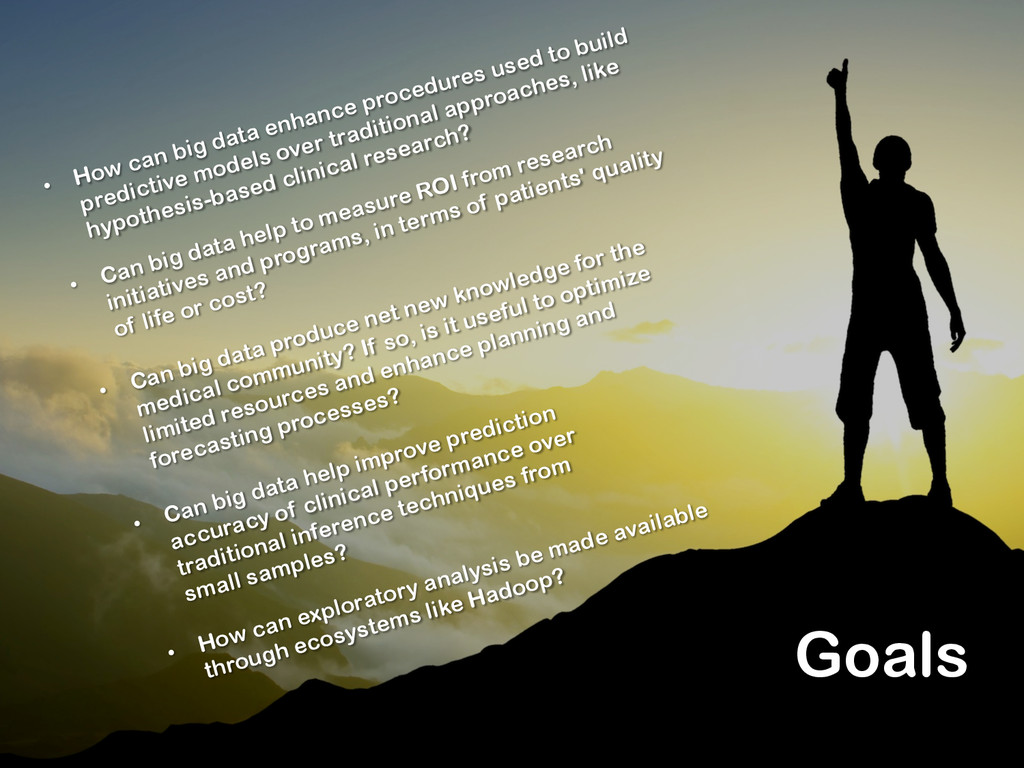
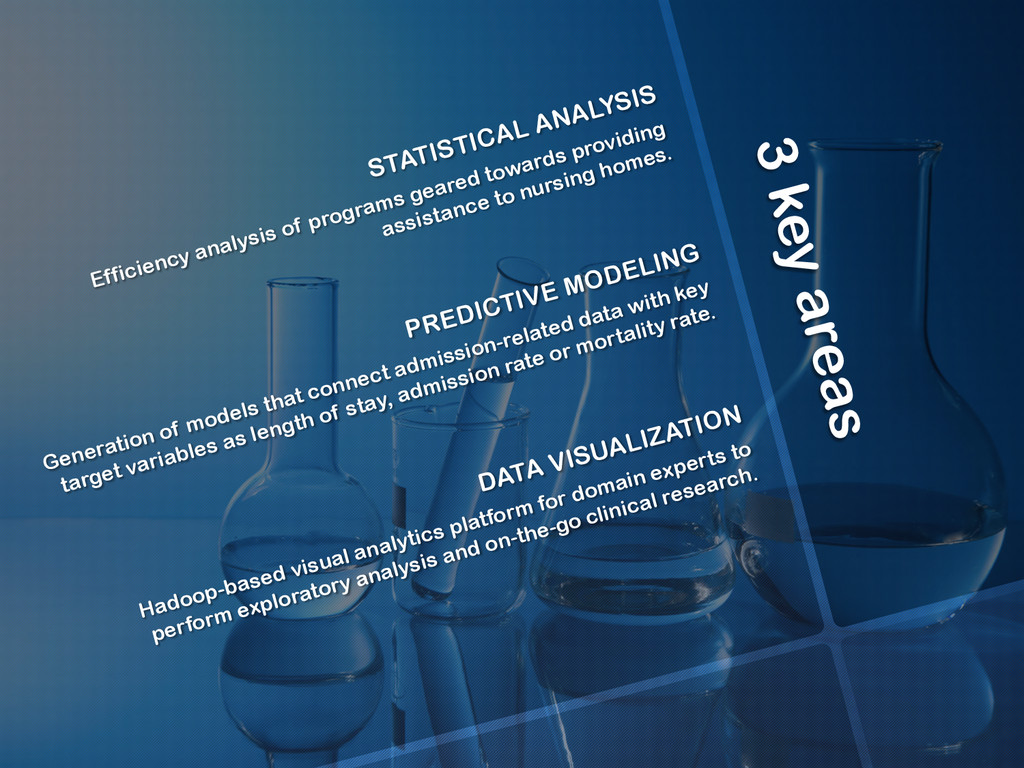
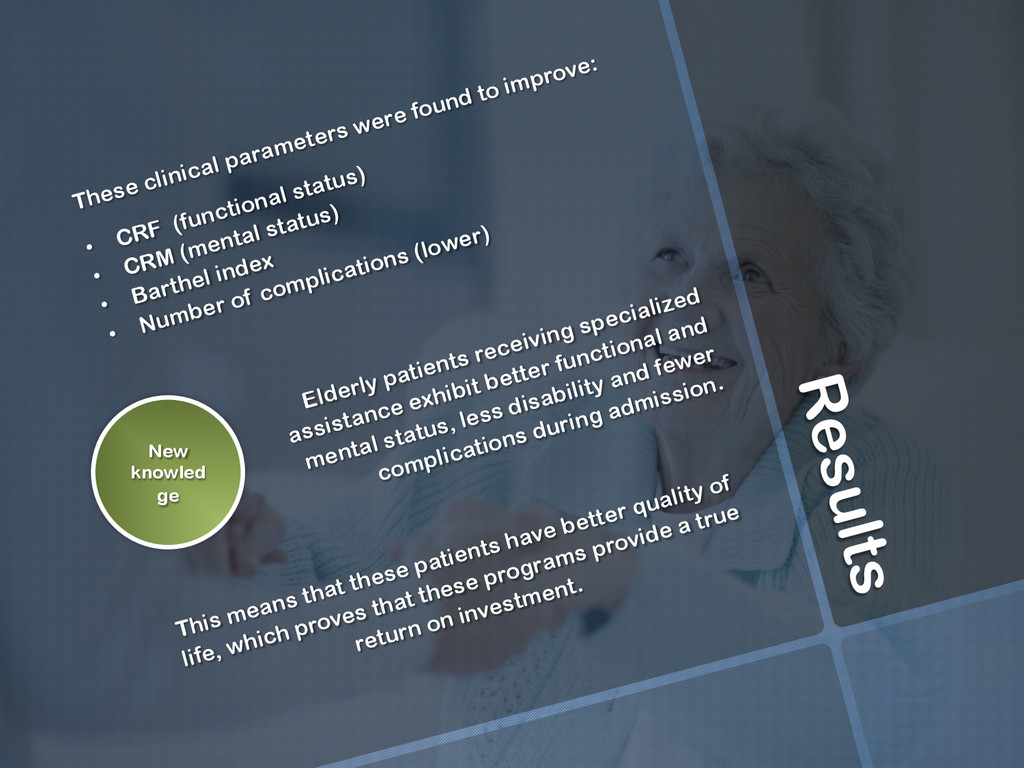
Geriatrics Medicine constitutes a clinical research field in which big data, statistical analysis, machine-learning and visualization techniques can provide relevant, solid and lasting benefits, including performance optimization and enhancements in quality of care.
Those benefits translate into improvement of patients' quality of life, cost rationalization and better use of resources in the public health system.

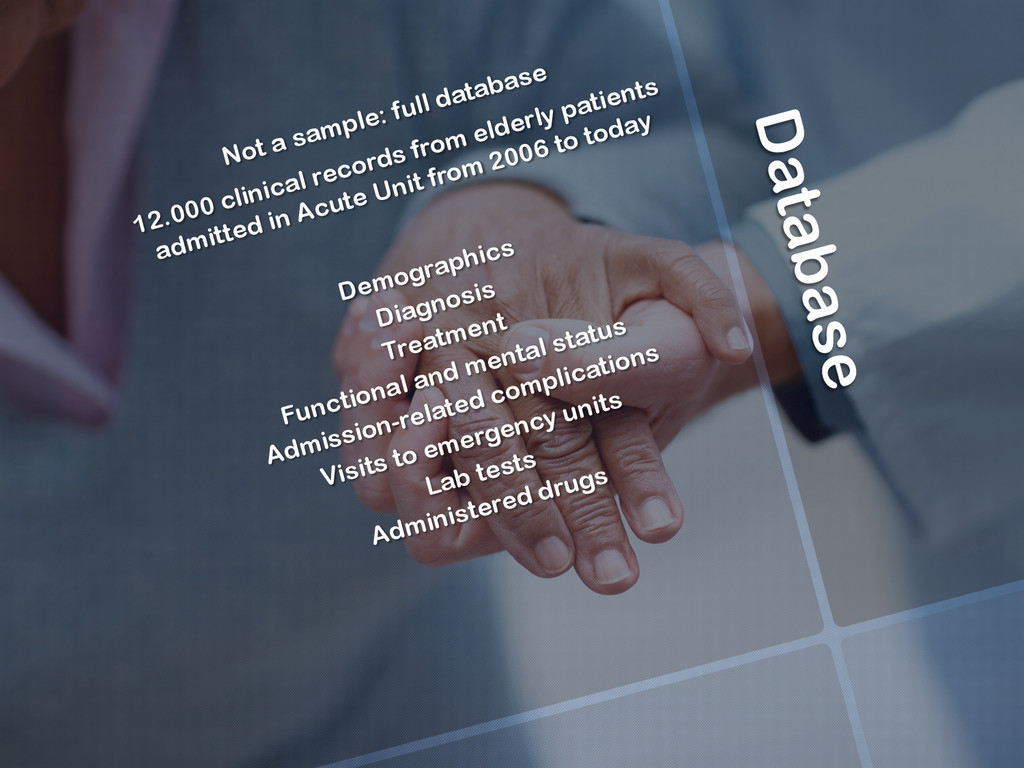
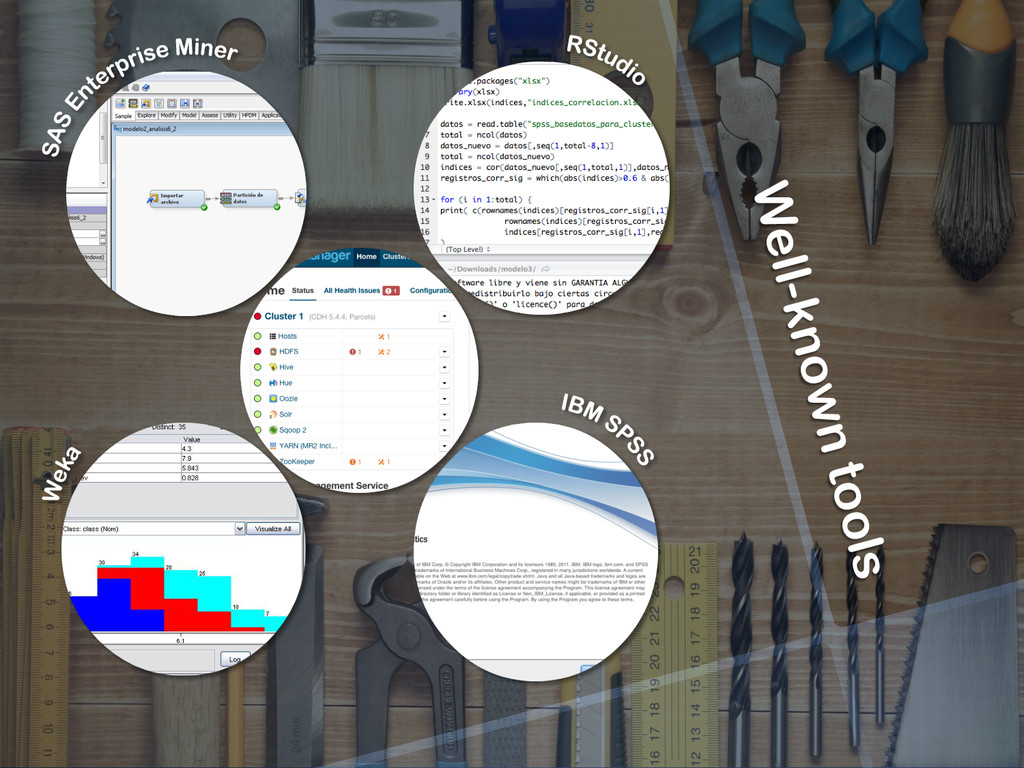
In this talk, authors will explain how they have used the aforementioned tools with elderly patients' data to realize those benefits.

Session presented at Big Data Spain 2015 Conference
15th Oct 2015
Kinépolis Madrid
http://www.bigdataspain.org
Event promoted by: http://www.paradigmatecnologico.com
Abstract: http://www.bigdataspain.org/program/thu/slot-6.html

Big Data Spain

October 22, 2015
Tweet

More Decks by Big Data Spain

Other Decks in Technology

Transcript

  1. BIG DATA AS A GAME- CHANGER OF CLINICAL RESEARCH STRATEGIES

    Rafael San Miguel Carrasco PhD Javier Gómez Pavón PhD Beatriz Ares Castro-Conde
  2. In the backpack: •  Having read a few books about

    R, SAS, Hadoop and statistics •  The feeling that healthcare would be a good place to start
  3. How it all started } I am not sure what you

    are trying to achieve.” Starbucks, February 2015
  4. How it all ended } We should create a company to

    sell this as a product.” Irish Pub, September 2015
  5. Community Traditional clinical research Discarded hypothesis New knowledge Statistical Analysis

    Custom dataset Hypothesis 2-3 meses •  Linear •  1 max potential outcome •  High prob of failure •  Long play
  6. Big data as a game-changer Big Data Business process improveme

    nt Not expected new insights Facts- based questions Non- intuitive relationshi ps Visual Analytics Predictive Modeling Statistical Analysis New knowledge •  Continuous •  Multiple potential outcomes
  7. Goals •  How can big data enhance procedures used to

    build predictive models over traditional approaches, like hypothesis-based clinical research? •  Can big data help to measure ROI from research initiatives and programs, in terms of patients' quality of life or cost? •  Can big data produce net new knowledge for the medical community? If so, is it useful to optimize limited resources and enhance planning and forecasting processes? •  How can exploratory analysis be made available through ecosystems like Hadoop? •  Can big data help improve prediction accuracy of clinical performance over traditional inference techniques from small samples?
  8. 3 key areas STATISTICAL ANALYSIS Efficiency analysis of programs geared

    towards providing assistance to nursing homes. PREDICTIVE MODELING Generation of models that connect admission-related data with key target variables as length of stay, admission rate or mortality rate. DATA VISUALIZATION Hadoop-based visual analytics platform for domain experts to perform exploratory analysis and on-the-go clinical research.
  9. Database Not a sample: full database 12.000 clinical records from

    elderly patients admitted in Acute Unit from 2006 to today Demographics Diagnosis Treatment Functional and mental status Admission-related complications Visits to emergency units Lab tests Administered drugs
  10. Background Programs geared towards providing assistance from a geriatrics doctor

    to nursing homes •  Give better care to elderly patients •  Fewer support from hospitals •  Lowering the cost to deliver healthcare Goal: validate that these programs can provide the expected ROI Target parameters •  CRF (functional status) •  CRM (mental status) •  Barthel index •  Number of complications (lower) •  Admissions •  Readmissions •  LOS •  Survival •  Lab tests •  Number of administered drugs
  11. Methodology Chi-Square test (X^2 statistic) was used to check for

    an statistically significant difference in key clinical variables between patients receiving specialized assistance and the control group.
  12. Results These clinical parameters were found to improve: •  CRF

    (functional status) •  CRM (mental status) •  Barthel index •  Number of complications (lower) This means that these patients have better quality of life, which proves that these programs provide a true return on investment. Elderly patients receiving specialized assistance exhibit better functional and mental status, less disability and fewer complications during admission. New knowled ge
  13. Background Understanding what features of a nursing home lead to

    higher performance constitute a desirable goal for the medical community, because … Length of stay becomes a key clinical variable after an elderly patient is admitted., because … Patients mortality is a key clinical variable. I guess this raises no discussion …
  14. Agnostic approach No prior questions or hypothesis for the analysis

    No focus on particular input variables … and multiple iterations/configurations to come up with as many results as possible
  15. Adverse reactions to drugs leading to higher mortality rate ITERATION

    1 Mortality can be fully predicted through another variable: Place of Exitus ITERATION 2 Mortality can be predicted through another variable: Morphine ITERATION 3 Mortality can be predicted through several variables: Digoxin Number of lab tests Occurrence of pressure ulcers Non- intuitive relations hips
  16. We can predict length of stay LOS can be predicted

    through: Previous number of admissions Gender Diagnoses as acute kidney failure, respiratory infection and acute bronchitis Barthel index prior to admission Falls Total amount of administered drugs Need for urinary catheter Infections at hospital The resulting model was found to be statistically signficant, accounting for 95,23% (R-Square) of the target variable's variance. Business process improve ment
  17. We can predict admission rate The transformed variable that represents

    the inverse of the number of beds in the nursing home can accurately predict the admission rate from that nursing home. The model can explain up to 86% of the target's variance. A Geriatric Unit can accurately forecast the number of admissions from currently served nursing homes, and make better choices with regards to new nursing homes to be served in the future. Business process improve ment
  18. Background Providing domain experts with an effective tool to discover

    patterns or relationships among data variables through exploratory analysis and visual inspection. A tool to go beyond reported findings and discover new insights in the datasets. Using Hadoop to ensure that it could scale out to process millions of clinical records with literally no changes to the current architecture.
  19. •  CIE-9 value 428 is selected from the diagnosis list

    •  Charts and indicators related to gender, age, year of admission, CRF, CRM and Barthel index are updated and displayed. What are the defining characteristics of a patient with a cardiac insufficiency? Most frequent profile is a 85-95 years old patient, woman, with Barthel index higher than average. Diagnosis 428 All diagnoses New knowled ge
  20. •  CIE-9 value 486 is selected from the diagnosis list.

    The chart displaying yearly number of admissions is updated. Which trends are observed in admissions related to pneumonia? The number of admissions related to pneumonia was 81 in 2007 and 230 in 2014, which means that it has increased by 4 times in the last 7 years. Not expected new insights
  21. Case #3 •  Hospital A is selected from the Source

    of Admission list. The number of readmissions is 548 from a total of 4.248; therefore, the readmission rate is 12% •  For Hospital B, the number of readmissions is 164 from a total of 1.830, so the readmission rate is only 8%. Are there variations in readmission rates for patients from Hospital and Hospital B? Therefore, readmission rate for patients from Hospital A seems to be higher than from Hospital B. New knowled ge
  22. •  2014 is selected from the list of years How

    was workload distributed among doctors in the Acute Unit in 2014? Most patients are admitted by noon Doctors’ workload requires further review Doctors should specialize in ITU and respiratory diseases Business process improve ment Not expected new insights New knowled ge
  23. Looking into the future What we did Identified needs Scenarios

    for implementation Rese arch Docto rs Mana gers Stake holde rs Man age ment Phar ma Fina nce HR
  24. Takeaways Big data analytics can be more efficient than hypothesis-based

    research Exploratory analysis is a must when it comes to discover net new knowledge Predictive modeling is geared towards business process improvement Extracting insights shouldn’t be a one-shot activity, but a continuous process 1 2 3 4