Upgrade to Pro — share decks privately, control downloads, hide ads and more …

Turnstile - IEMS 303 Final Presentation

Brian Lange
December 05, 2013

Turnstile - IEMS 303 Final Presentation

Predicting CTA Ridership with multivariate regression for Statistics I at Northwestern University

Brian Lange

December 05, 2013
Tweet

Other Decks in Research

Transcript

  1. Project Overview Model and predict future ‘L’ weekday ridership based

    on existing ridership data from previous years Data Collection Data Analysis Predict Ridership on the CTA
  2. Other factors to consider: Consistent outliers (gay pride parade, etc.)

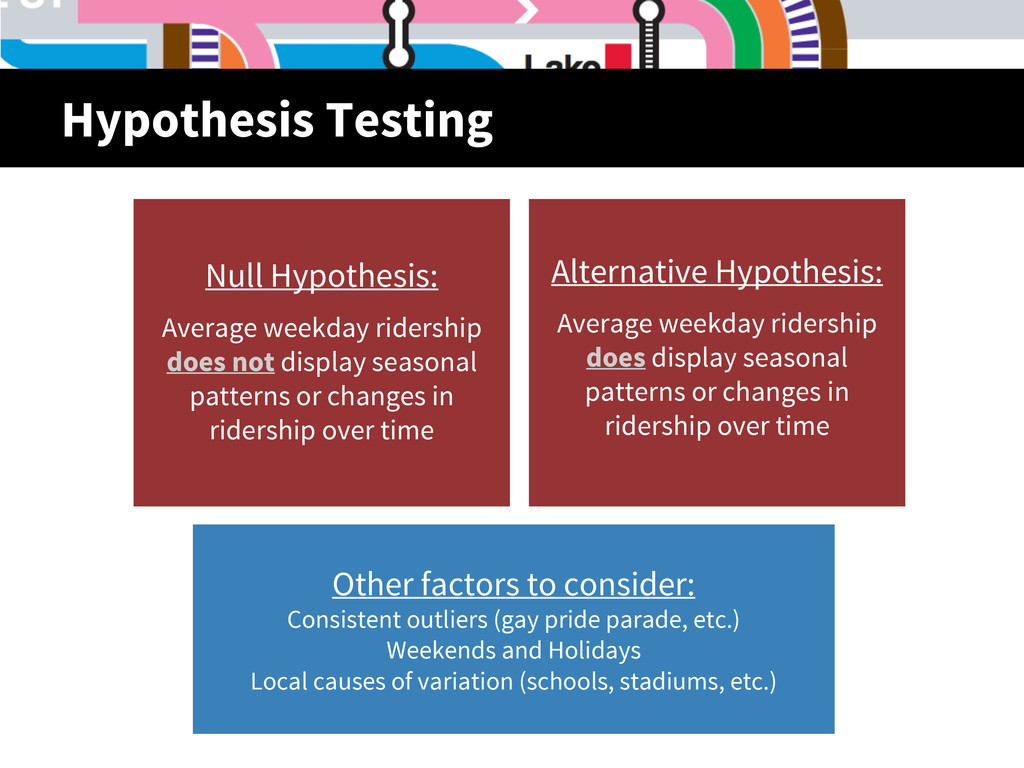
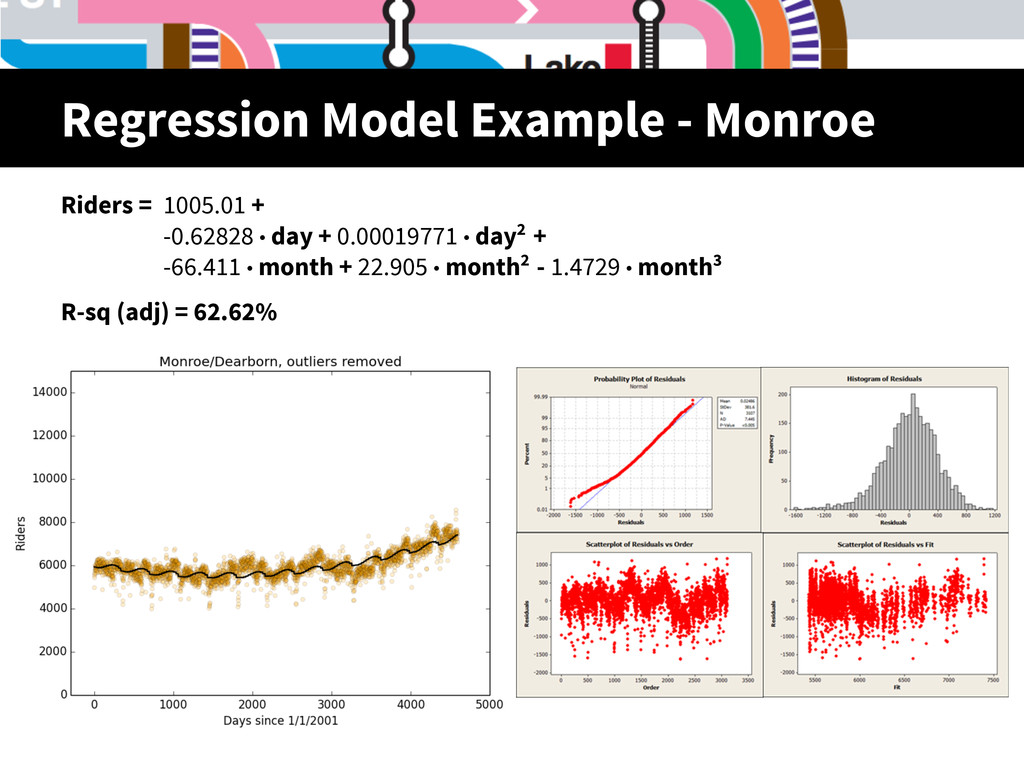
    Weekends and Holidays Local causes of variation (schools, stadiums, etc.) Null Hypothesis: Average weekday ridership does not display seasonal patterns or changes in ridership over time Hypothesis Testing Alternative Hypothesis: Average weekday ridership does display seasonal patterns or changes in ridership over time
  3. Focusing on Commuters Data Collection & Processing Removed weekends and

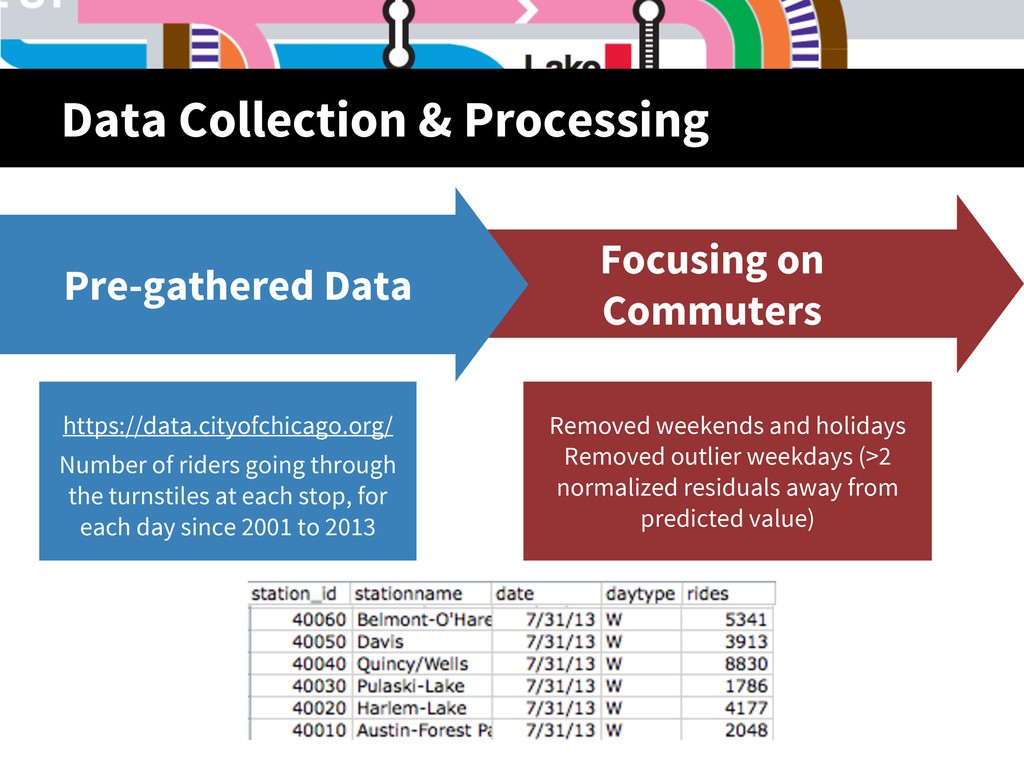
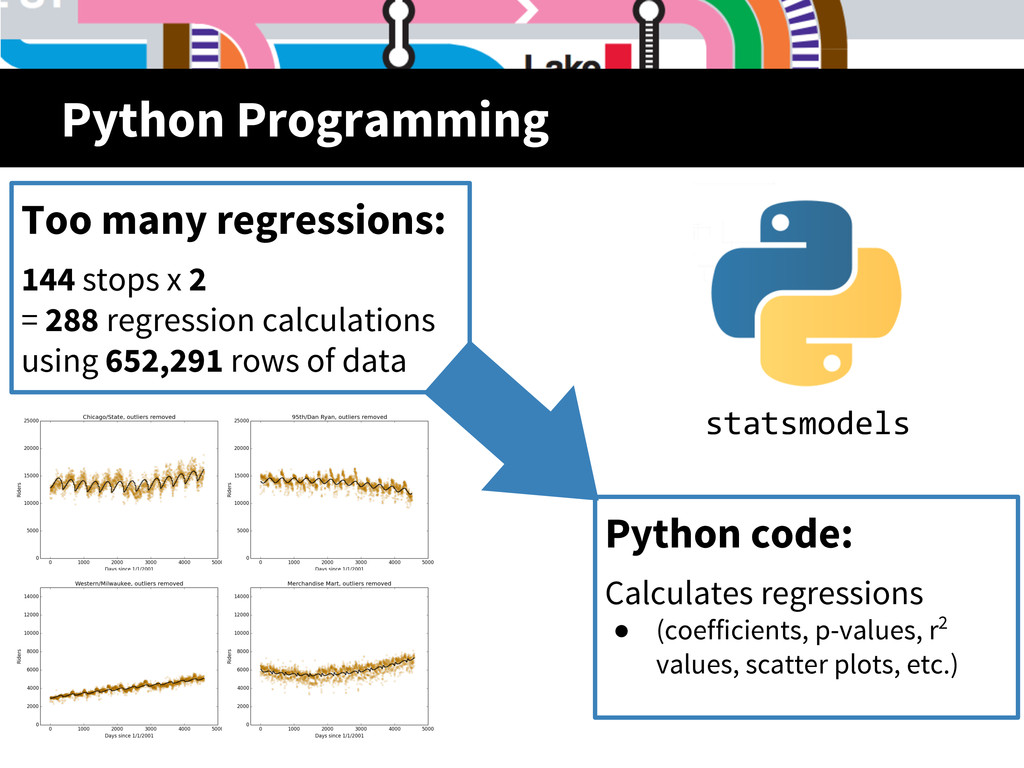
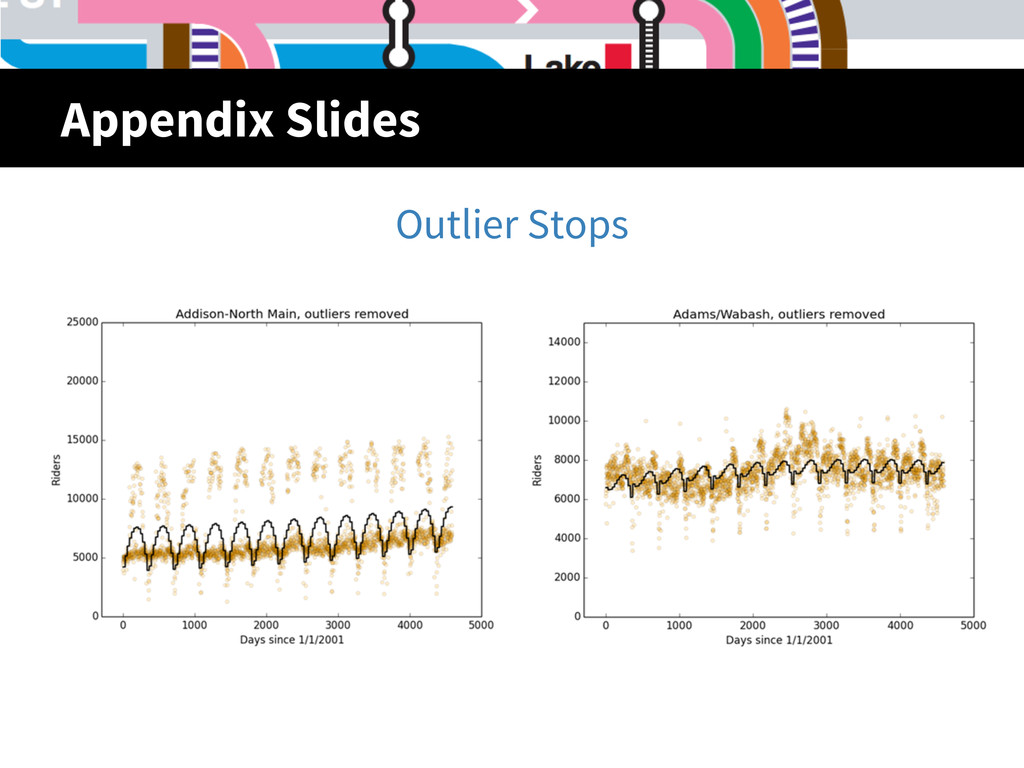
    holidays Removed outlier weekdays (>2 normalized residuals away from predicted value) Pre-gathered Data https://data.cityofchicago.org/ Number of riders going through the turnstiles at each stop, for each day since 2001 to 2013
  4. Python Programming Python code: Calculates regressions • (coefficients, p-values, r2

    values, scatter plots, etc.) Too many regressions: 144 stops x 2 = 288 regression calculations using 652,291 rows of data statsmodels
  5. Regression Model Example - Monroe Riders = 1005.01 + -0.62828

    • day + 0.00019771 • day2 + -66.411 • month + 22.905 • month2 - 1.4729 • month3 R-sq (adj) = 62.62%
  6. Appendix Slides: Rides = 4514.4 - 0.424293 day +0.00014457 day^2

    R-Sq(adj) = 3.16% Initial Regression Model
  7. Limitations: Causes of Variation Weekly fluctuations Local Factors (Schools, Stadiums,

    etc.) Trending neighborhoods Future projects including new buildings or changes to CTA policies can not be predicted