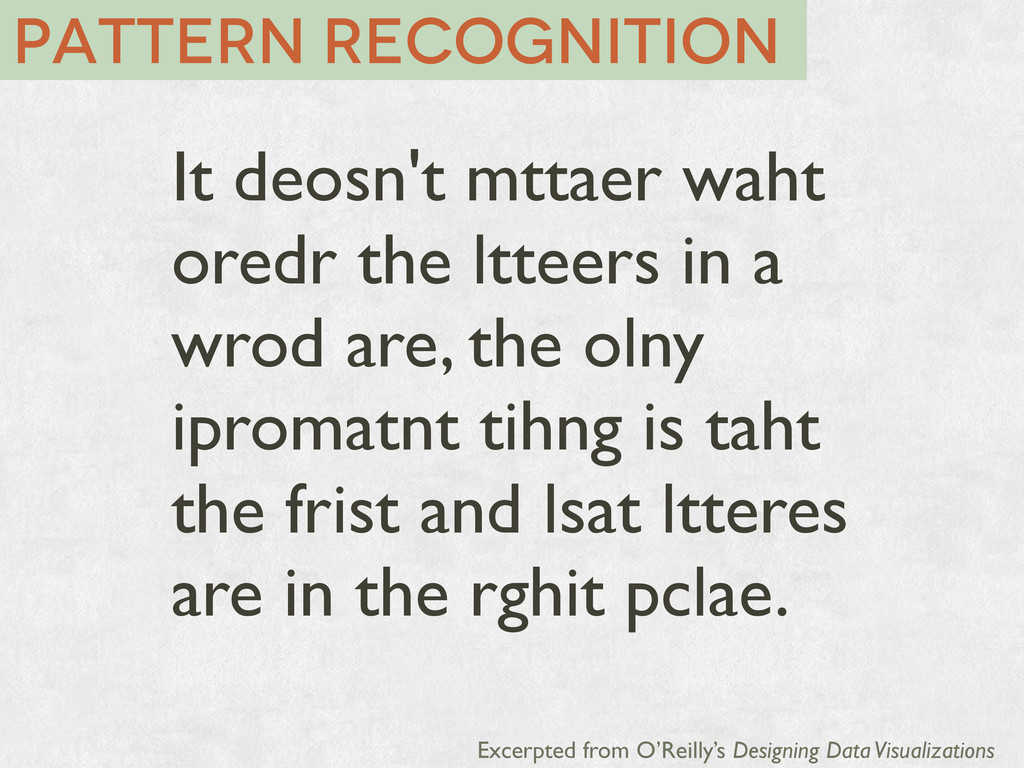
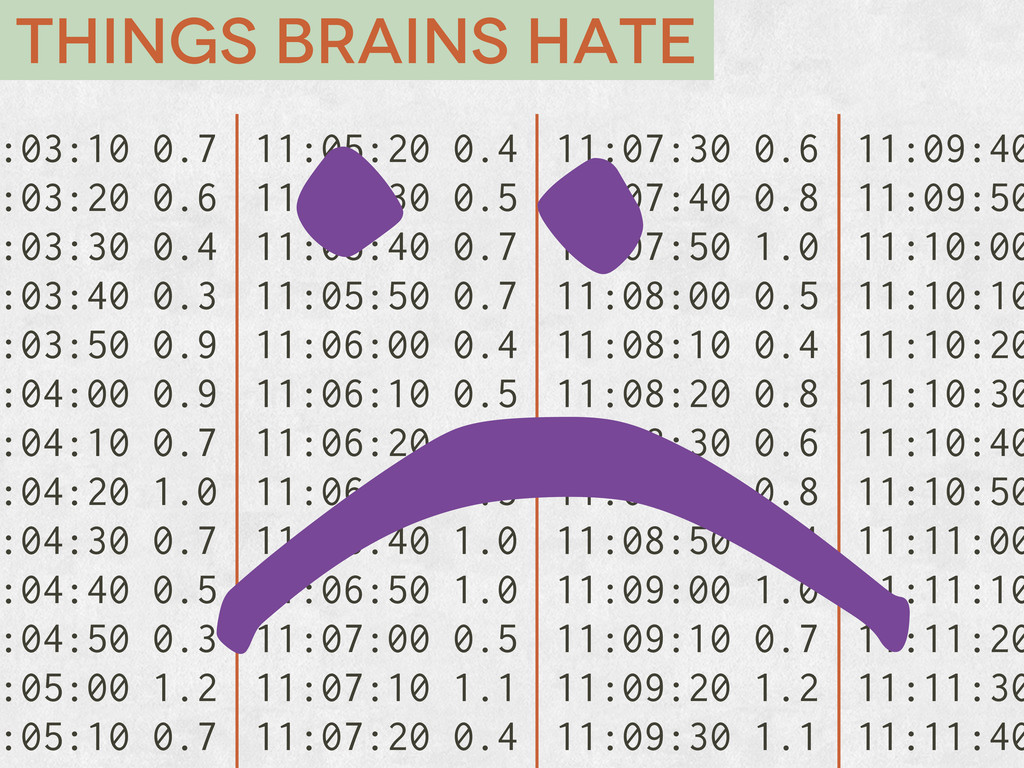
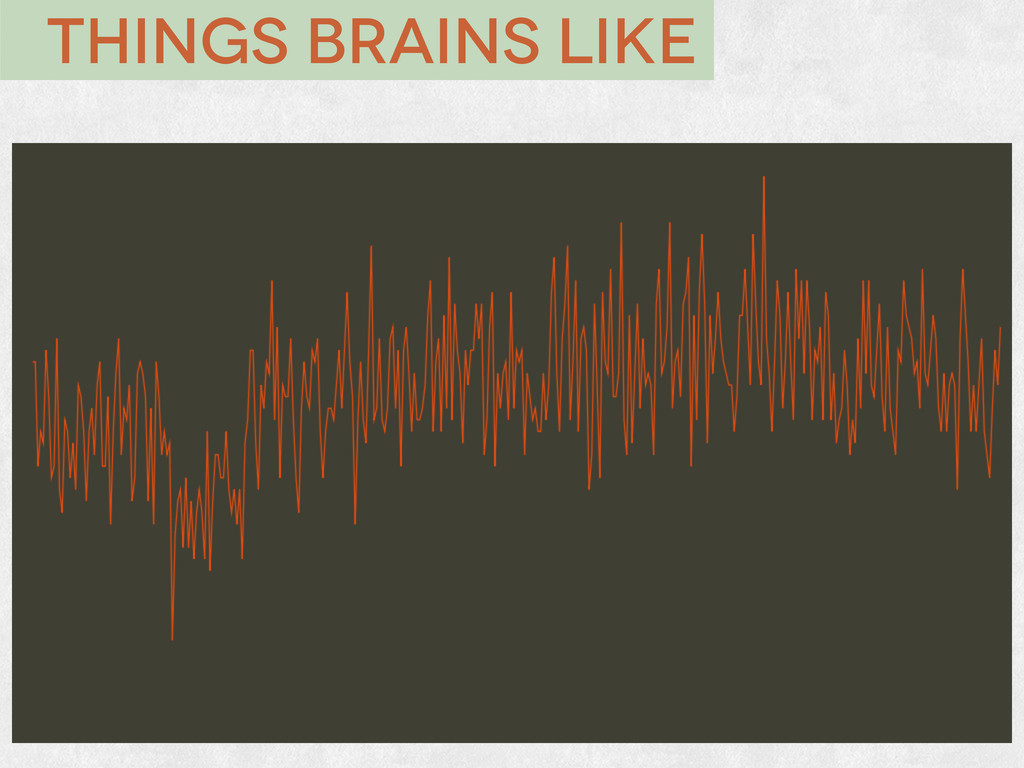
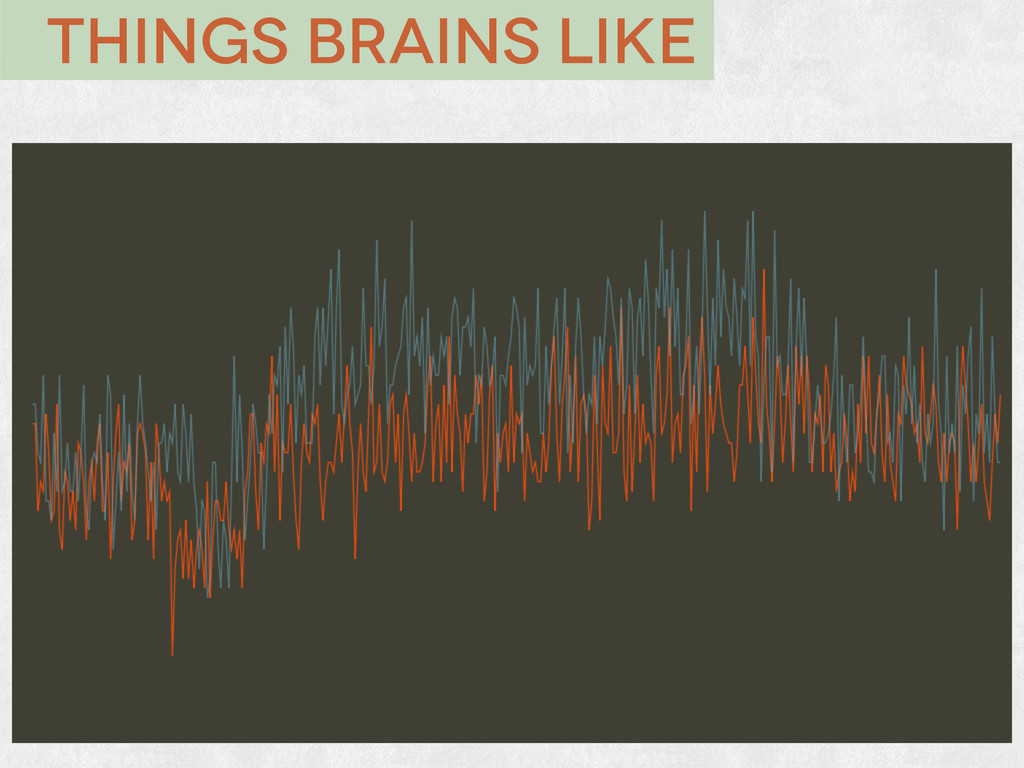
Humans are excellent at recognizing patterns. When we look at something familiar, we notice at a glance when something is unusual. The standard time-series graphs that we use to monitor our systems are immensely useful, but seeing that data in real time allows our pattern recognition to really shine.
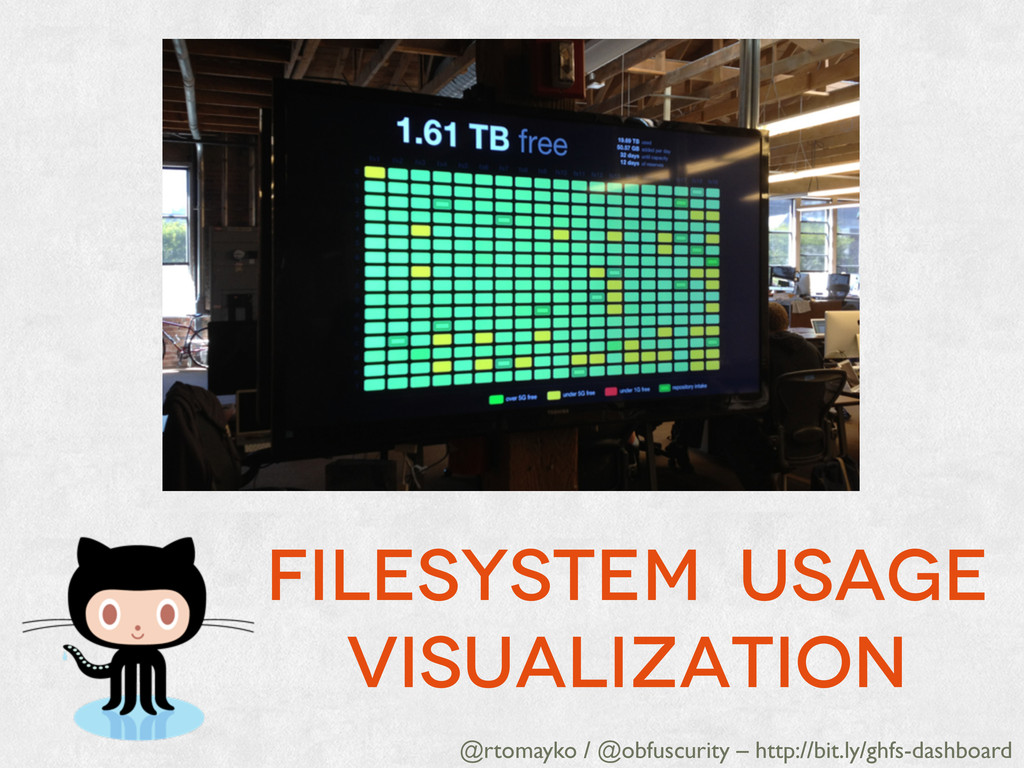
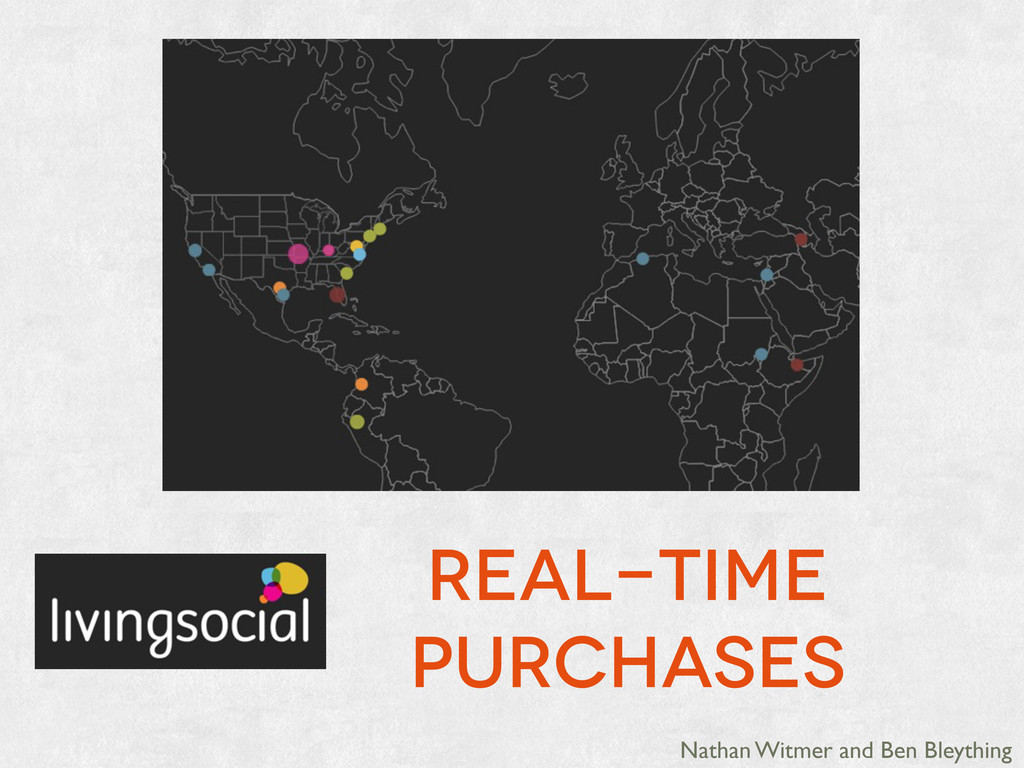
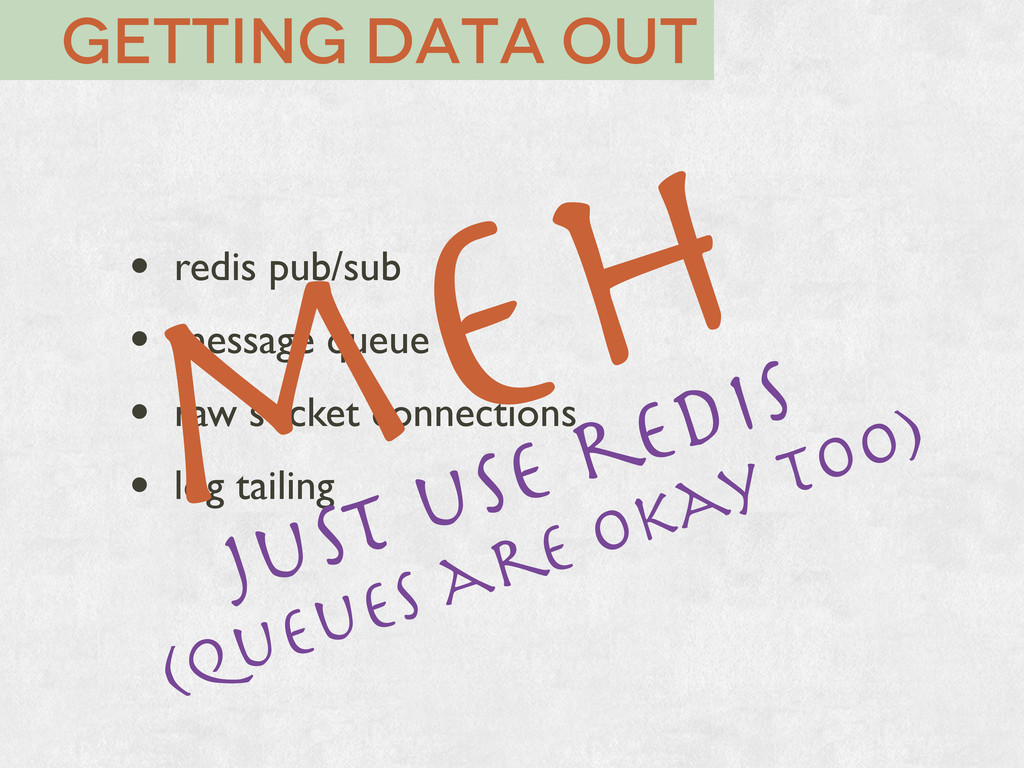
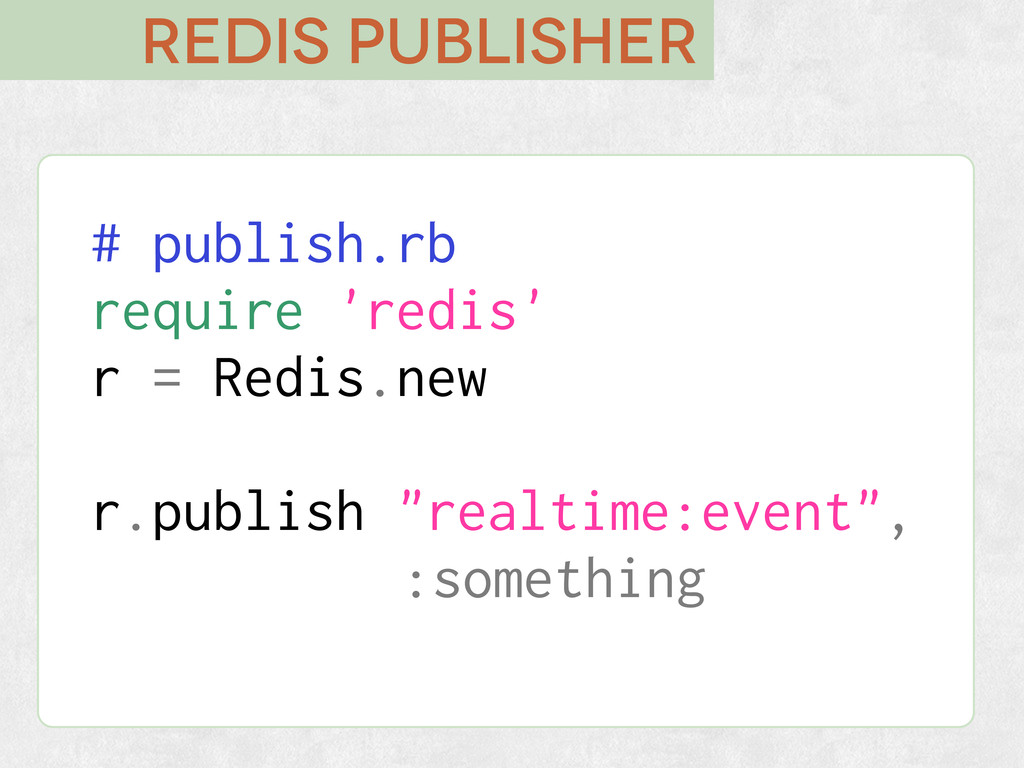
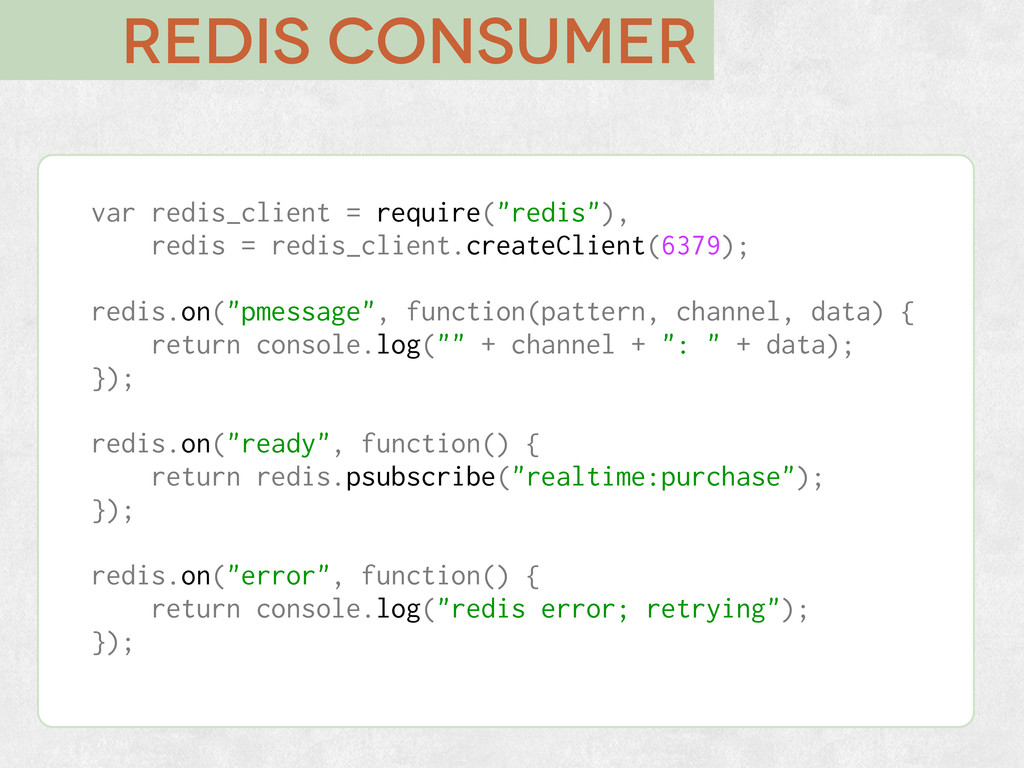
I’ll talk about ways to get realtime data out of your system and discuss some of the options for visualizing that data. I’ll share some of the visualizations we’ve built for LivingSocial. If you’ve ever thought “I really wish I could see what my visitors are doing”, this talk is for you.
![Roll Your Own real-time Visualizations @bleything • [email protected]](https://files.speakerdeck.com/presentations/4ff8a1841fce370009001bfd/slide_0.jpg)
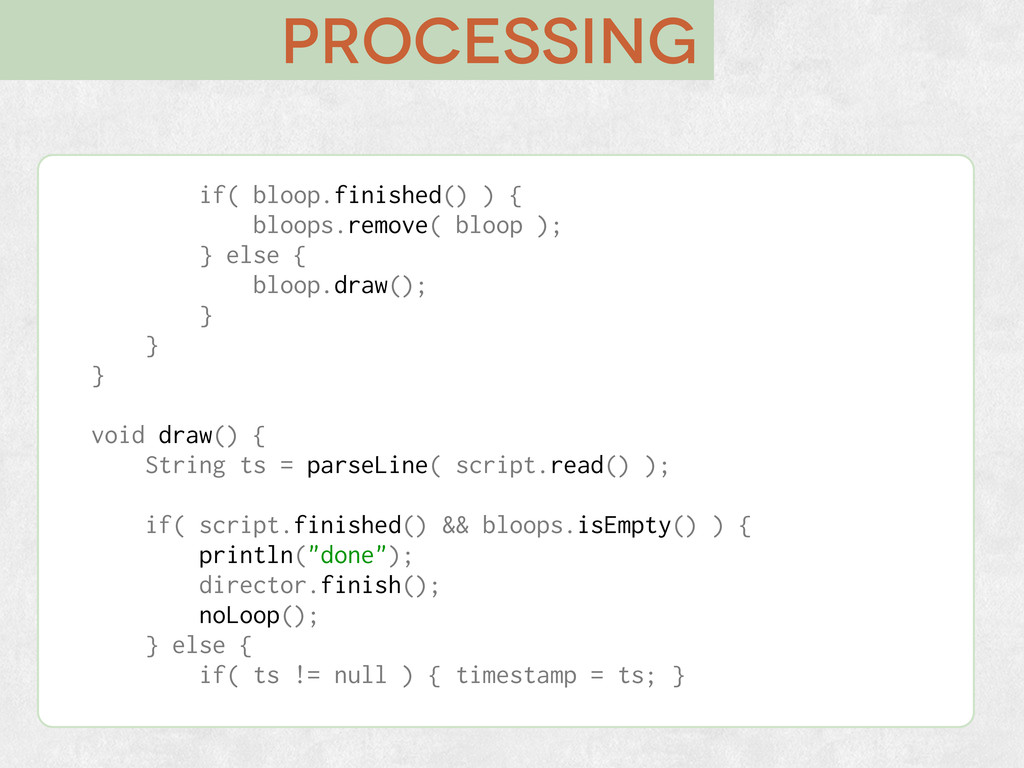
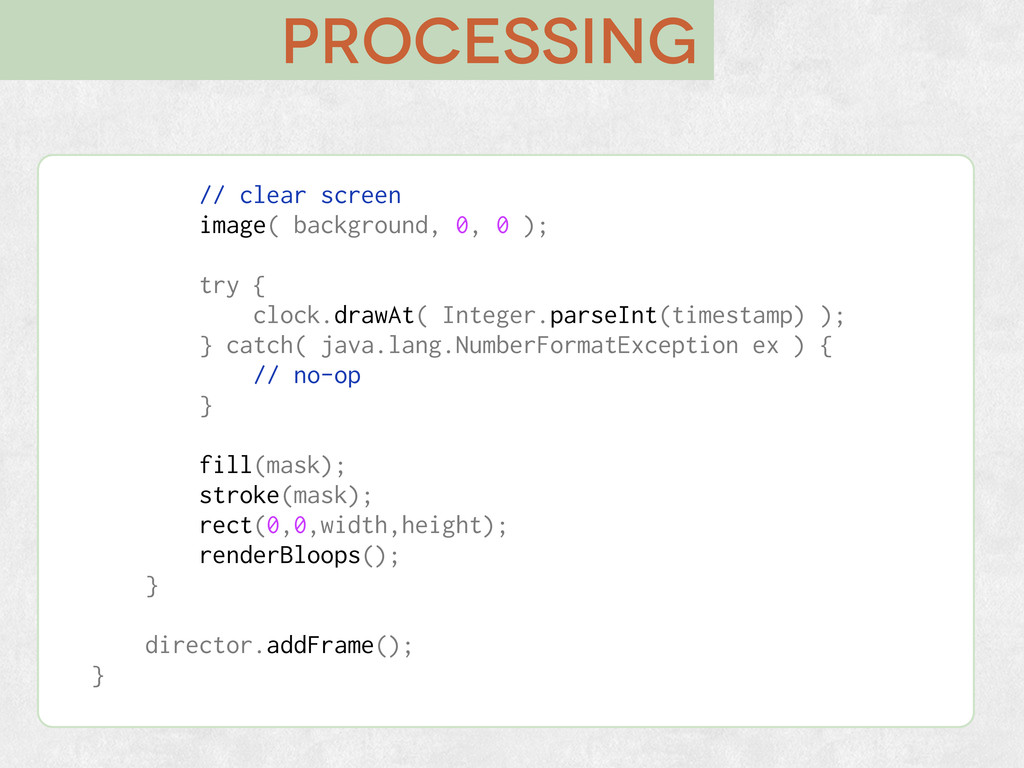
![processing // unixtime|lat1,long1@lat2,long2|lat1,long1@lat2,long2|... // 1327097733|42.17,[email protected],-178.68| 38.11,[email protected],-125.34 // String parseLine( String](https://files.speakerdeck.com/presentations/4ff8a1841fce370009001bfd/slide_29.jpg)
![processing // pairs is an array of lat,long@lat,long entries String[]](https://files.speakerdeck.com/presentations/4ff8a1841fce370009001bfd/slide_30.jpg)