Upgrade to Pro — share decks privately, control downloads, hide ads and more …

Wibble

Avatar for bobobob bobobob
May 21, 2012
55

 Wibble

Avatar for bobobob

bobobob

May 21, 2012
Tweet

Transcript

  1. Provided by digEcor, Inc. 2010 Passenger Survey Results An analysis

    of IFE, Content and Ancillary Revenue trends among passengers
  2. 4% were ages 18 - 25 42% were ages 26

    - 40 52% were ages 41 - 65 1% were ages 66+ 1% preferred not to answer
  3. 6% fly once per week 19% fly once per month

    29% fly once per 3 months 27% fly once per 6 months 19% fly once per year or less
  4. When you choose an airline from which to purchase your

    ticket, how influenced are you by: IFE System Type Movie & TV Show Selection Ticket Price Number of Stops Meal Service
  5. No Influence 1 (Low Influence) 2 3 4 5 (High

    Influence) Most Important Close 2nd Place Median Variance Median Variance *Variance shows how tightly grouped or consistent the answers are No. of Responses 3rd Place, High Variance IFE System Type Ticket Price No. of Stops Meal Service Movie & TV Show Selection
  6. So what does that information mean? Variety of preference for

    IFE equipment type Content selection is less important than IFE type Economy PAX are most interested in price No. of Stops is almost as important as ticket price Meal service is less important than IFE
  7. Other Working Other In-flight Magazine Watching Videos Watching Videos Reading

    Reading Sleeping Reading Watching Videos Music Reading Music Music Other 8+ Hours Flight Length 4 - 8 Hours Flight Length 2 - 4 Hours Flight Length 1 - 2 Hours Flight Length Working Playing Games Playing Games Playing Games Playing Games Other Working Watching Videos In-flight Magazine In-flight Magazine In-flight Magazine Sleeping Music Sleeping Sleeping Working *Higher activities have more time spent on them
  8. How do you prefer to receive entertainment? The following results

    showed a Low Variance or in other words, the answers were very consistent
  9. 5.18 Movies 4.17 Television Shows 3.89 Live Television 3.70 Current

    News 3.35 Music 3.30 Casual Games 2.91 Audio Books 2.86 Internet Videos 2.76 Student Films 2.65 Music Videos 2.01 Shopping 1.83 Casino Gaming How interested are you in each Entertainment category below? Most desired content type Fewer viewers, but higher revenue per seat *Ordered by Average Response (0 - 6)
  10. 4.01 Sitcoms / Comedies 3.46 Documentaries / Nature 3.42 Police

    / Crime Dramas 3.36 Educational / Science Entertainment 3.21 Travel 3.14 Stand-up Comedy 2.95 Medical Dramas 2.64 Do-it-Yourself 2.57 Entertainment News 2.45 Reality TV 2.25 Cartoons 2.16 Sports How interested are you in each Television category below? Most desired TV content *Ordered by Average Response (0 - 6)
  11. How interested are you in each Movie type below? Popular

    pre-DVD release Less popular pre-DVD release Popular DVD release (6-12 mos) Popular DVD release (1-5 yrs) Popular classics (more than 5 yrs)
  12. No Interest 1 (May Watch) 2 3 4 5 (Definitely

    Watch) Popular pre-DVD release Less popular pre- DVD release Popular DVD release (6-12 mos) Popular DVD release (1-5 yrs) Popular classics (more than 5 yrs) Average: 5.24 Variance: 1.16 Average: 4.40 Variance: 1.64 Average: 4.49 Variance: 1.60 Average: 3.84 Variance: 2.03 Average: 3.71 Variance: 2.36 No. of Responses
  13. So what does that information mean? Passengers are happiest watching

    popular, pre-DVD release movies. Though, they are just as happy, if not more so, to watch a popular movie that is available on DVD as a less popular movie that is not yet available on DVD.
  14. Have you ever purchased a product in-flight either through duty

    free or a shopping catalog available in the seatback pocket? 69% said “No” 26% said “Yes, 1 to 3 times” 5% said “Yes, 4+ times”
  15. If an electronic shopping catalog were available on a portable

    device, how likely would you be to browse the catalog? 30% said “No Interest” 49% said “Somewhat Likely” 21% said “Most Definitely”
  16. 2.65 Gifts 2.56 Movies, Music & Games 2.52 Electronics 2.44

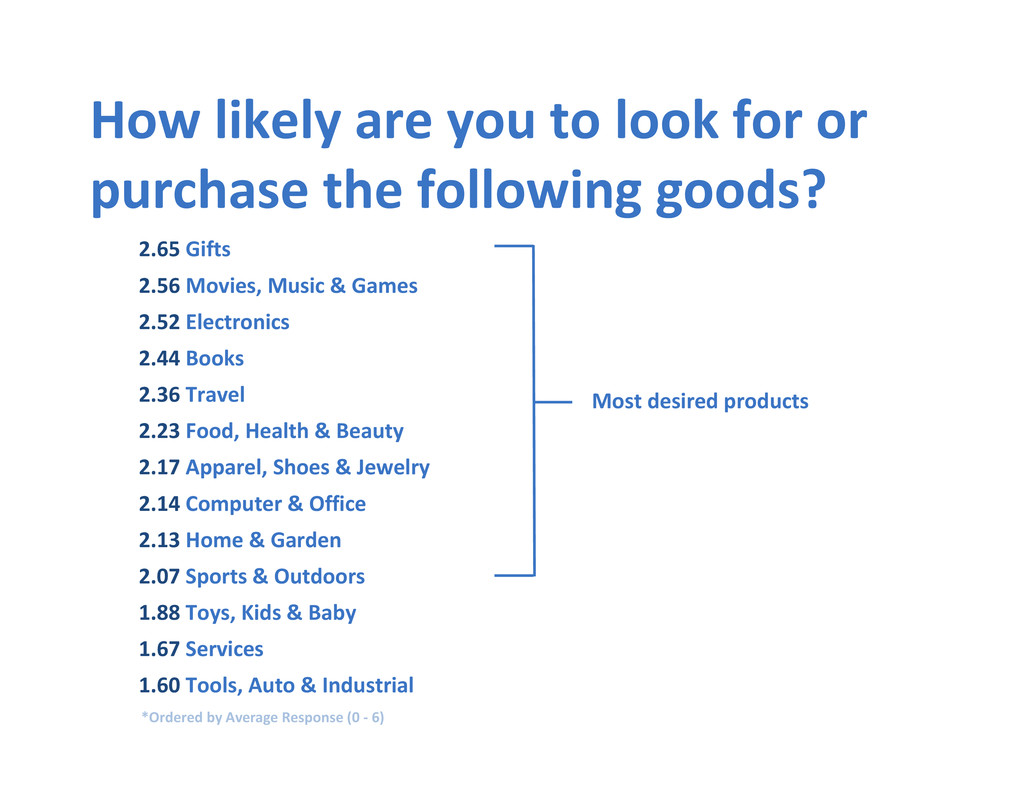
    Books 2.36 Travel 2.23 Food, Health & Beauty 2.17 Apparel, Shoes & Jewelry 2.14 Computer & Office 2.13 Home & Garden 2.07 Sports & Outdoors 1.88 Toys, Kids & Baby 1.67 Services 1.60 Tools, Auto & Industrial How likely are you to look for or purchase the following goods? Most desired products *Ordered by Average Response (0 - 6)
  17. Will you still rent a portable device knowing that there

    are limited advertisements offsetting the cost? 7% said “Probably or Definitely Will Not” 16% said “Don’t Know” 77% said “Probably or Definitely Will” *Responses showed very low variance