Upgrade to Pro — share decks privately, control downloads, hide ads and more …

An analysis of renewable energy systems of Kalt...

An analysis of renewable energy systems of Kaltungo LGA of Gombe State, Nigeria

This is part of my assignment at Hanze University of Applied Sciences, Groningen.

Avatar for Okeke Ifeanyi Johnbosco

Okeke Ifeanyi Johnbosco

March 14, 2026

More Decks by Okeke Ifeanyi Johnbosco

Other Decks in Research

Transcript

  1. • Kaltungo Local Government Area (LGA) is located in Gombe

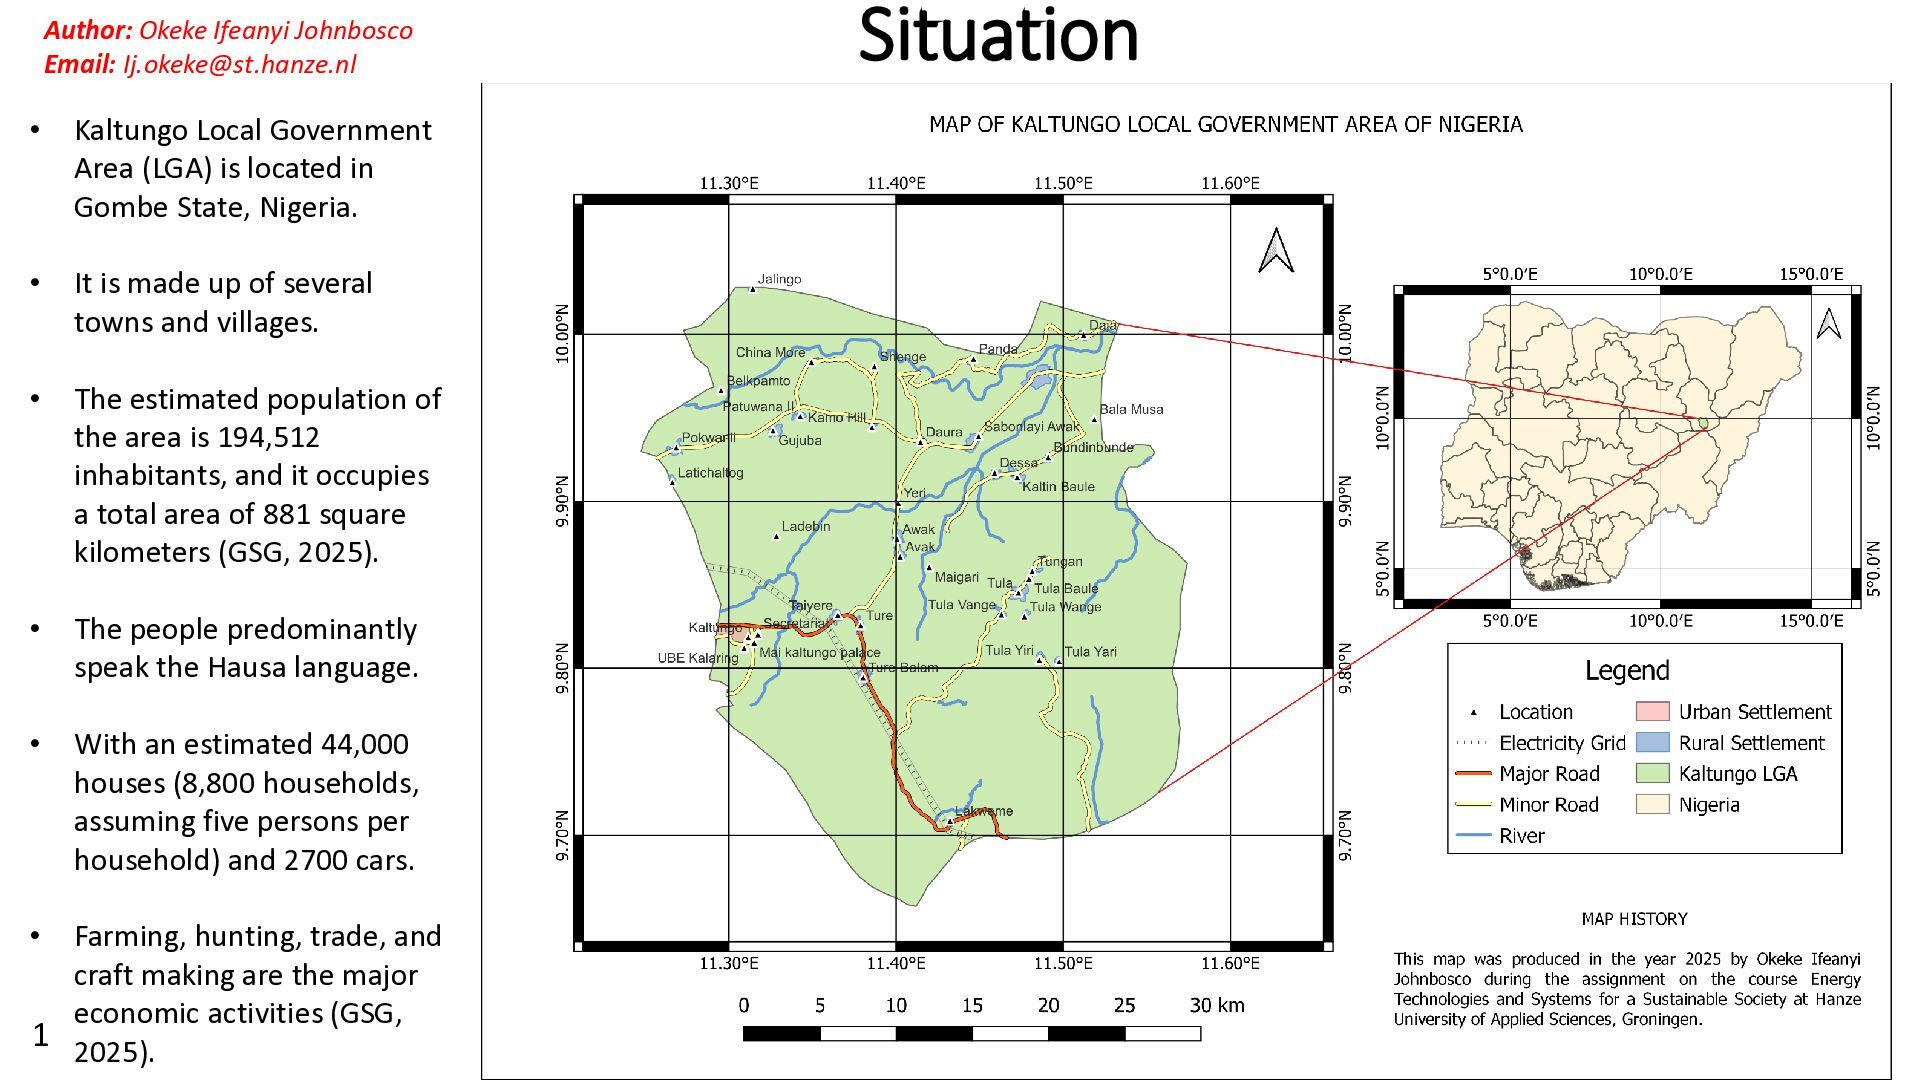
    State, Nigeria. • It is made up of several towns and villages. • The estimated population of the area is 194,512 inhabitants, and it occupies a total area of 881 square kilometers (GSG, 2025). • The people predominantly speak the Hausa language. • With an estimated 44,000 houses (8,800 households, assuming five persons per household) and 2700 cars. • Farming, hunting, trade, and craft making are the major economic activities (GSG, 2025). Author: Okeke Ifeanyi Johnbosco Email: [email protected] Situation 1
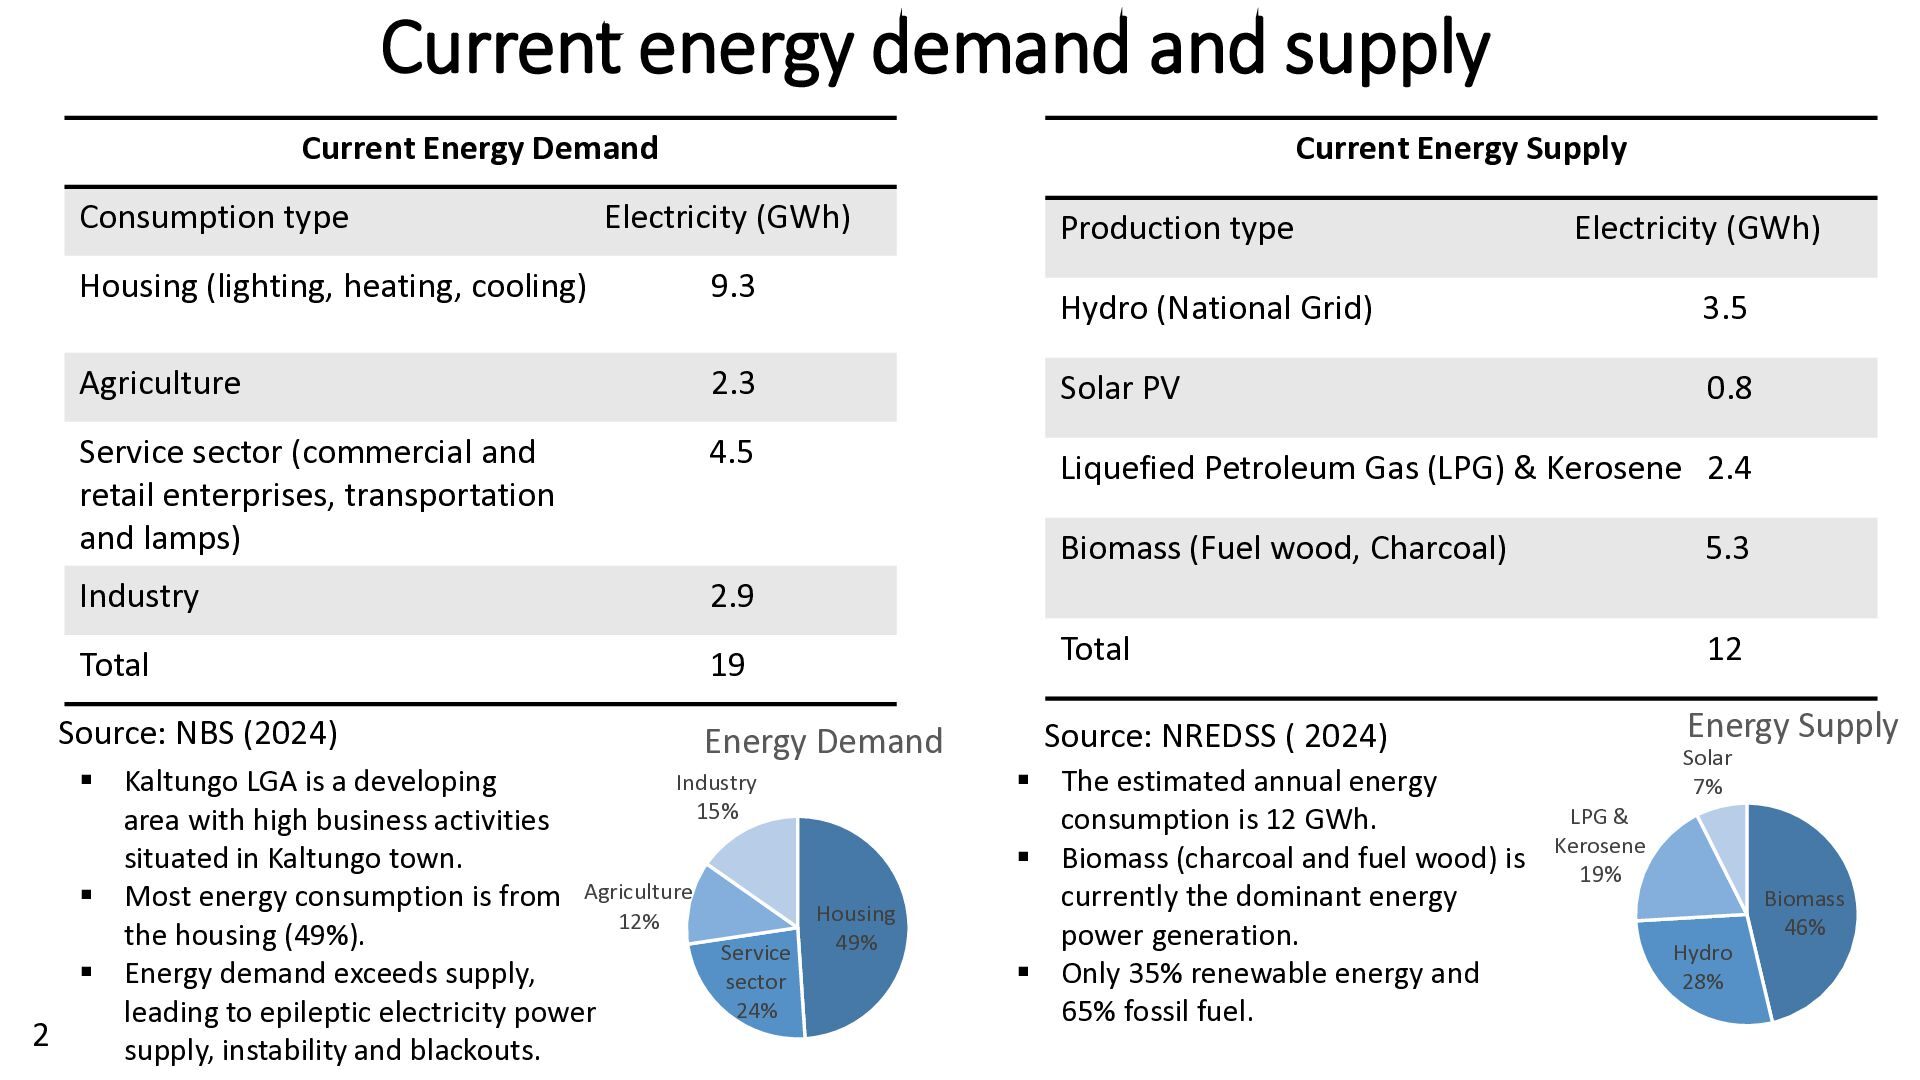
  2. Current energy demand and supply Current Energy Demand Consumption type

    Electricity (GWh) Housing (lighting, heating, cooling) 9.3 Agriculture 2.3 Service sector (commercial and 4.5 retail enterprises, transportation and lamps) Industry 2.9 Total 19 Current Energy Supply Production type Electricity (GWh) Hydro (National Grid) 3.5 Solar PV 0.8 Liquefied Petroleum Gas (LPG) & Kerosene 2.4 Biomass (Fuel wood, Charcoal) 5.3 Total 12 Source: NBS (2024) Source: NREDSS ( 2024) Housing 49% Service sector 24% Agriculture 12% Industry 15% Energy Demand Biomass 46% Hydro 28% LPG & Kerosene 19% Solar 7% Energy Supply 2  Kaltungo LGA is a developing area with high business activities situated in Kaltungo town.  Most energy consumption is from the housing (49%).  Energy demand exceeds supply, leading to epileptic electricity power supply, instability and blackouts.  The estimated annual energy consumption is 12 GWh.  Biomass (charcoal and fuel wood) is currently the dominant energy power generation.  Only 35% renewable energy and 65% fossil fuel.
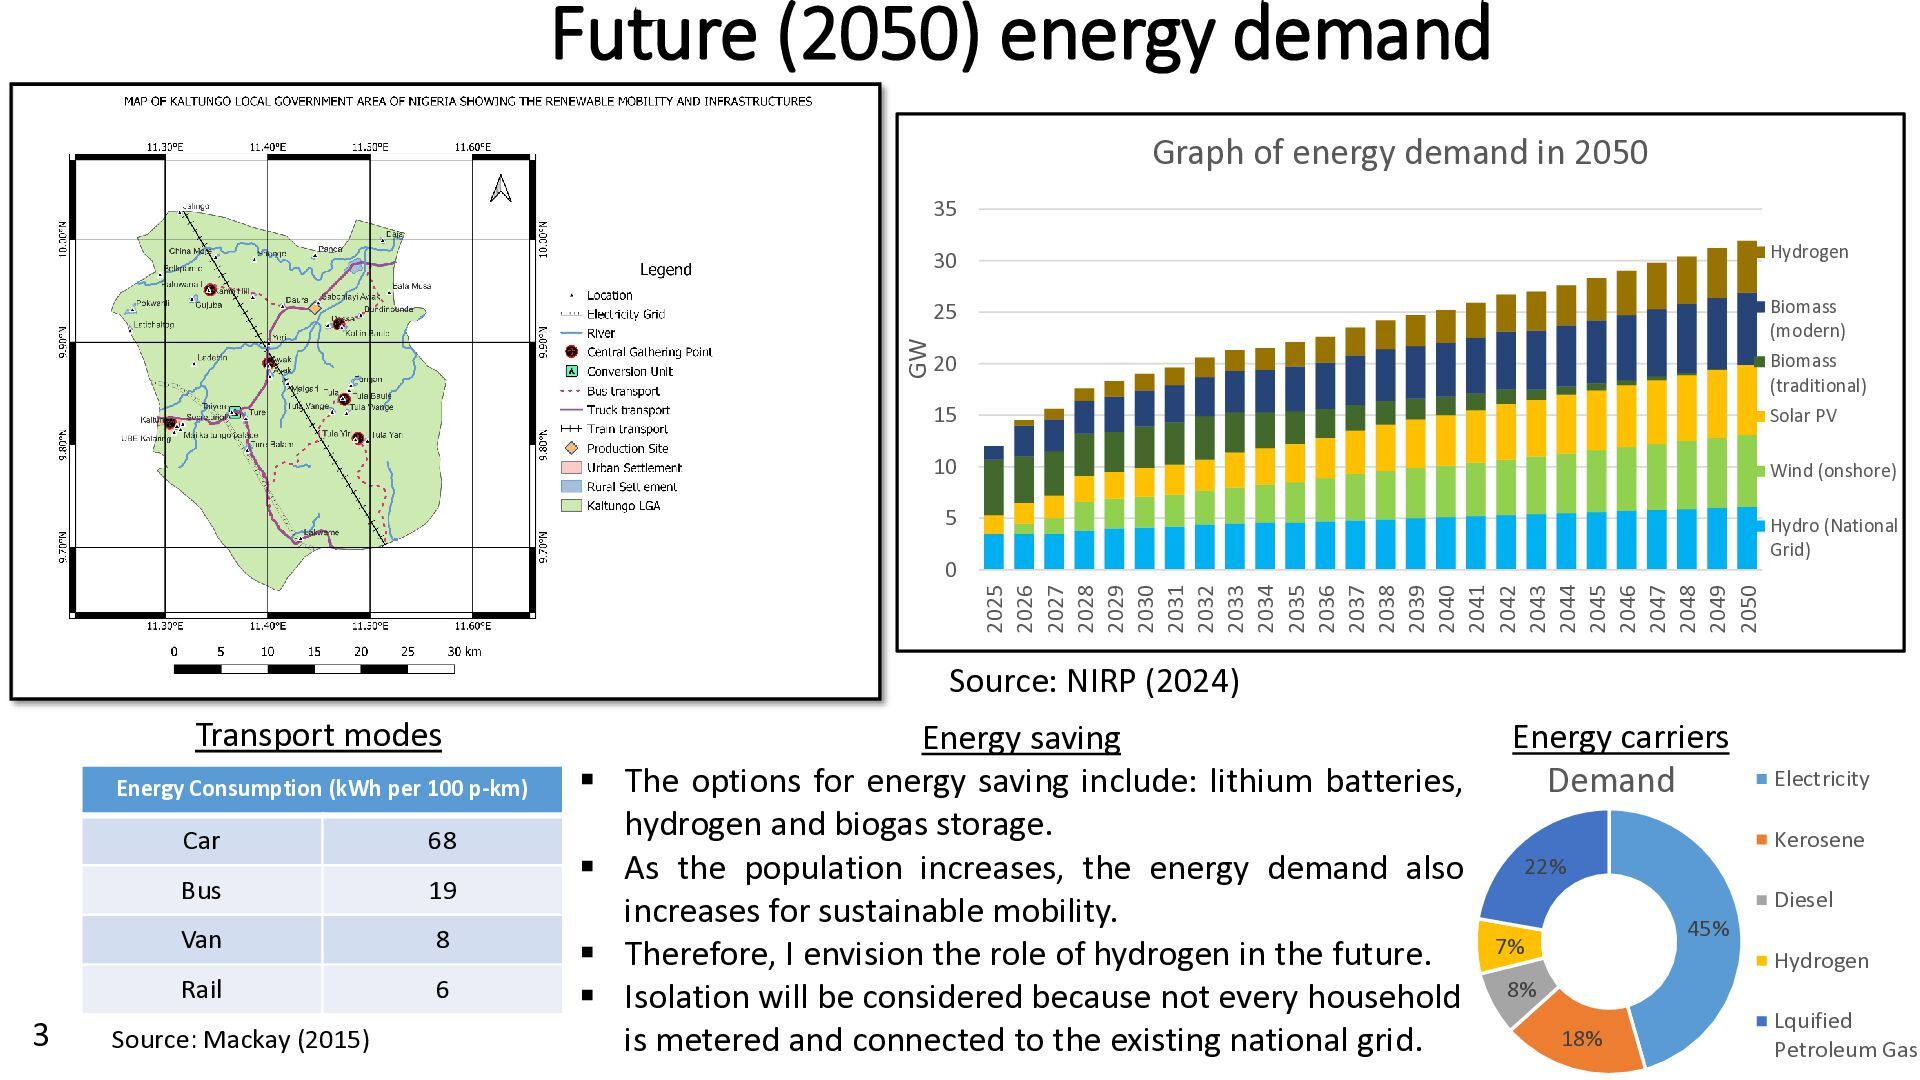
  3. Future (2050) energy demand 3 Energy saving  The options

    for energy saving include: lithium batteries, hydrogen and biogas storage.  As the population increases, the energy demand also increases for sustainable mobility.  Therefore, I envision the role of hydrogen in the future.  Isolation will be considered because not every household is metered and connected to the existing national grid. Energy carriers 45% 18% 8% 7% 22% Demand Electricity Kerosene Diesel Hydrogen Lquified Petroleum Gas Transport modes Energy Consumption (kWh per 100 p-km) Car 68 Bus 19 Van 8 Rail 6 Source: Mackay (2015) 0 5 10 15 20 25 30 35 2025 2026 2027 2028 2029 2030 2031 2032 2033 2034 2035 2036 2037 2038 2039 2040 2041 2042 2043 2044 2045 2046 2047 2048 2049 2050 GW Graph of energy demand in 2050 Hydrogen Biomass (modern) Biomass (traditional) Solar PV Wind (onshore) Hydro (National Grid) Source: NIRP (2024)
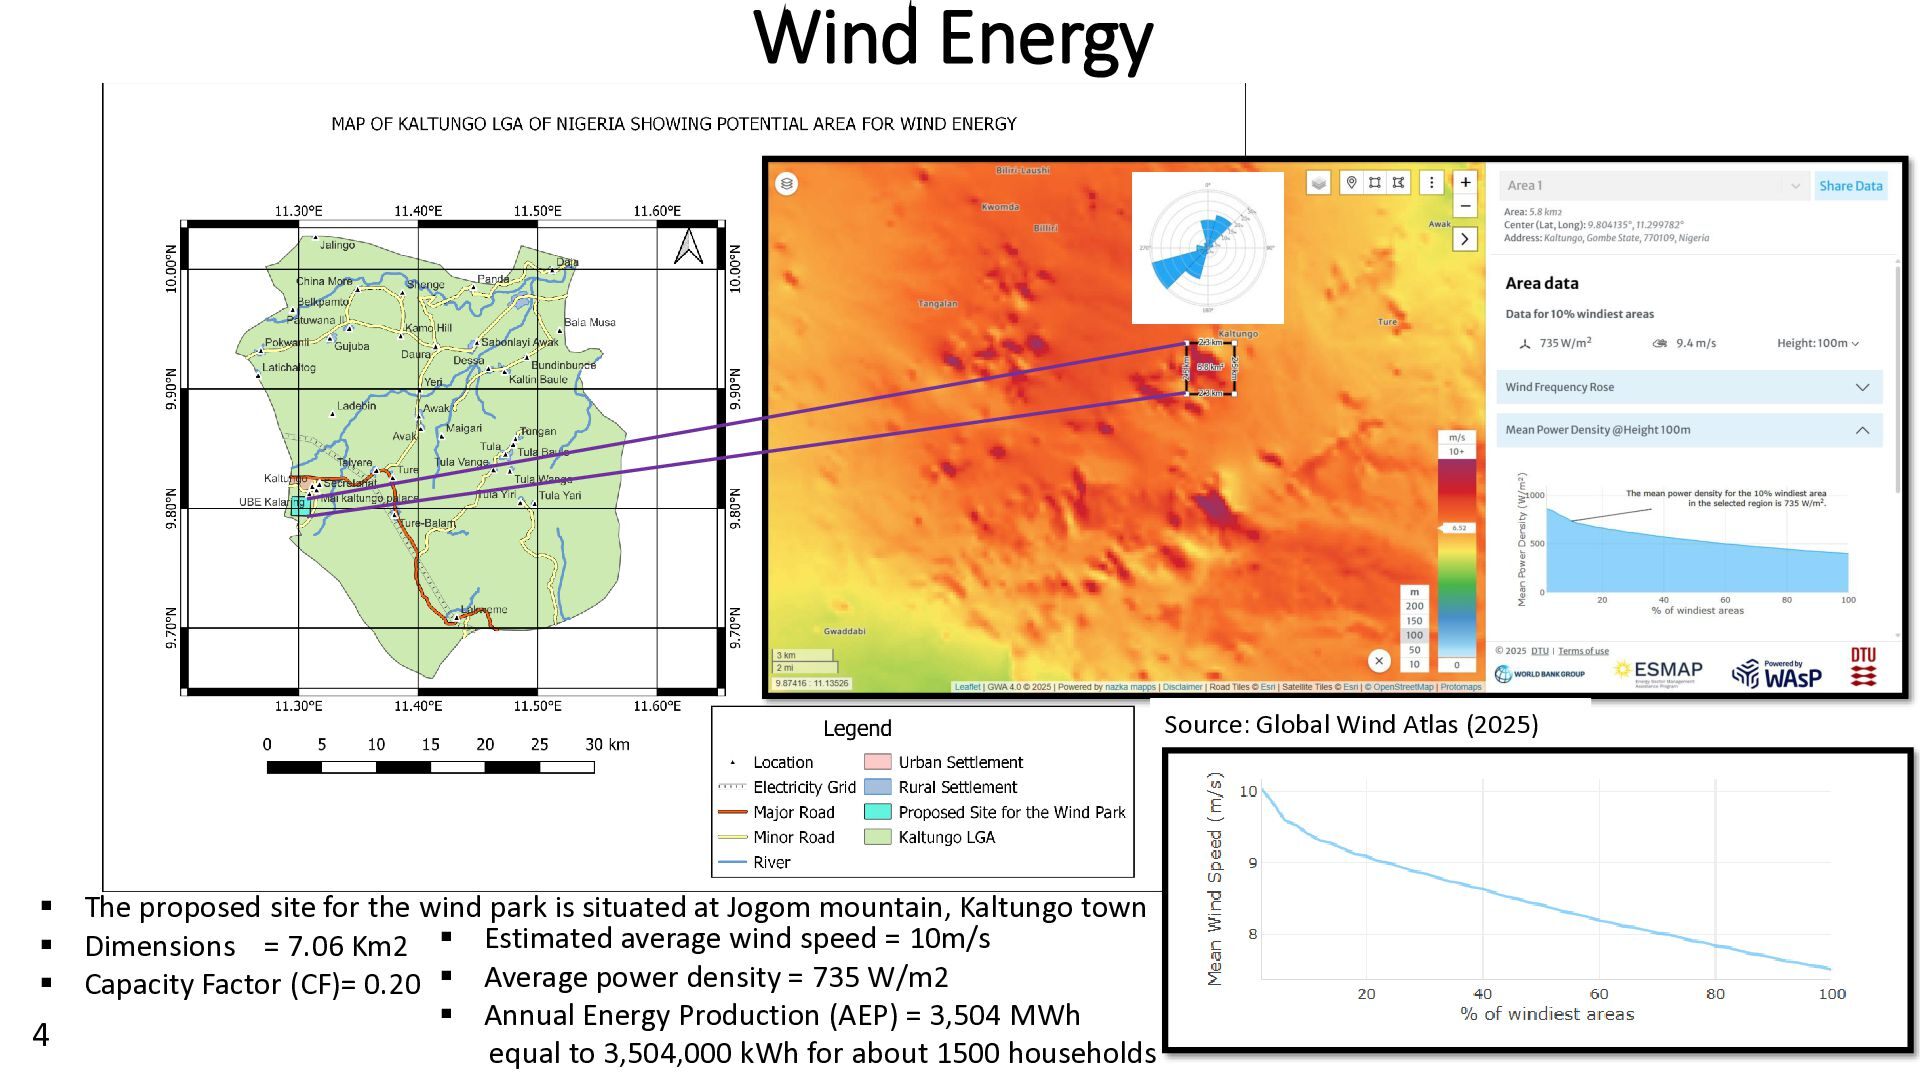
  4. Wind Energy 4  The proposed site for the wind

    park is situated at Jogom mountain, Kaltungo town  Dimensions = 7.06 Km2  Capacity Factor (CF)= 0.20 Source: Global Wind Atlas (2025)  Estimated average wind speed = 10m/s  Average power density = 735 W/m2  Annual Energy Production (AEP) = 3,504 MWh equal to 3,504,000 kWh for about 1500 households
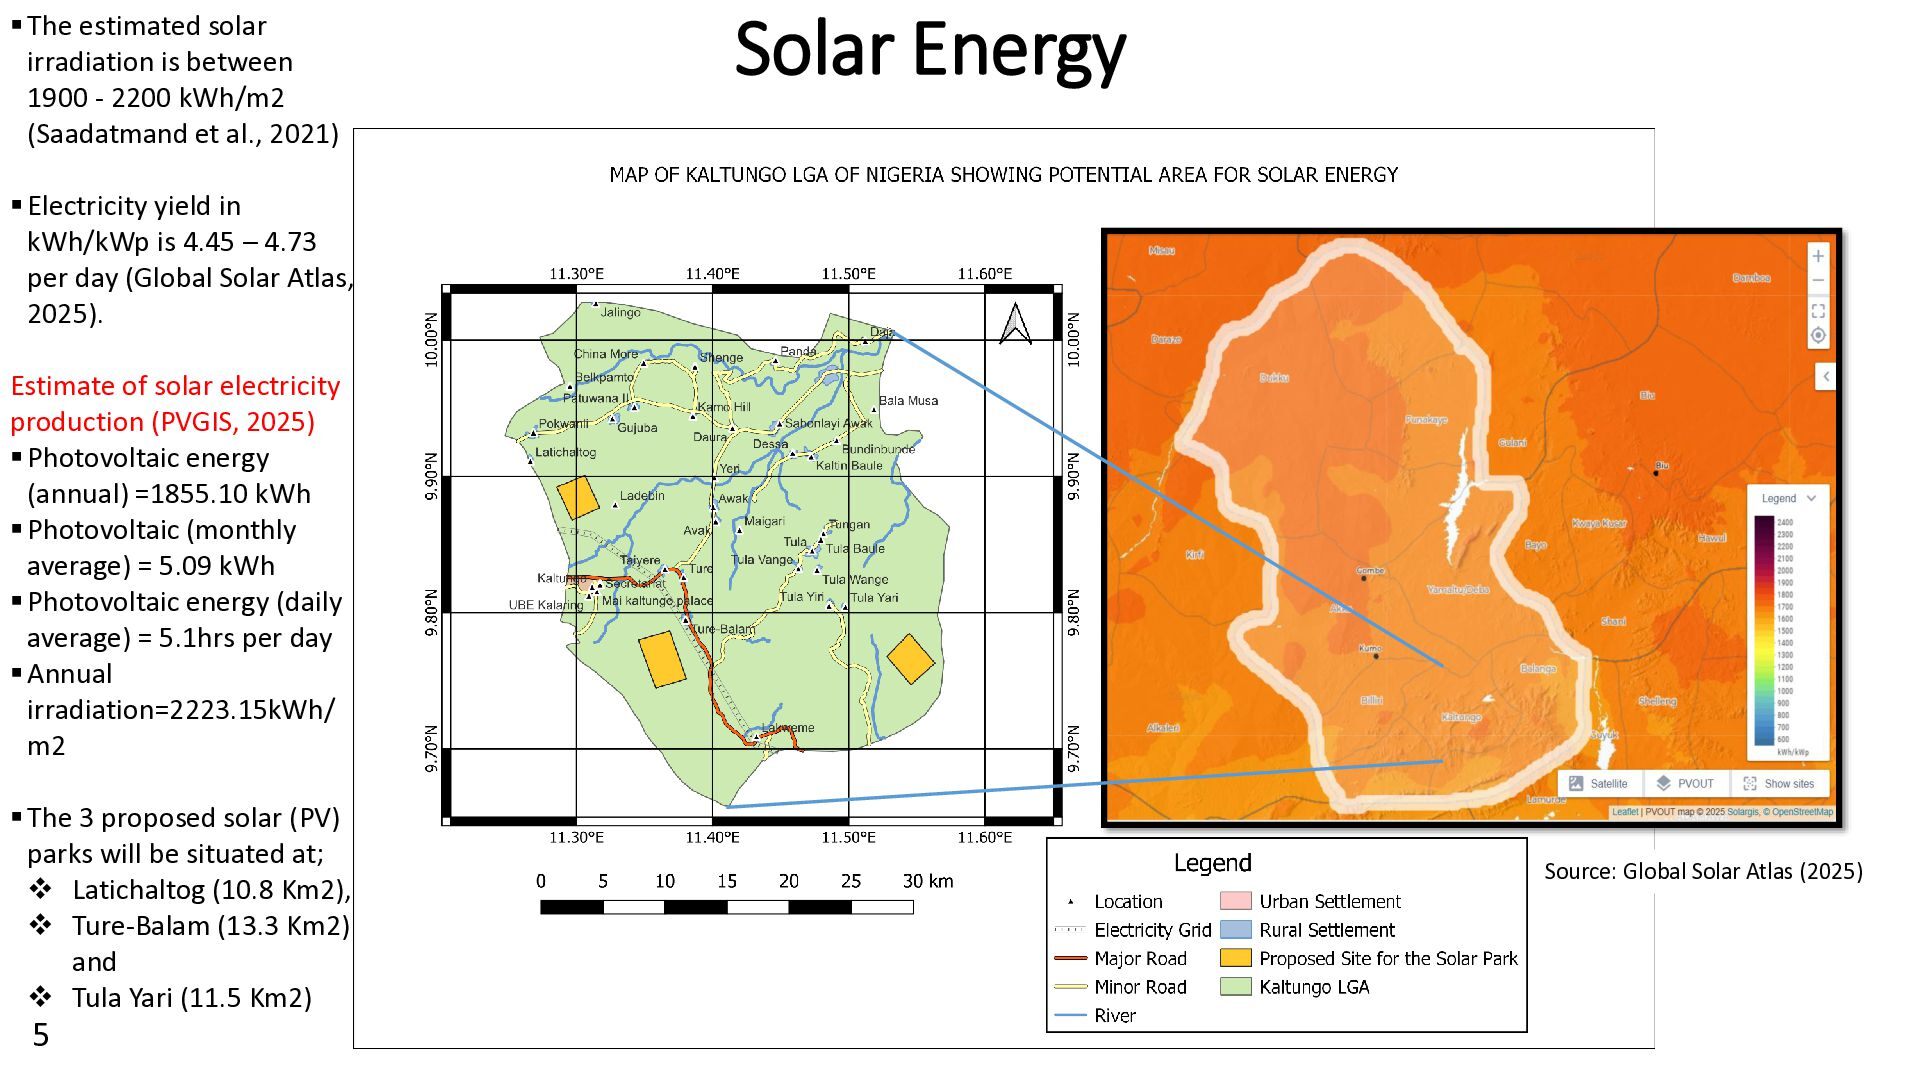
  5. Solar Energy 5 The estimated solar irradiation is between 1900

    - 2200 kWh/m2 (Saadatmand et al., 2021) Electricity yield in kWh/kWp is 4.45 – 4.73 per day (Global Solar Atlas, 2025). Estimate of solar electricity production (PVGIS, 2025) Photovoltaic energy (annual) =1855.10 kWh Photovoltaic (monthly average) = 5.09 kWh Photovoltaic energy (daily average) = 5.1hrs per day Annual irradiation=2223.15kWh/ m2 The 3 proposed solar (PV) parks will be situated at;  Latichaltog (10.8 Km2),  Ture-Balam (13.3 Km2) and  Tula Yari (11.5 Km2) Source: Global Solar Atlas (2025)
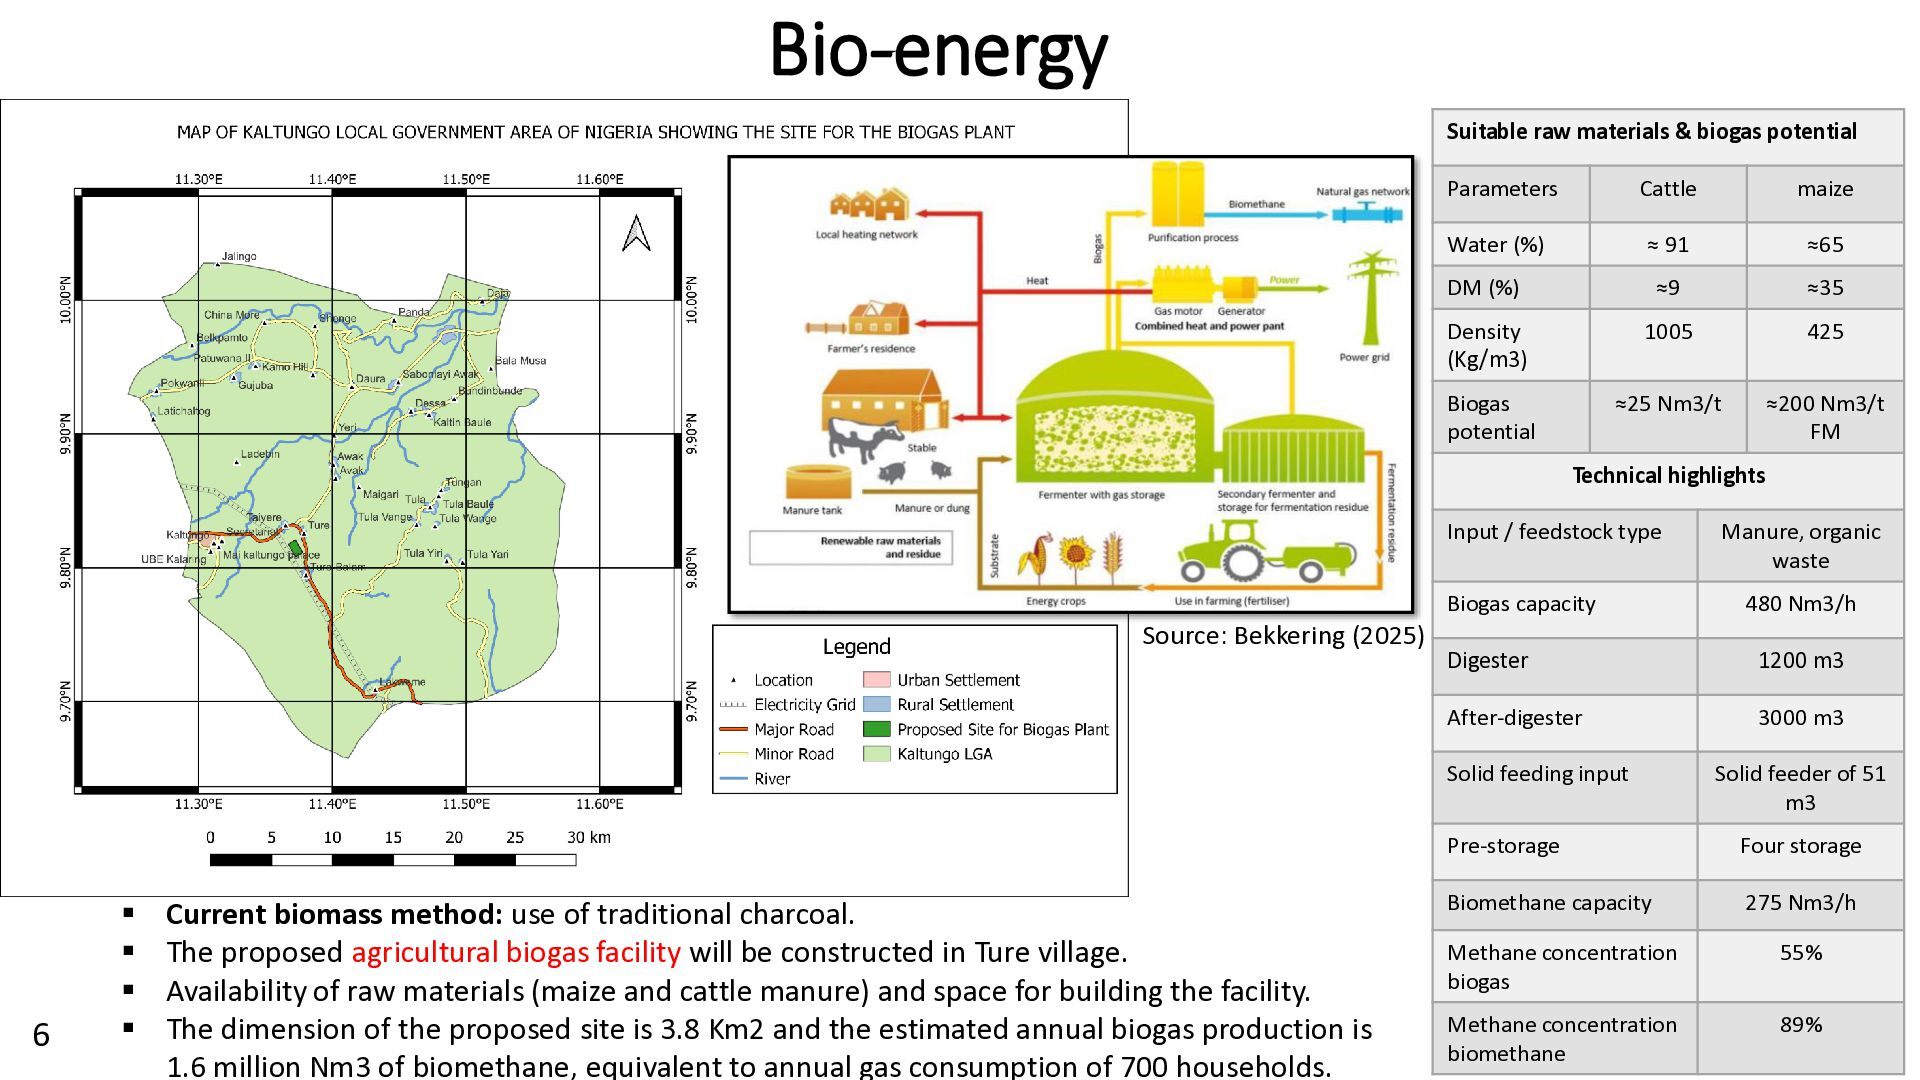
  6. Bio-energy 6 Suitable raw materials & biogas potential Parameters Cattle

    maize Water (%) ≈ 91 ≈65 DM (%) ≈9 ≈35 Density (Kg/m3) 1005 425 Biogas potential ≈25 Nm3/t ≈200 Nm3/t FM Technical highlights Input / feedstock type Manure, organic waste Biogas capacity 480 Nm3/h Digester 1200 m3 After-digester 3000 m3 Solid feeding input Solid feeder of 51 m3 Pre-storage Four storage Biomethane capacity 275 Nm3/h Methane concentration biogas 55% Methane concentration biomethane 89%  Current biomass method: use of traditional charcoal.  The proposed agricultural biogas facility will be constructed in Ture village.  Availability of raw materials (maize and cattle manure) and space for building the facility.  The dimension of the proposed site is 3.8 Km2 and the estimated annual biogas production is 1.6 million Nm3 of biomethane, equivalent to annual gas consumption of 700 households. Source: Bekkering (2025)
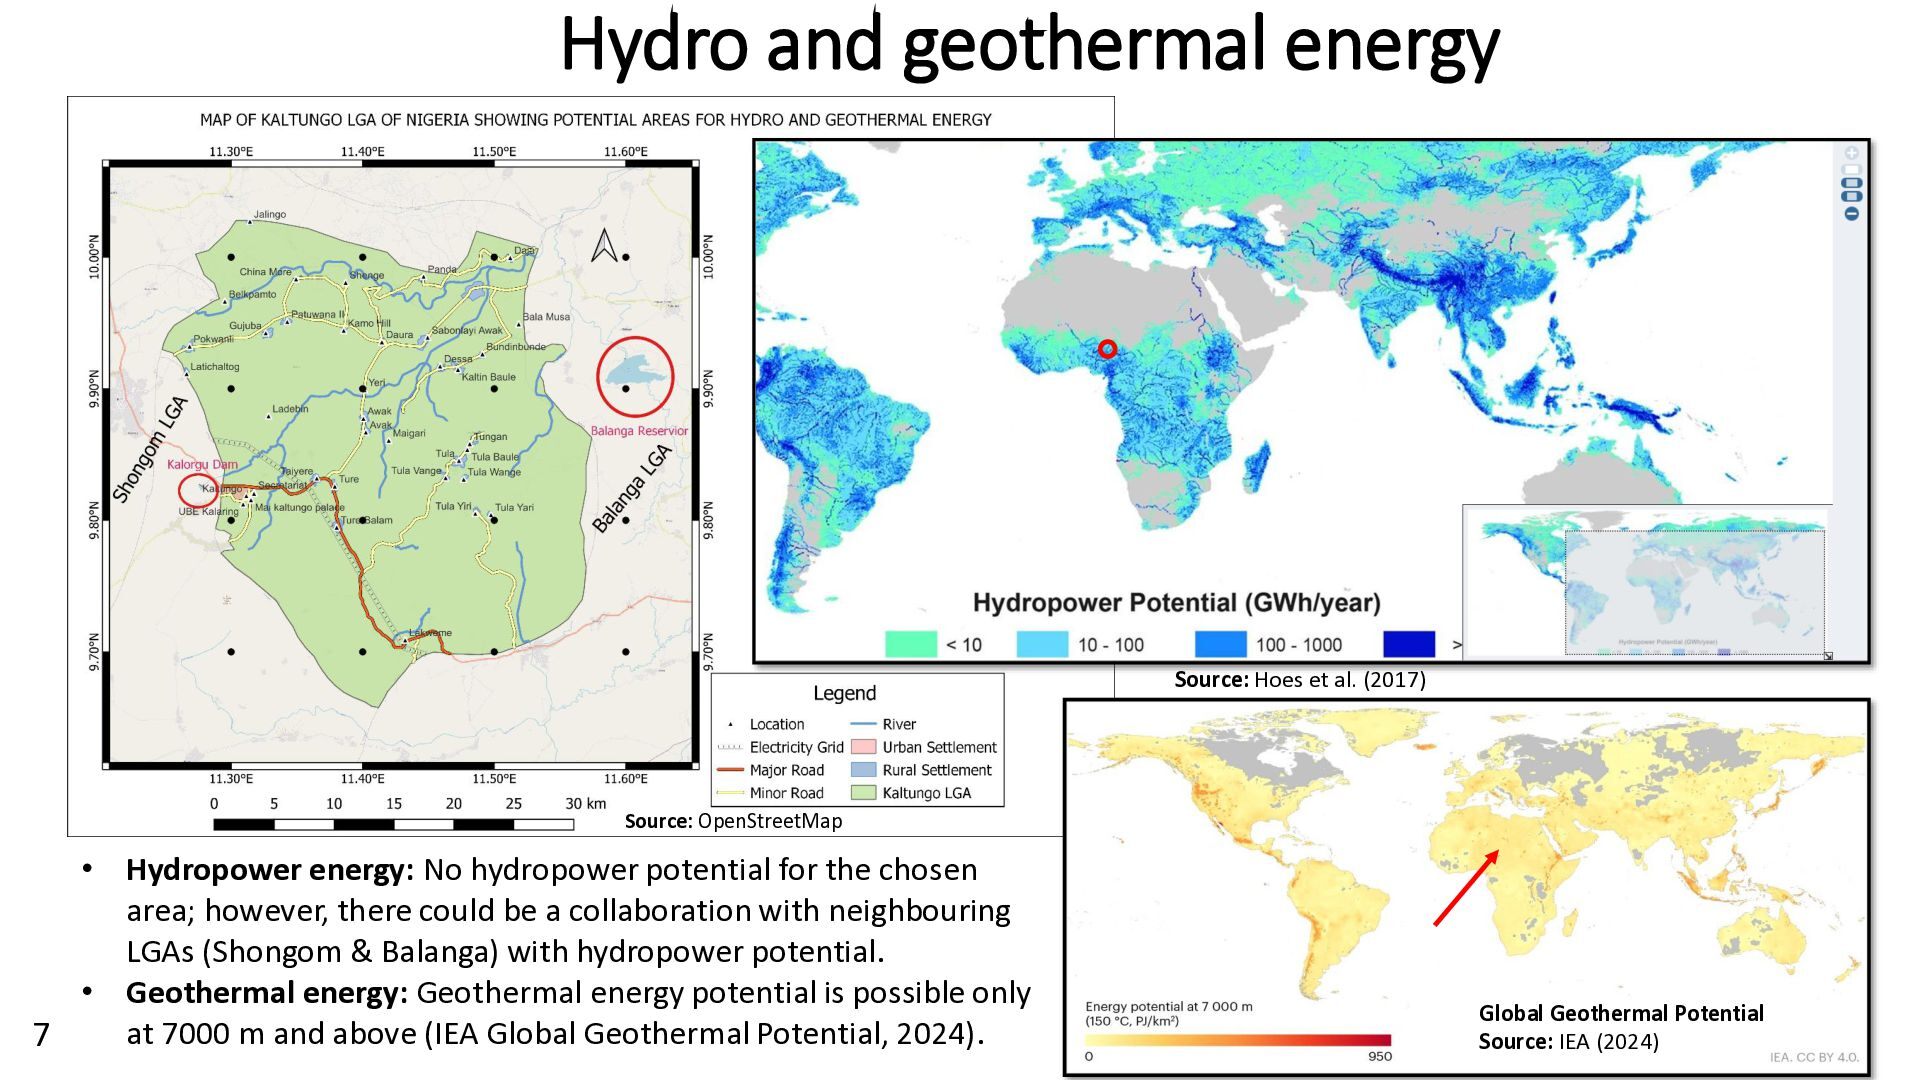
  7. Hydro and geothermal energy 7 • Hydropower energy: No hydropower

    potential for the chosen area; however, there could be a collaboration with neighbouring LGAs (Shongom & Balanga) with hydropower potential. • Geothermal energy: Geothermal energy potential is possible only at 7000 m and above (IEA Global Geothermal Potential, 2024). Source: OpenStreetMap Source: Hoes et al. (2017) Global Geothermal Potential Source: IEA (2024)
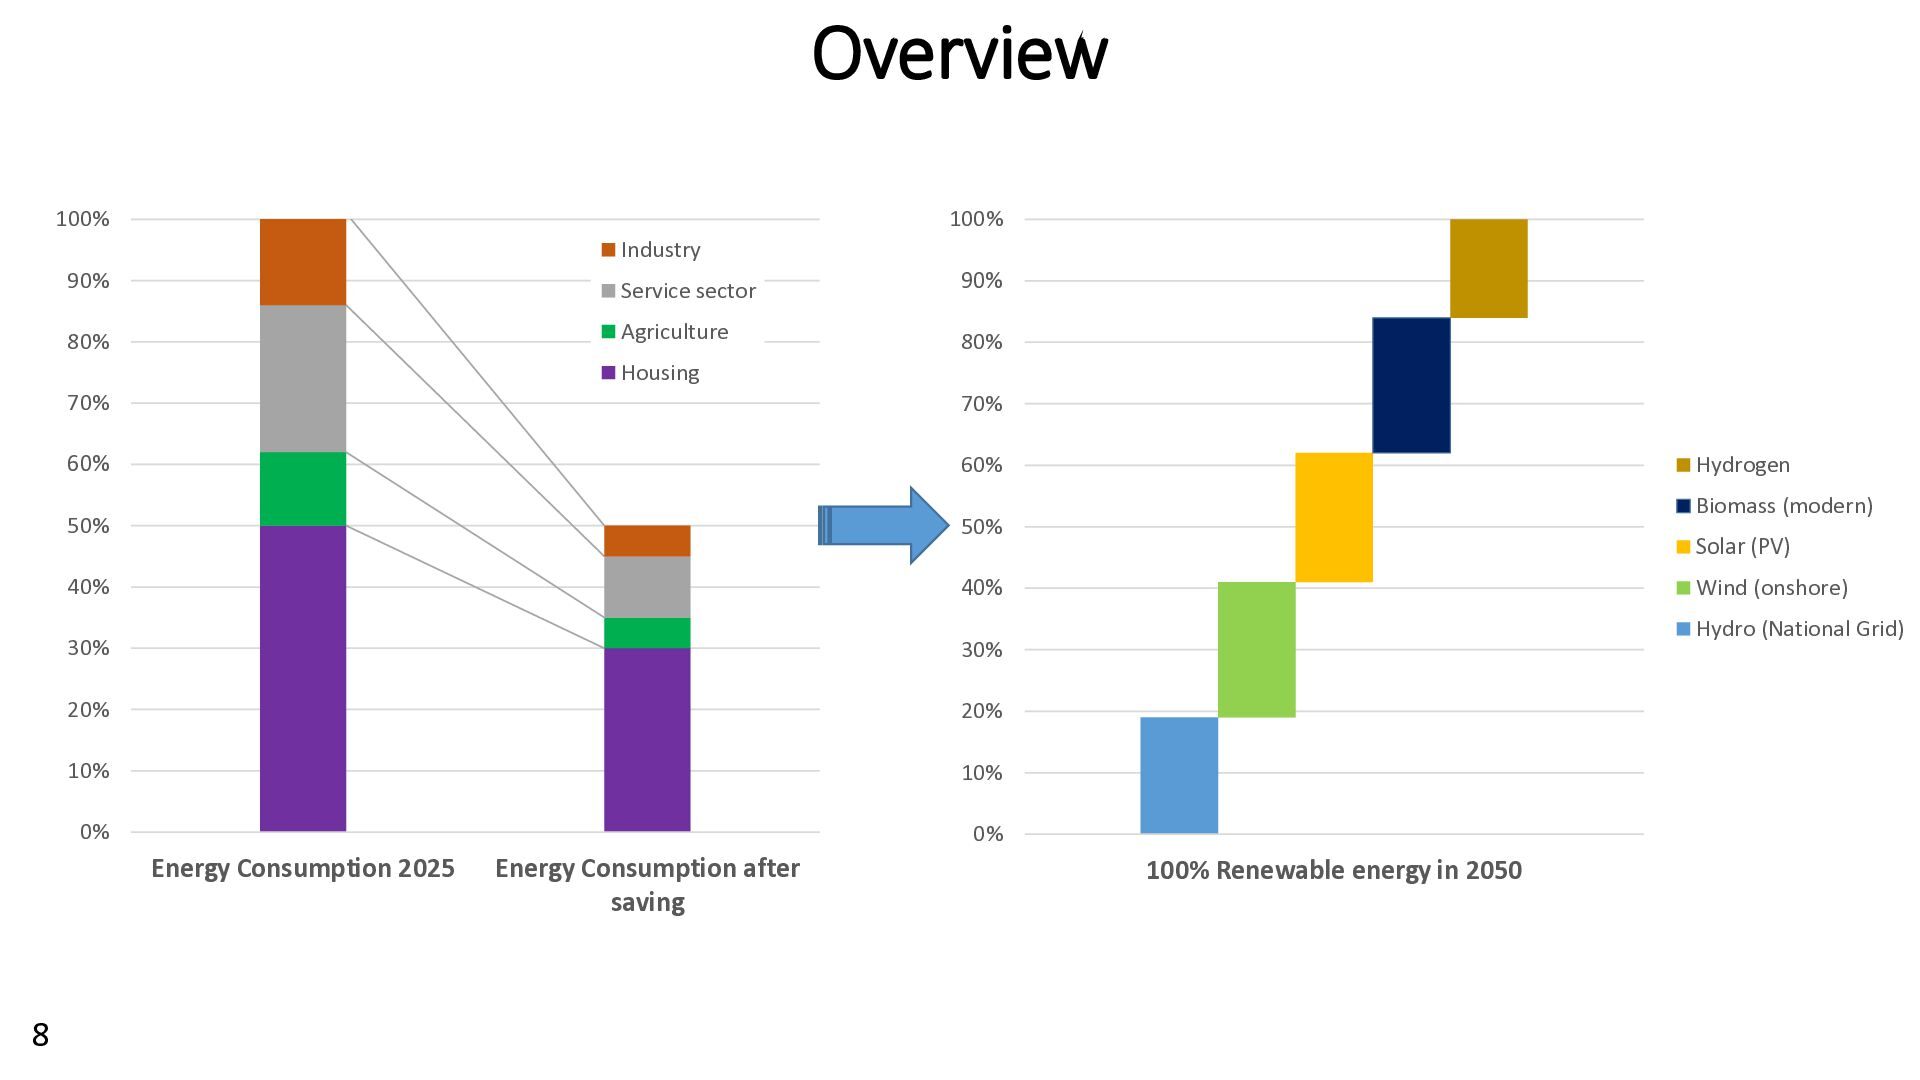
  8. Overview 8 0% 10% 20% 30% 40% 50% 60% 70%

    80% 90% 100% Energy Consumption 2025 Energy Consumption after saving Industry Service sector Agriculture Housing 0% 10% 20% 30% 40% 50% 60% 70% 80% 90% 100% 100% Renewable energy in 2050 Hydrogen Biomass (modern) Solar (PV) Wind (onshore) Hydro (National Grid)
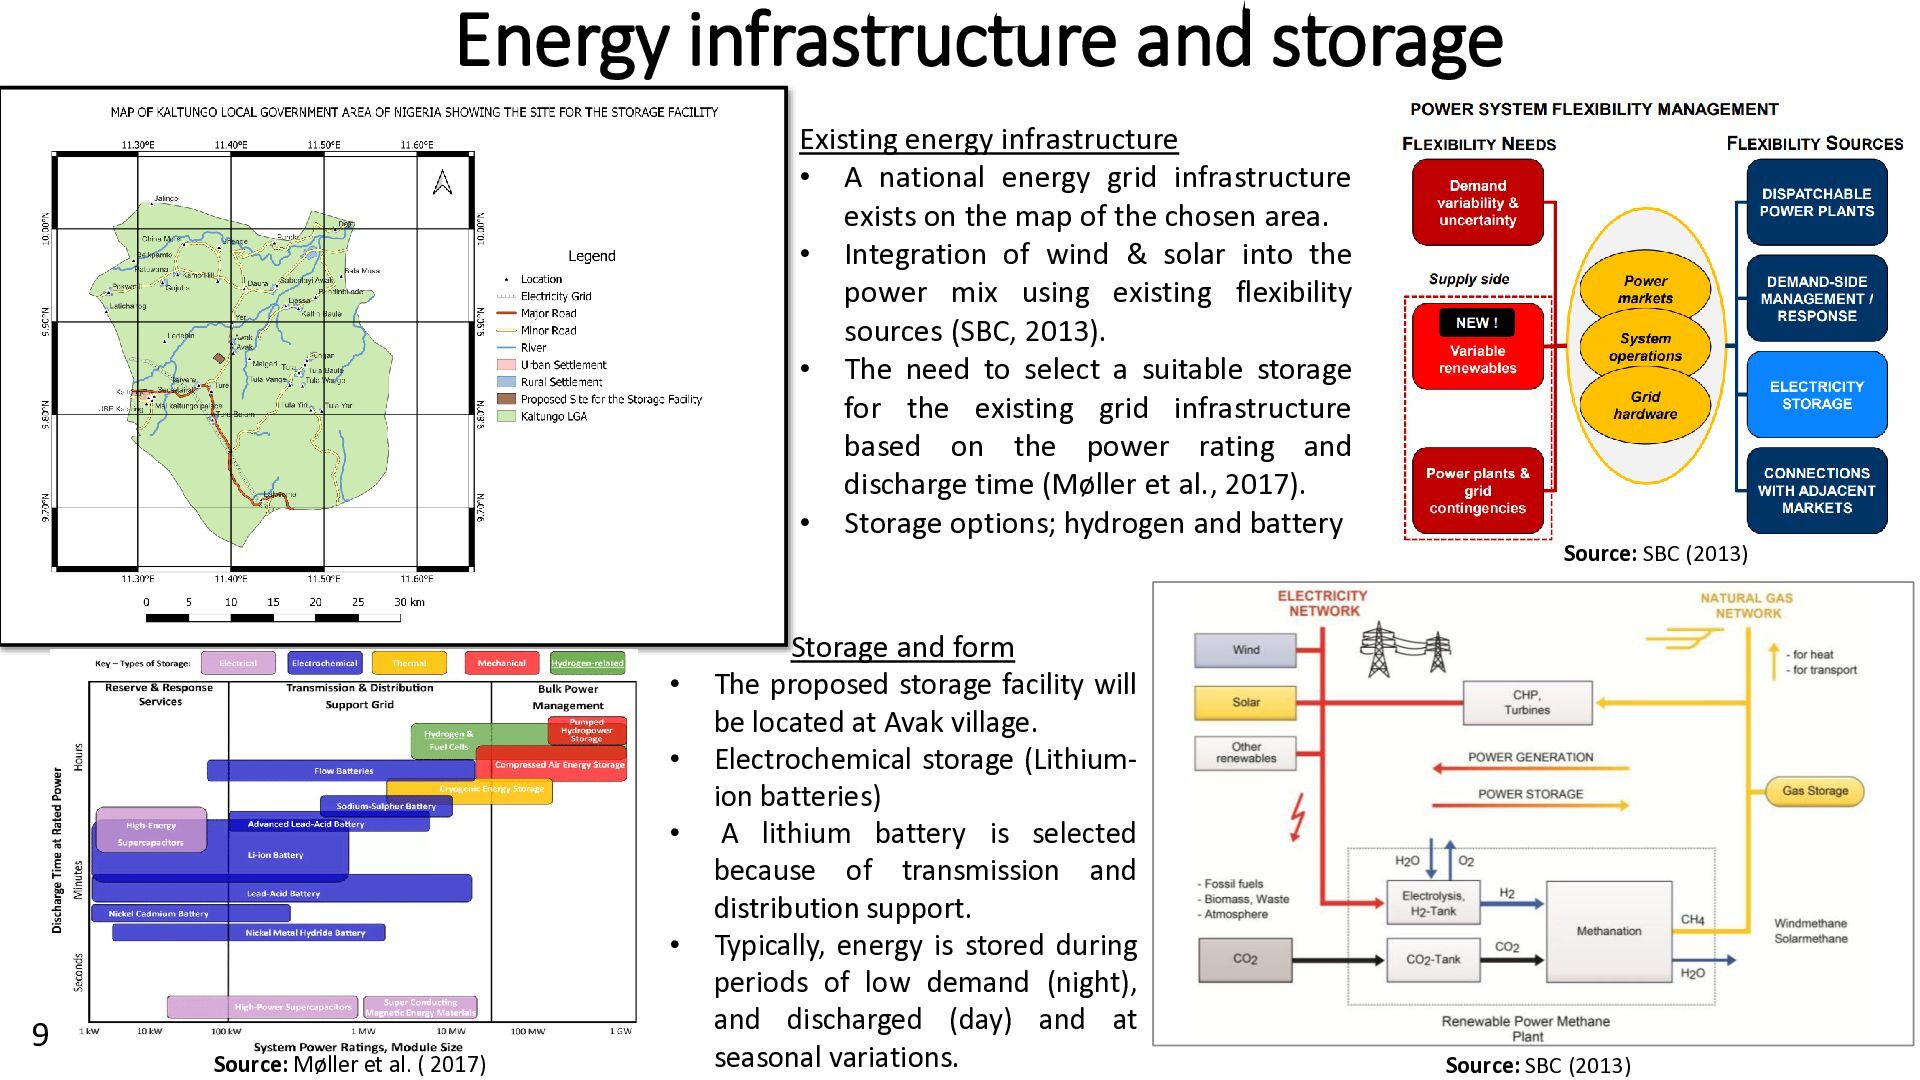
  9. Energy infrastructure and storage 9 Storage and form • The

    proposed storage facility will be located at Avak village. • Electrochemical storage (Lithium- ion batteries) • A lithium battery is selected because of transmission and distribution support. • Typically, energy is stored during periods of low demand (night), and discharged (day) and at seasonal variations. Source: Møller et al. ( 2017) Source: SBC (2013) Source: SBC (2013) Existing energy infrastructure • A national energy grid infrastructure exists on the map of the chosen area. • Integration of wind & solar into the power mix using existing flexibility sources (SBC, 2013). • The need to select a suitable storage for the existing grid infrastructure based on the power rating and discharge time (Møller et al., 2017). • Storage options; hydrogen and battery
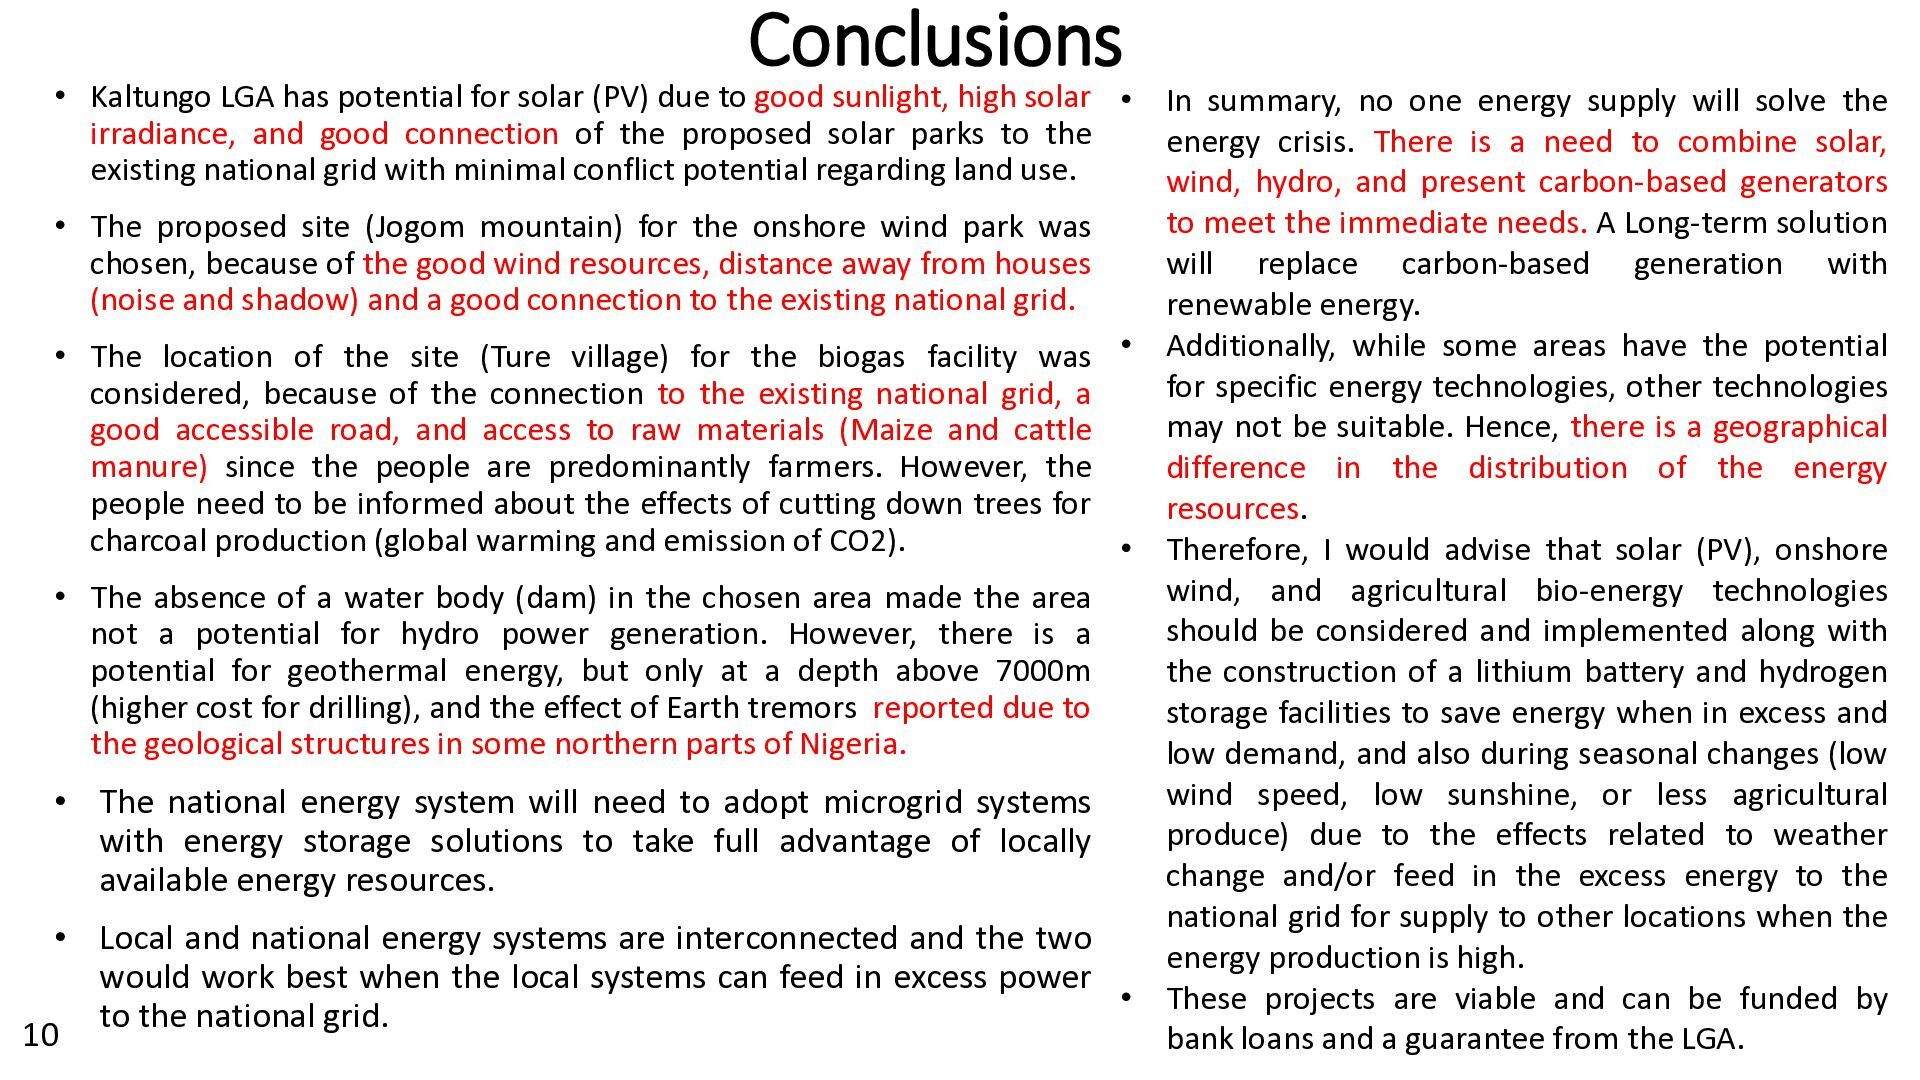
  10. Conclusions • Kaltungo LGA has potential for solar (PV) due

    to good sunlight, high solar irradiance, and good connection of the proposed solar parks to the existing national grid with minimal conflict potential regarding land use. • The proposed site (Jogom mountain) for the onshore wind park was chosen, because of the good wind resources, distance away from houses (noise and shadow) and a good connection to the existing national grid. • The location of the site (Ture village) for the biogas facility was considered, because of the connection to the existing national grid, a good accessible road, and access to raw materials (Maize and cattle manure) since the people are predominantly farmers. However, the people need to be informed about the effects of cutting down trees for charcoal production (global warming and emission of CO2). • The absence of a water body (dam) in the chosen area made the area not a potential for hydro power generation. However, there is a potential for geothermal energy, but only at a depth above 7000m (higher cost for drilling), and the effect of Earth tremors reported due to the geological structures in some northern parts of Nigeria. • The national energy system will need to adopt microgrid systems with energy storage solutions to take full advantage of locally available energy resources. • Local and national energy systems are interconnected and the two would work best when the local systems can feed in excess power to the national grid. 10 • In summary, no one energy supply will solve the energy crisis. There is a need to combine solar, wind, hydro, and present carbon-based generators to meet the immediate needs. A Long-term solution will replace carbon-based generation with renewable energy. • Additionally, while some areas have the potential for specific energy technologies, other technologies may not be suitable. Hence, there is a geographical difference in the distribution of the energy resources. • Therefore, I would advise that solar (PV), onshore wind, and agricultural bio-energy technologies should be considered and implemented along with the construction of a lithium battery and hydrogen storage facilities to save energy when in excess and low demand, and also during seasonal changes (low wind speed, low sunshine, or less agricultural produce) due to the effects related to weather change and/or feed in the excess energy to the national grid for supply to other locations when the energy production is high. • These projects are viable and can be funded by bank loans and a guarantee from the LGA.
  11. Reference Bekkering J. (2025). Lecture 7: Biomass energy [PowerPoint slides]

    retrieved on November 1, 2025 from https://brightspace.hanze.nl/d2l/le/lessons/17768/topics/690605 Gombe State Government (GSG) (2025). Directorate of Research, Documentation & ICT retrieved on October 29, 2025 from https://www.gombestate.gov.ng/ Hoes, O. A., Meijer, L. J., Van Der Ent, R. J., & Van De Giesen, N. C. (2017). Systematic high-resolution assessment of global hydropower potential. PloS one, 12(2), e0171844.https://journals.plos.org/plosone/article?id=10.1371/journal.pone.0171844 International Energy Agency (IEA) (2025). Global geothermal potential retrieved on October 28, 2025 from https://www.iea.org/reports/the- future-of-geothermal-energy/global-geothermal-potential-for-electricity-generation-using-egs-technologies Møller, K. T., Jensen, T. R., Akiba, E., & Li, H. W. (2017). Hydrogen-A sustainable energy carrier. Progress in natural science: Materials International, 27(1), 34-40. National Bureau of Statistics (NBS) (2024). Report retrieved on October 20, 2025 from https://www.nigerianstat.gov.ng/elibrary Nigeria Residential Energy Demand-Side Survey (NREDSS) (2024). Report retrieved on October 18 ,2025 from https://www.scribd.com/document/827149481/ Nigeria Integrated Resource Plan (NIRP) (2024). Report retrieved on October 16, 2025 from https://www.scribd.com/document/845968495/ Saadatmand, M., Gharehpetian, G. B., Moghassemi, A., Guerrero, J. M., Siano, P., & Alhelou, H. H. (2021). Damping of low-frequency oscillations in power systems by large-scale PV farms: A comprehensive review of control methods. IEEE Access, 9, 72183-72206. Schlumberger Business Consulting (SBC) (2013). Lecture 13: Balancing demand and supply: Electricity Storage [PowerPoint slides] retrieved on November 1, 2025 from https://brightspace.hanze.nl/d2l/le/lessons/17768/topics/695543 Metadata Administrative boundary shapefile: 2022 administrative boundary of Nigeria retrieved on October 24, 2025 from https://www.geoboundaries.org/countryDownloads.html Roads, river, location and settlements shapefile: retrieved on October 26, 2025 from OpenStreetMap and Google hybrid data Global Solar Atlas (2025):https://globalsolaratlas.info/map?c=9.857246,11.322784,11 Global Wind Atlas (2025):https://globalwindatlas.info/en/area/Nigeria/Gombe PVGIS (2025):https://pvgis.com/en 11