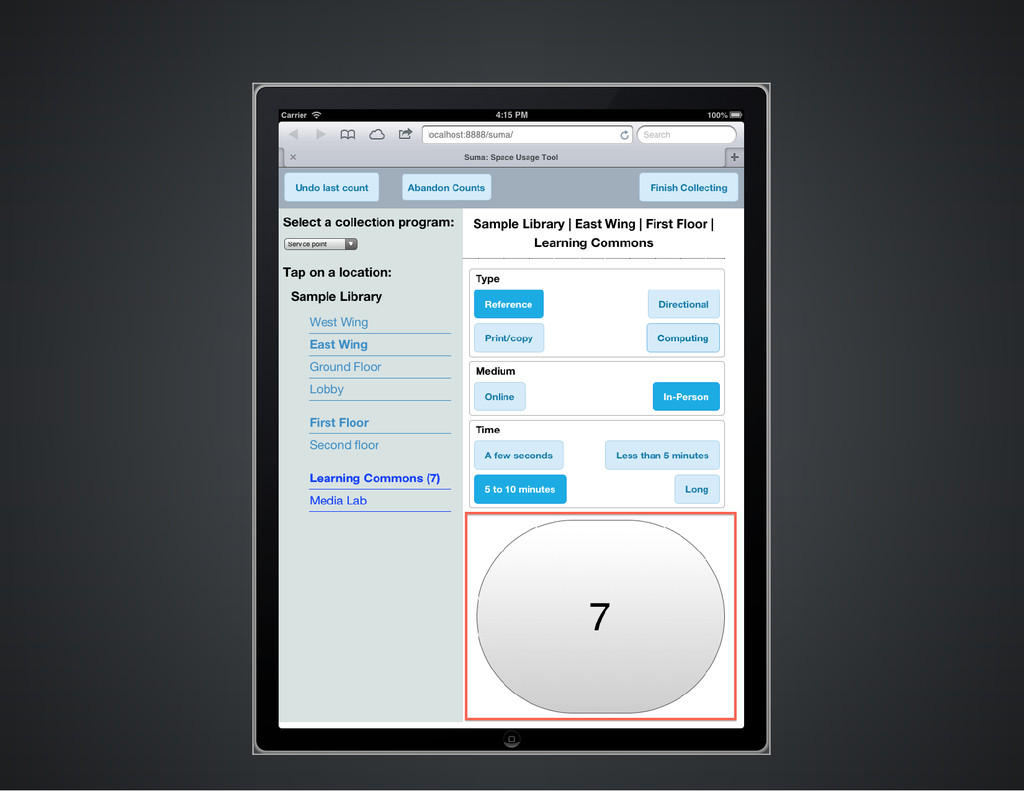
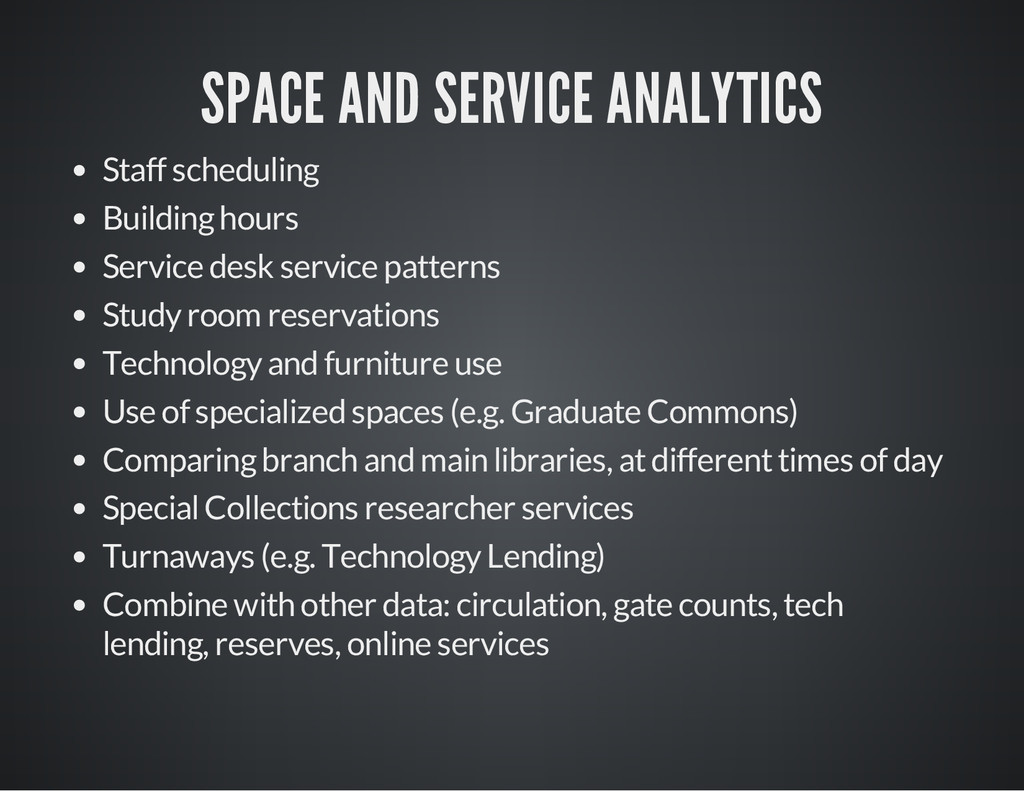
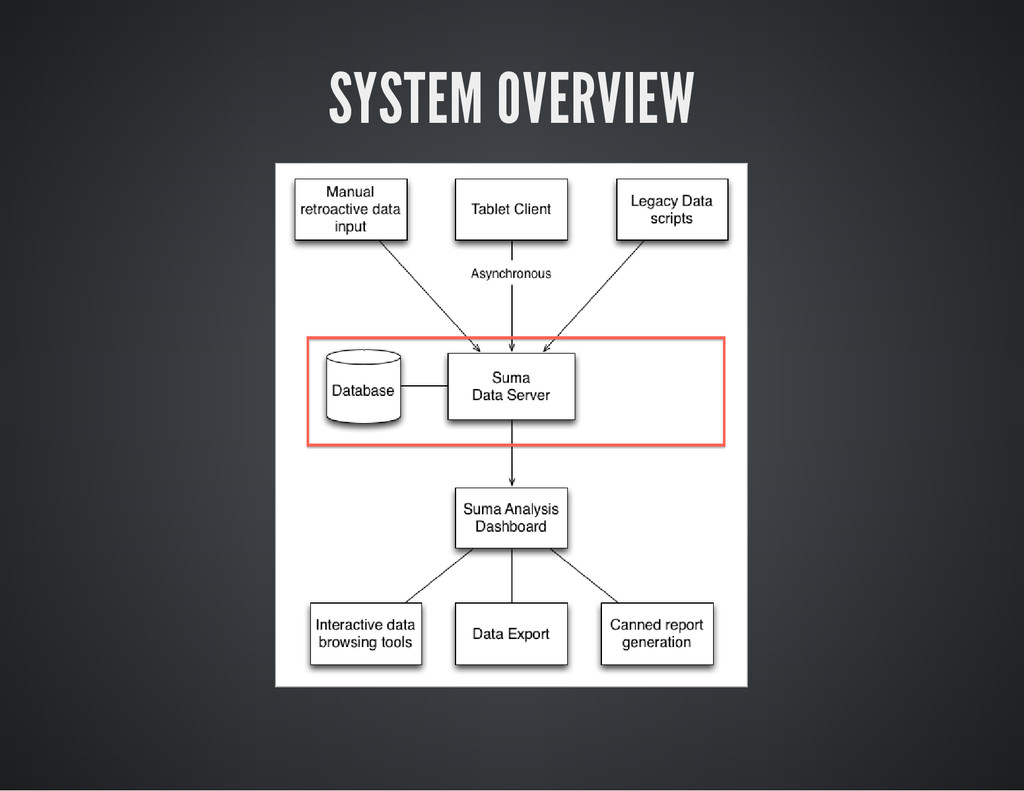
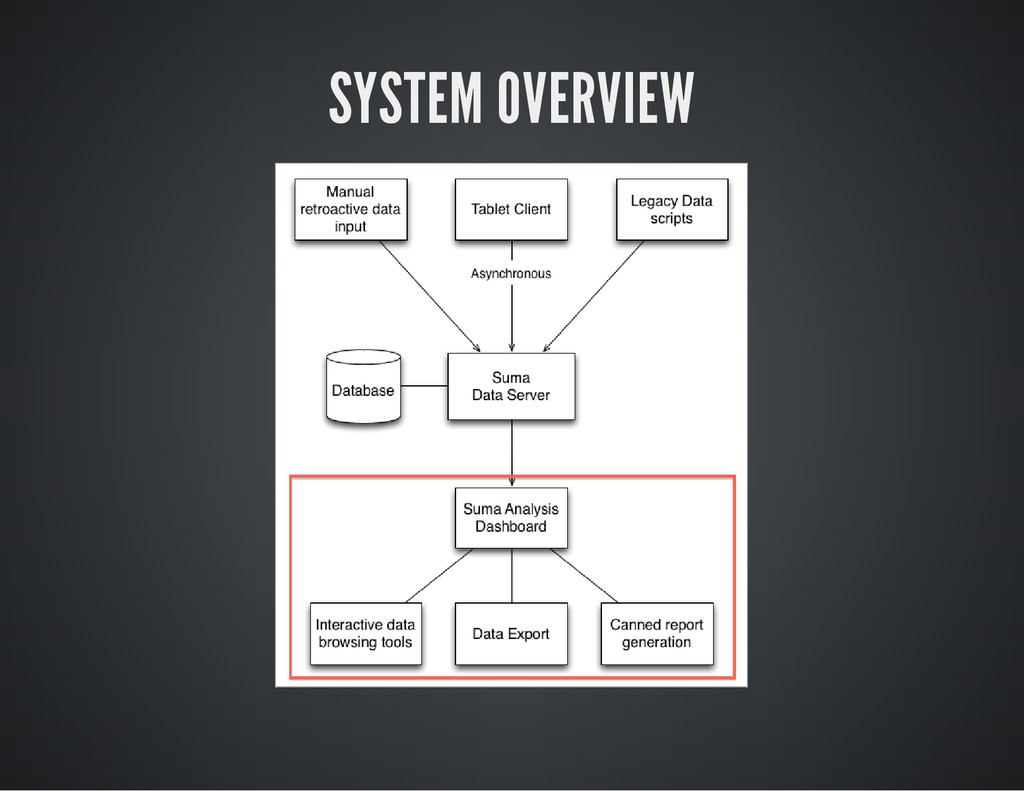
library staff in assessment of how patrons are using library spaces. In other words…the gathering, storing, exporting, analyzing, and visualizing of data across spaces/activities/time and around events.
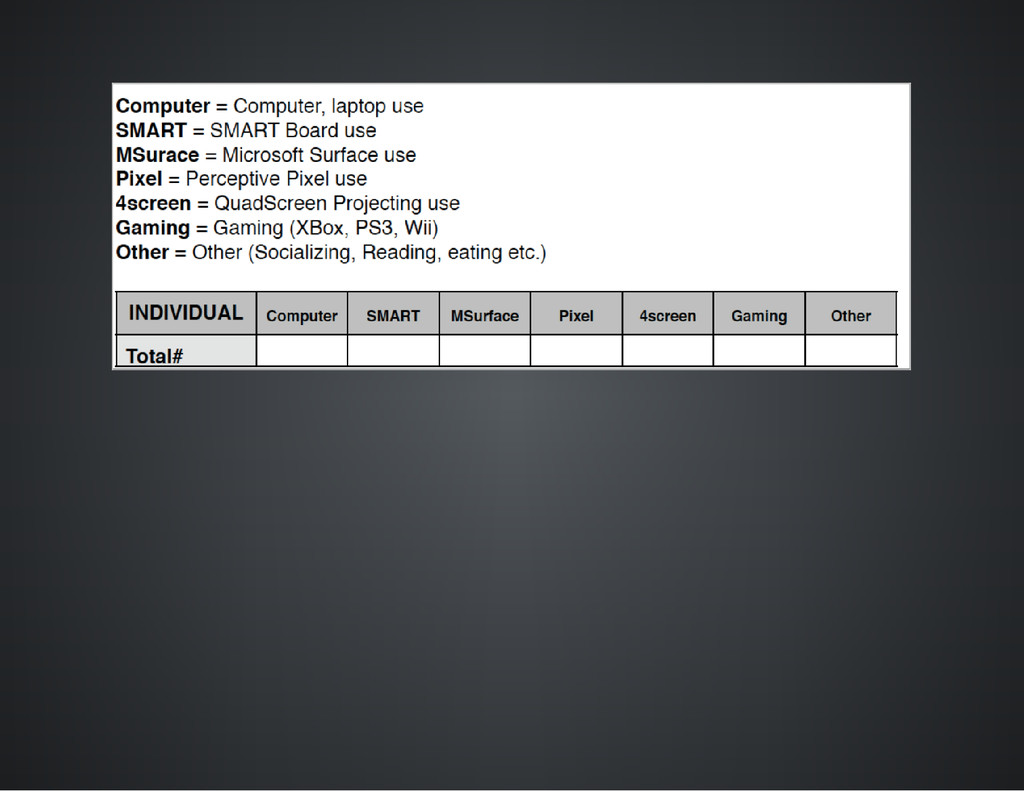
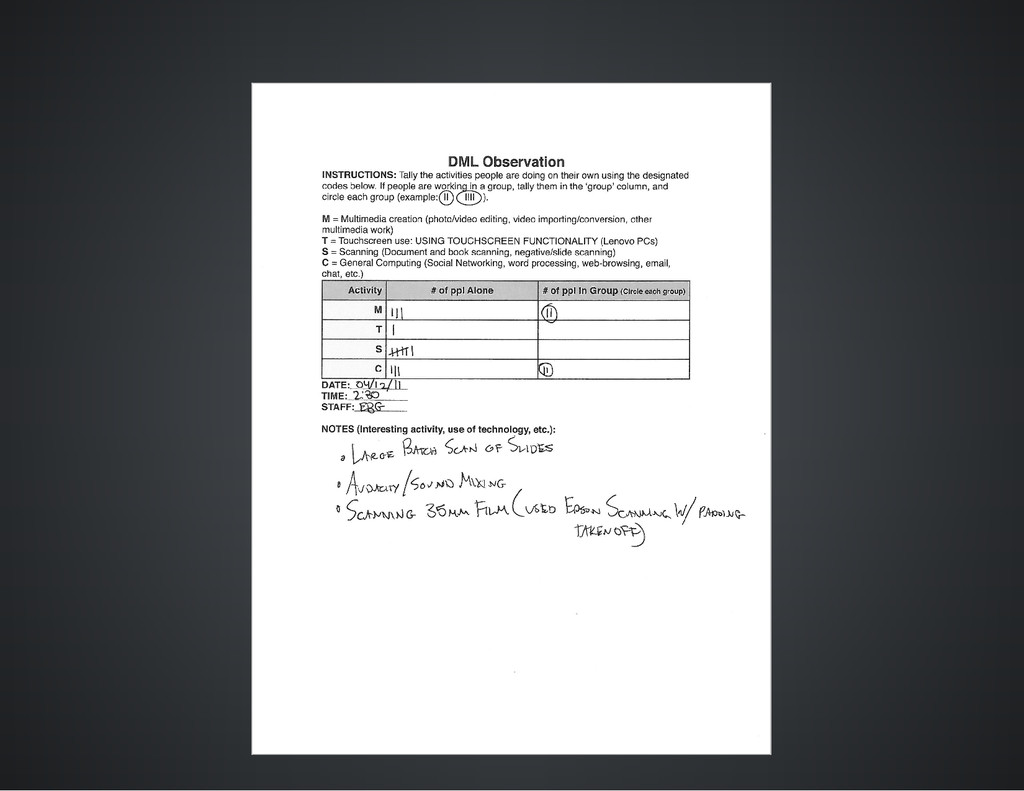
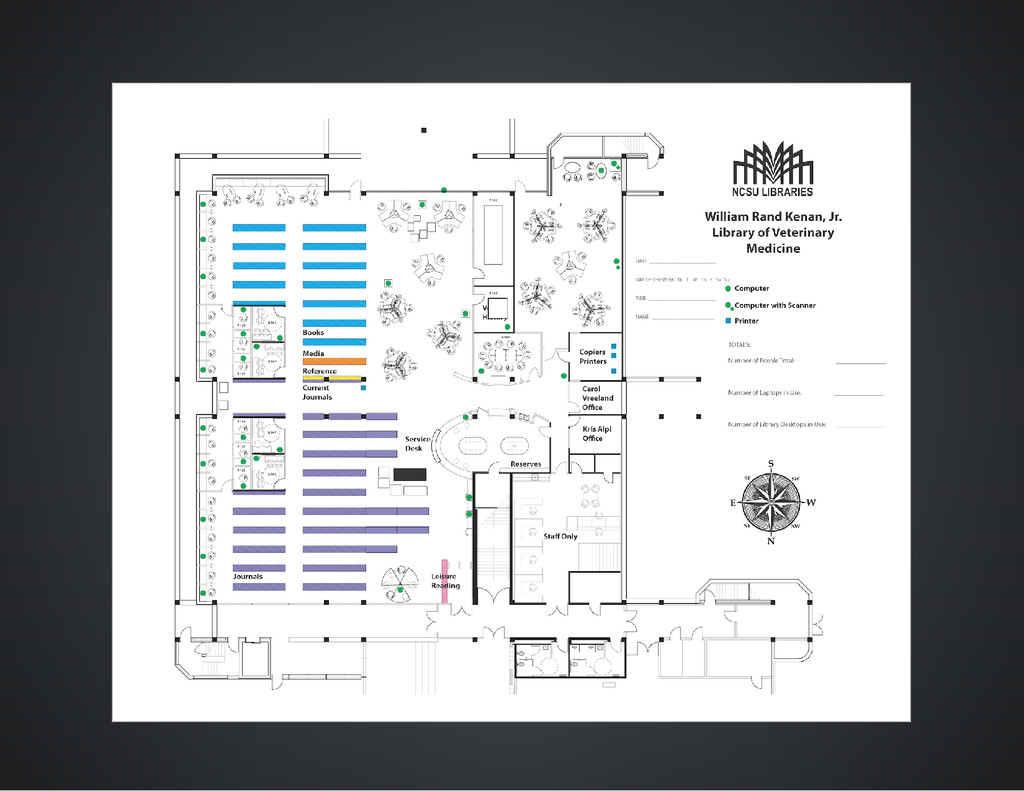
service patterns Study room reservations Technology and furniture use Use of specialized spaces (e.g. Graduate Commons) Comparing branch and main libraries, at different times of day Special Collections researcher services Turnaways (e.g. Technology Lending) Combine with other data: circulation, gate counts, tech lending, reserves, online services
![THANK YOU! http://go.ncsu.edu/Suma Jason Casden: [email protected] Bret Davidson: [email protected]](https://files.speakerdeck.com/presentations/ee4d58c000830132d23f26e027f8fa10/slide_40.jpg)