Upgrade to Pro — share decks privately, control downloads, hide ads and more …

Suma: An open-source toolkit for library assessment

Bret Davidson
July 13, 2012
230

Suma: An open-source toolkit for library assessment

Bret Davidson

July 13, 2012
Tweet

More Decks by Bret Davidson

Transcript

  1. Suma:  an  open-­‐source  toolkit  for   library  assessment   Jason

     Casden   Bret  Davidson   North  Carolina  State  University  Libraries  
  2. Problem  statement   •  Many  libraries  perform  manual  counts  of

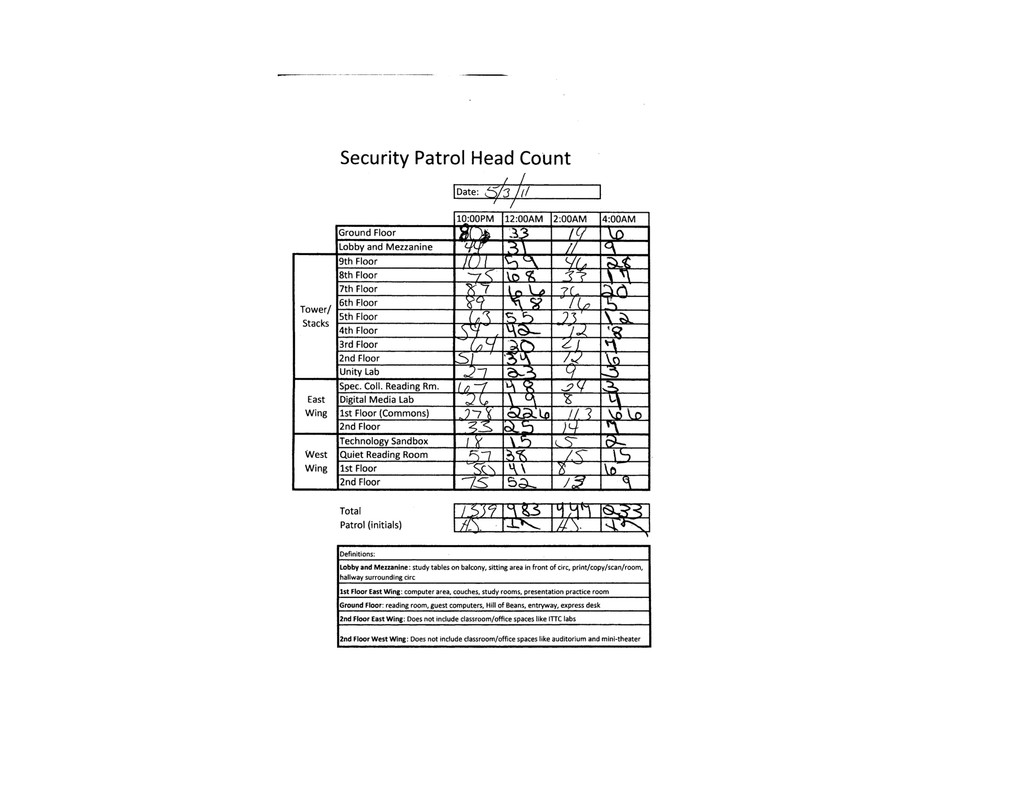
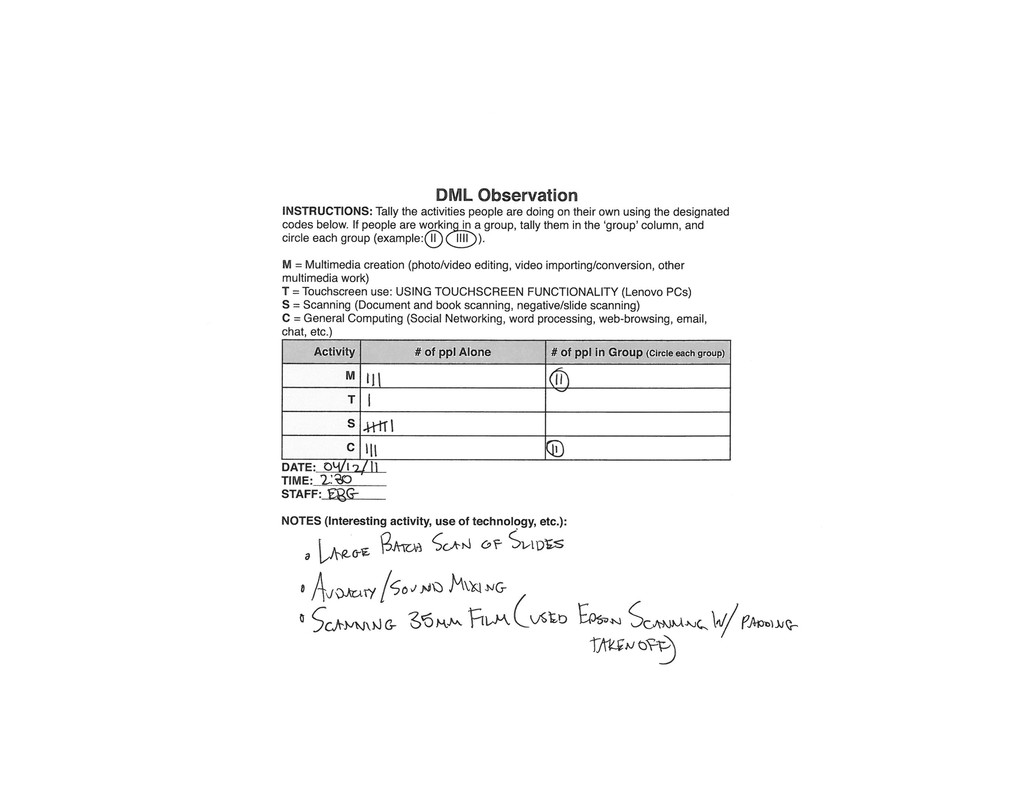
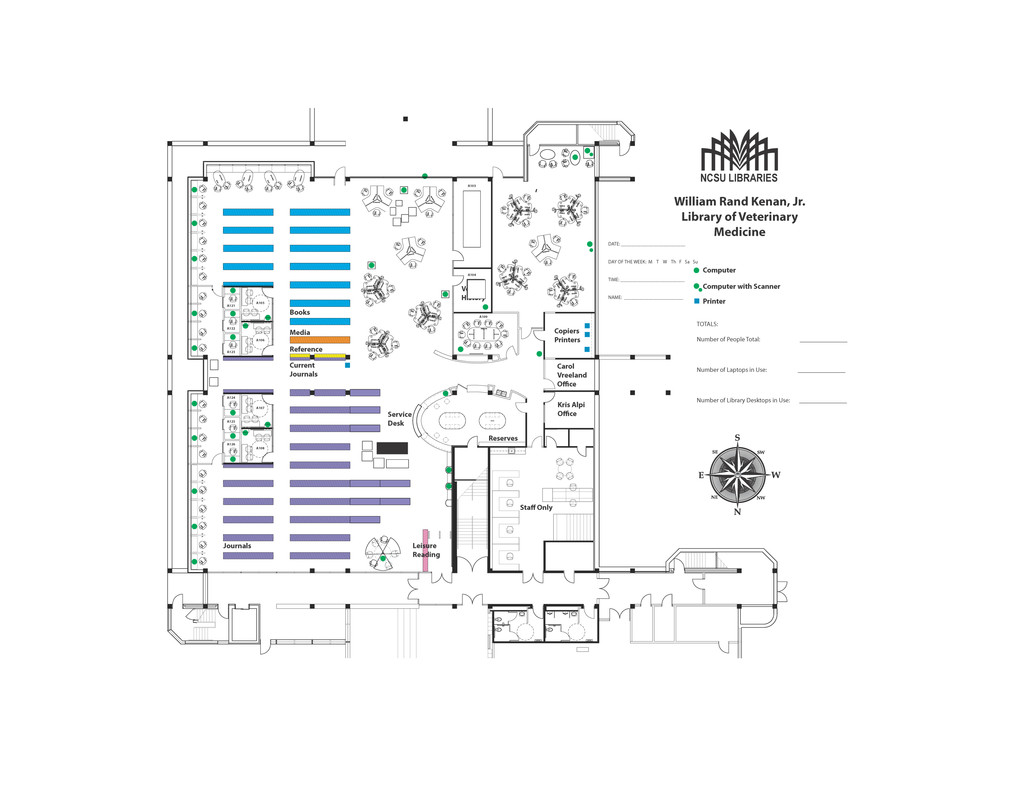
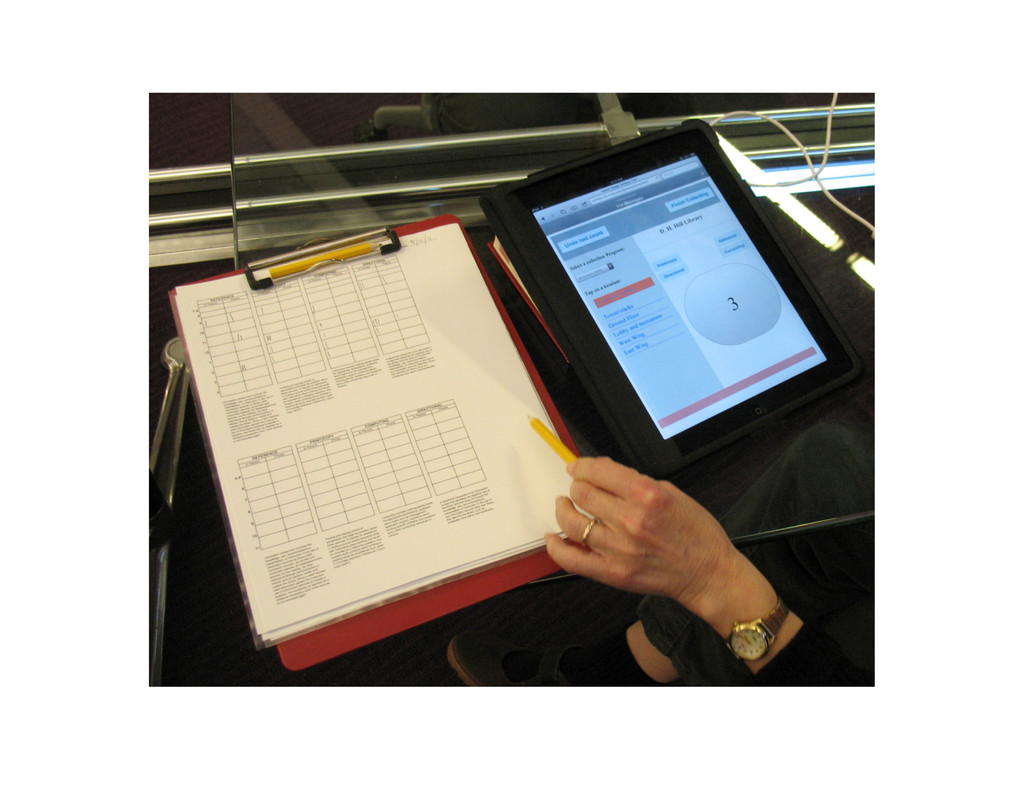
      people  in  spaces  doing  something  at  some   Cme   •  The  process  involves  tedious  collecCon   mechanisms,  lots  of  paperwork,  and  much   room  for  error   •  There  is  no  coordinated  effort  to  help   departments  analyze  their  data  
  3. Our  soluCon   An  open  source  tablet-­‐based  app  (well,  toolkit)

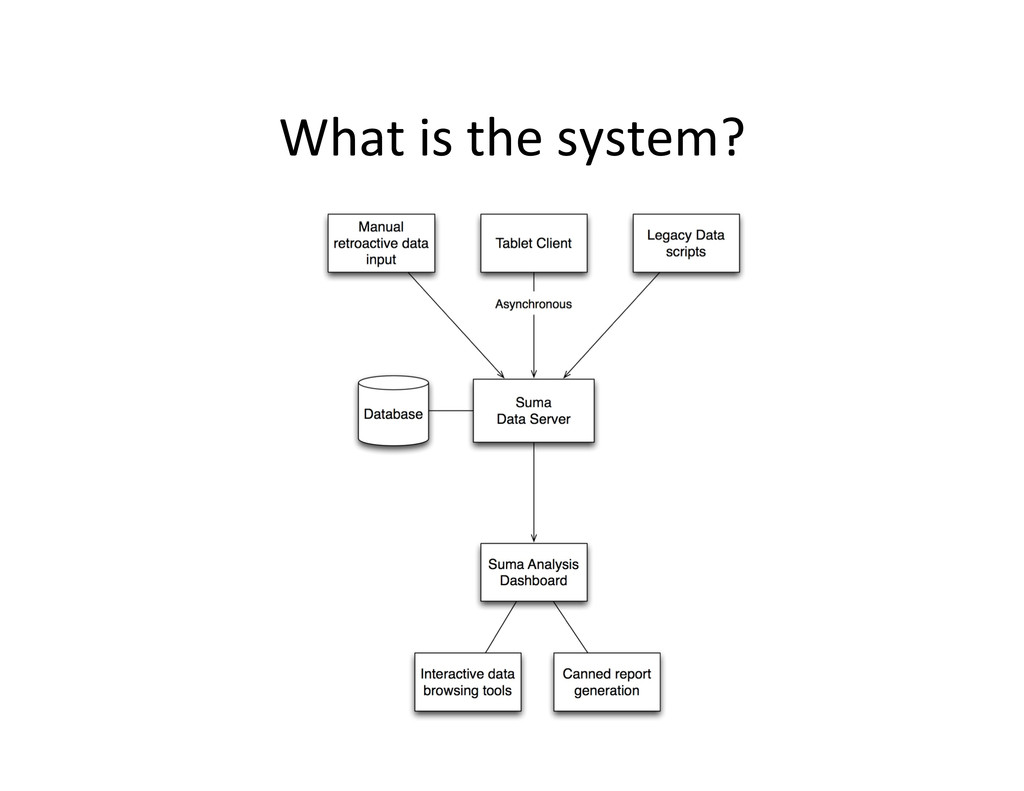
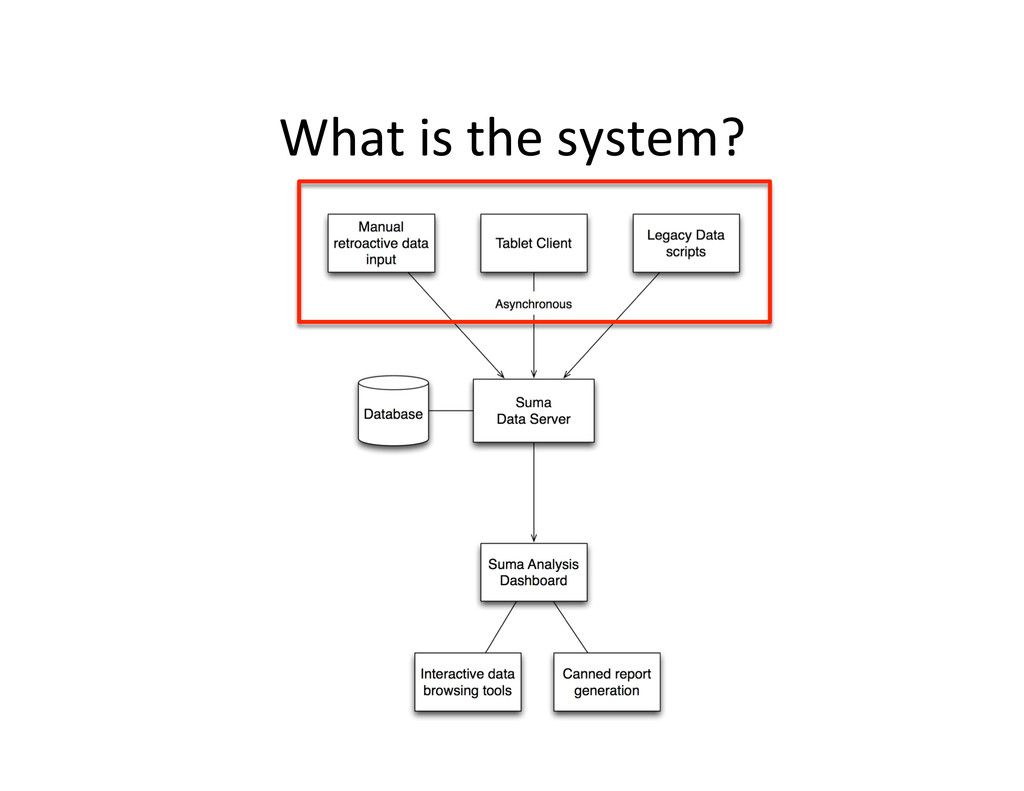
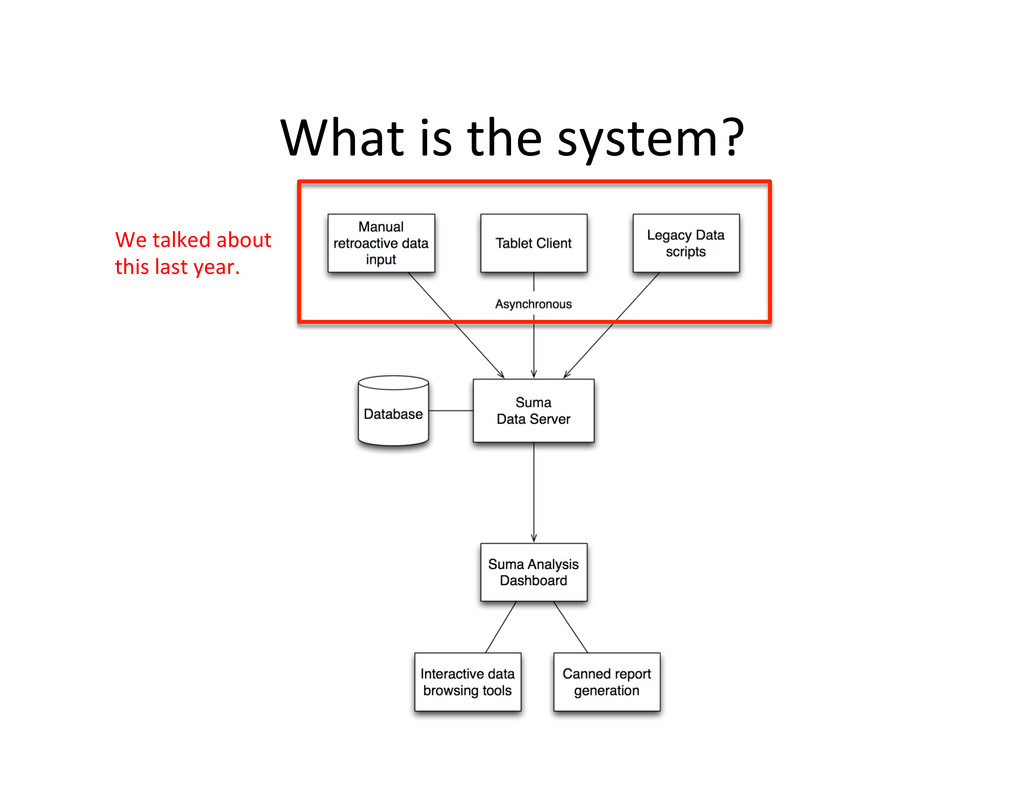
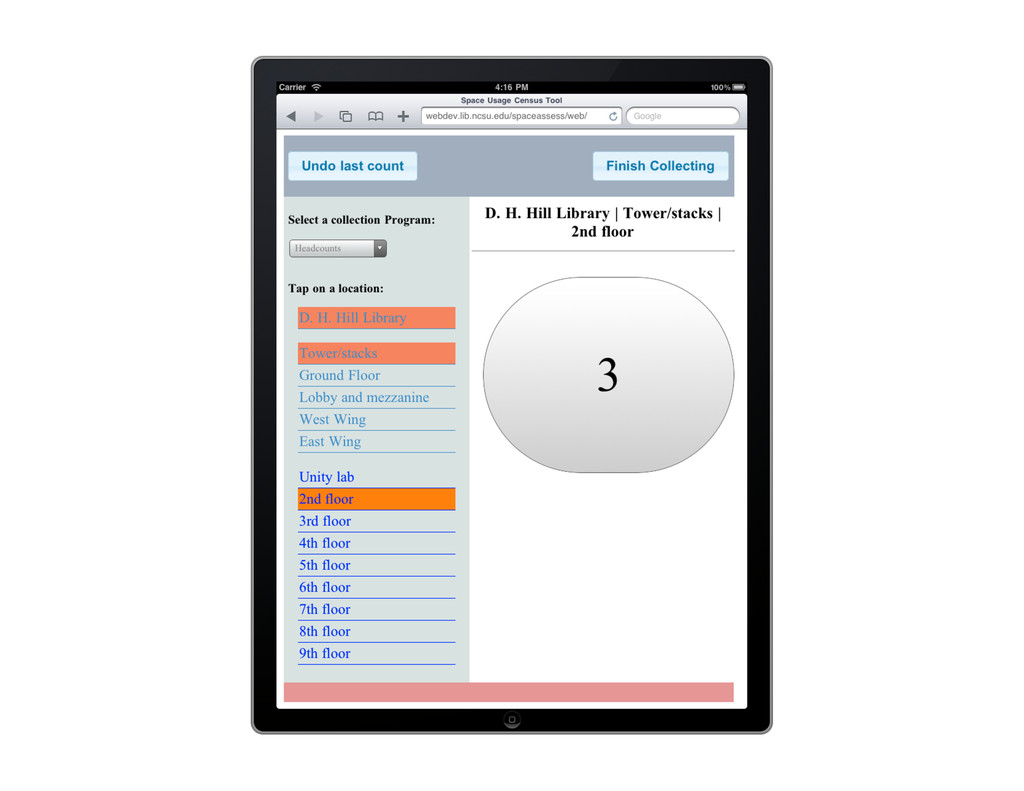
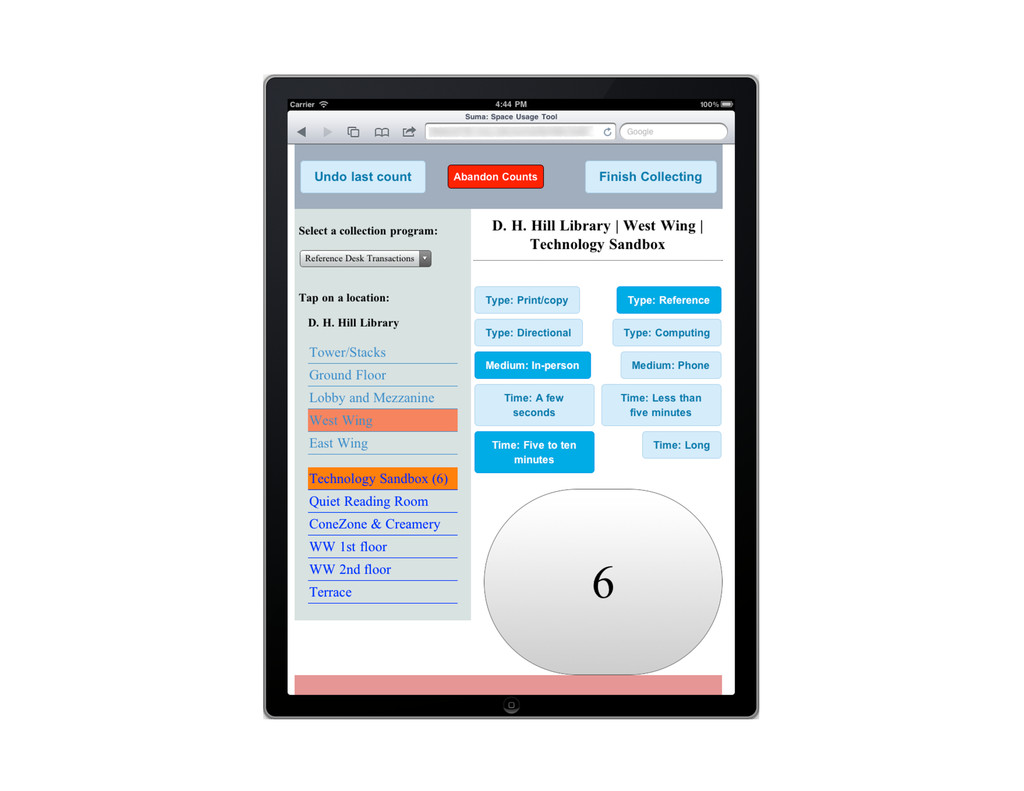
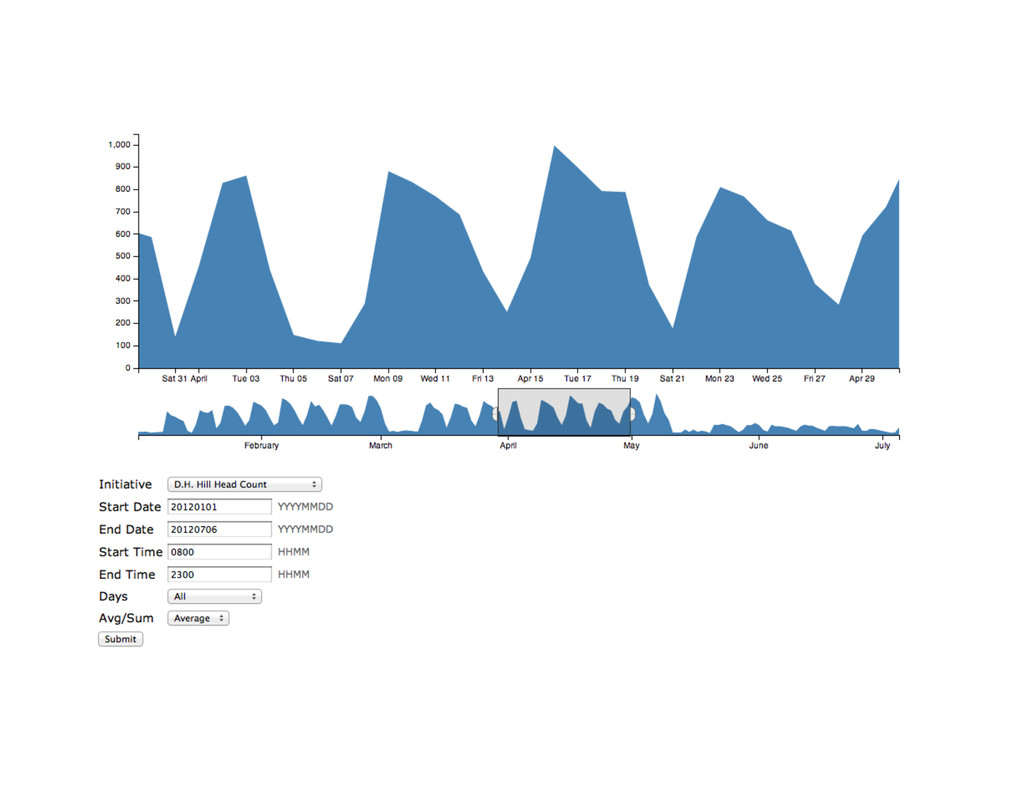
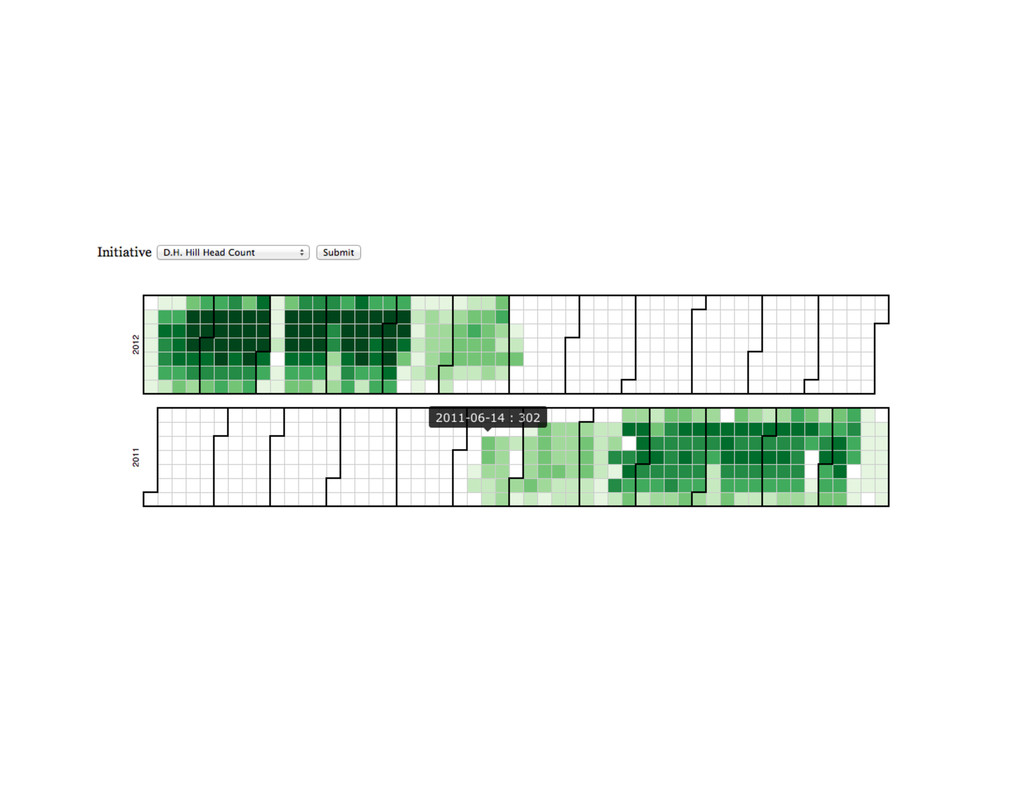
      to  aid  library  staff  in  assessment  of  how   patrons  are  using  library  spaces.     In  other  words…the  gathering,  storing,   exporCng,  analyzing,  and  visualizing  of  data   across  spaces/acCviCes/Cme  and  around   events.  
  4. AcCvity  tracking   •  Are  some  spaces  more  conducive  to

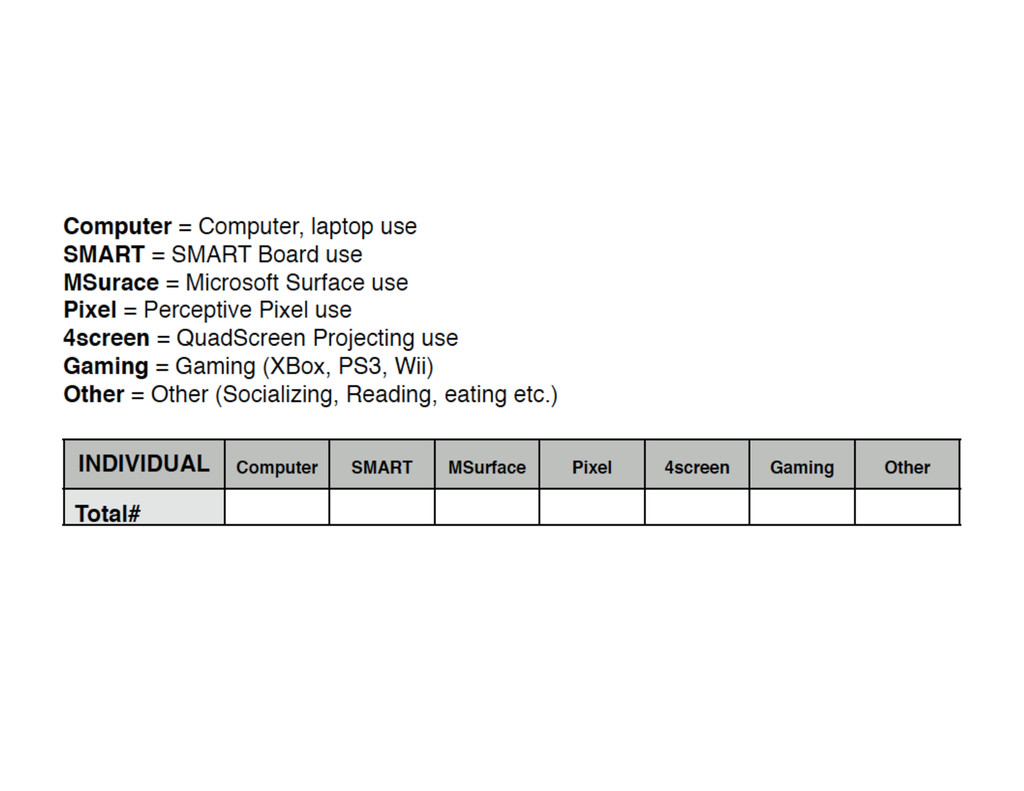
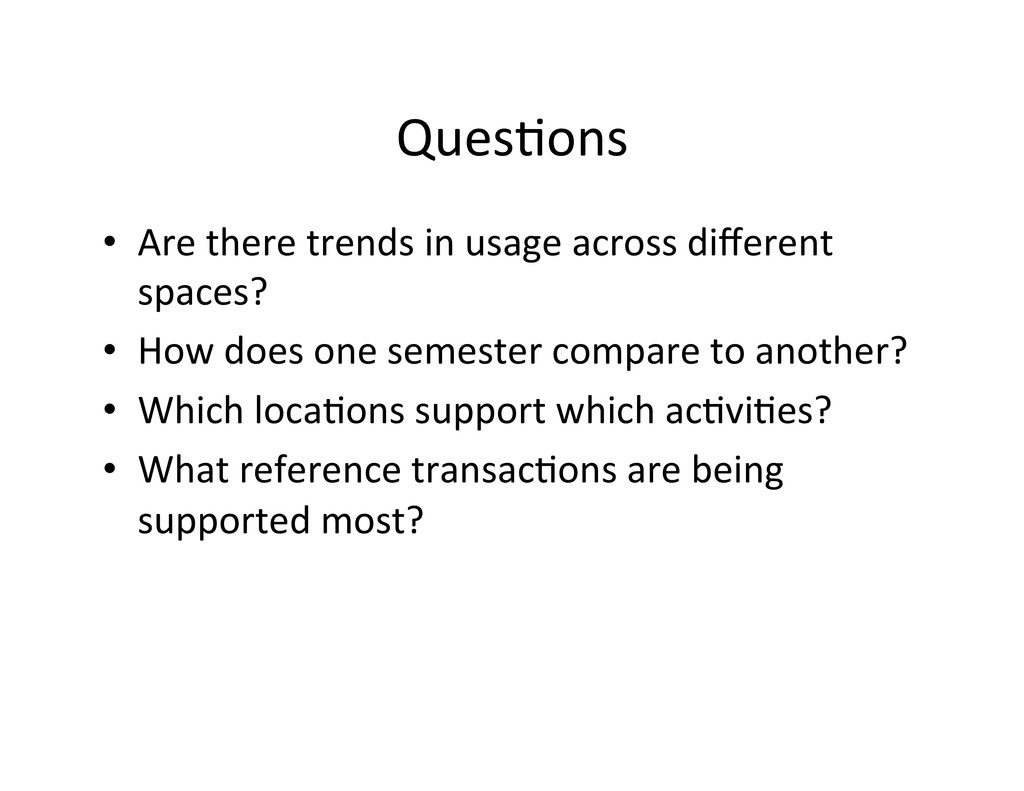
     group   study  or  individual  study?   •  What’s  the  raCo  of  usage  of  laptops  versus   public  computers  versus  no  computers?   •  Do  changes  to  space  components  change  the   type  of  usage?  
  5. Staff  as  sensors   Joyce  Chapman:  librarian,  project  team  member,

     slide  contributor,  wireframer,  data  analyst,  illustrator.  
  6. This  actually  works  now  (notes)   •  Manage  iniCaCves,  locaCons,

     and  acCviCes   •  Normalize,  backup  data   •  Performance-­‐opCmized  data  querying  web   service   •  DocumentaCon   •  Open-­‐source  release  
  7. SecCon  themes   •  Show-­‐off  visualizaCons   •  User  quesCons

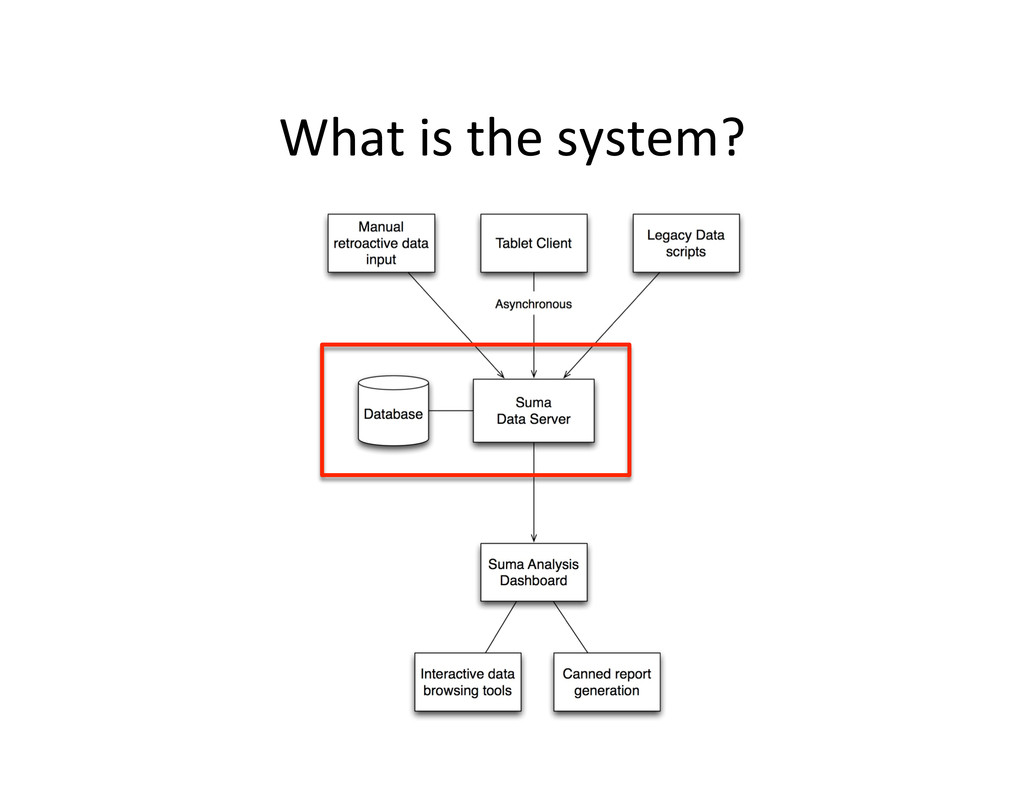
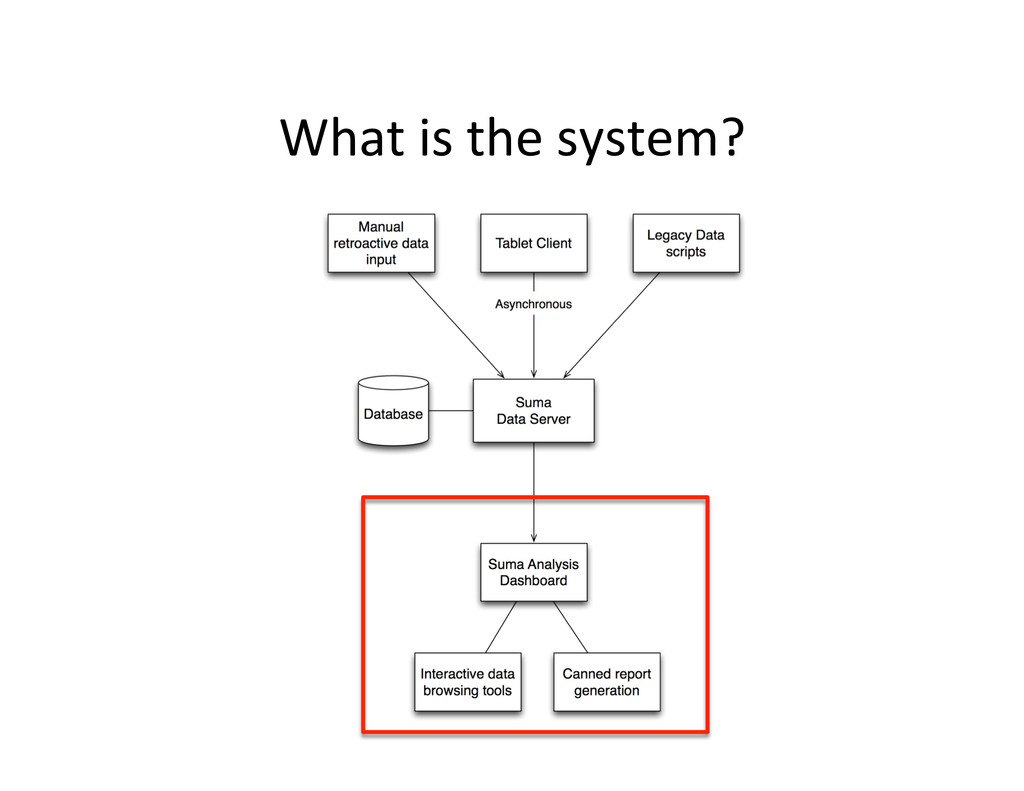
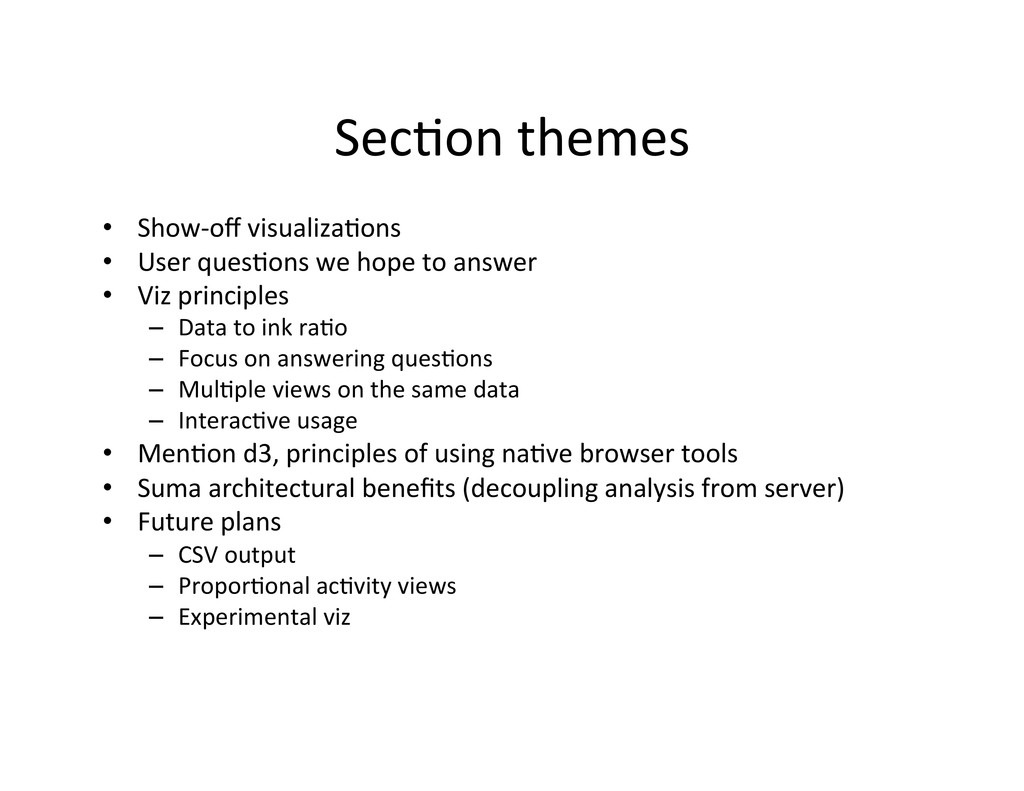
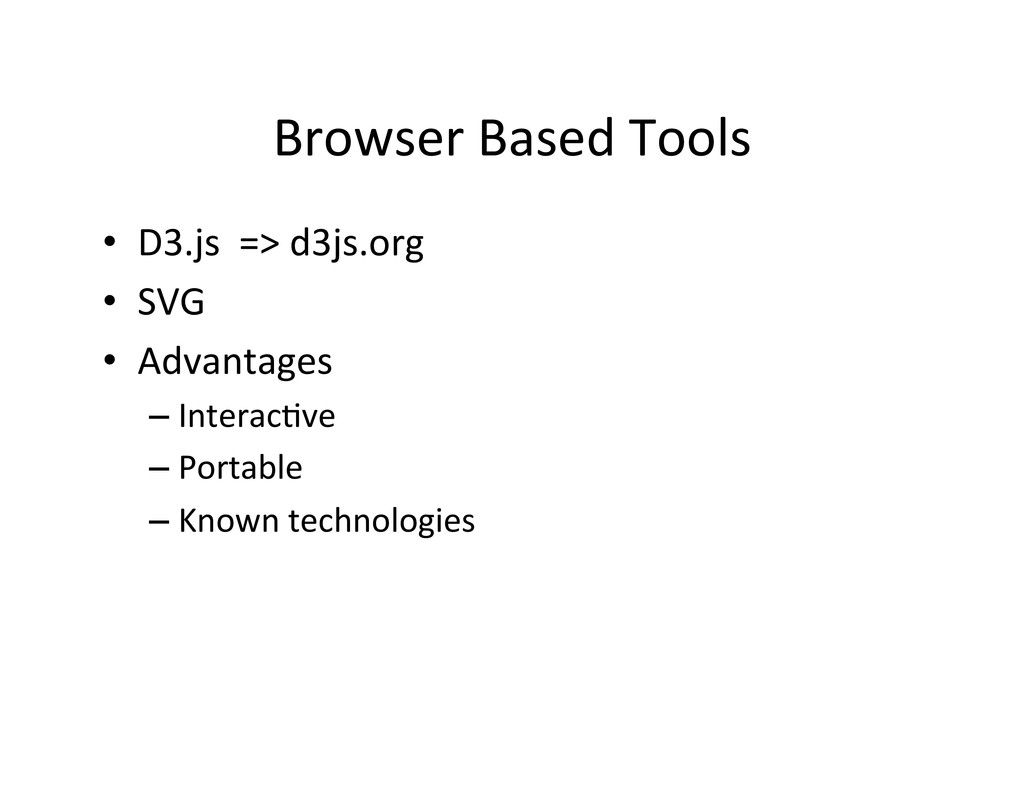
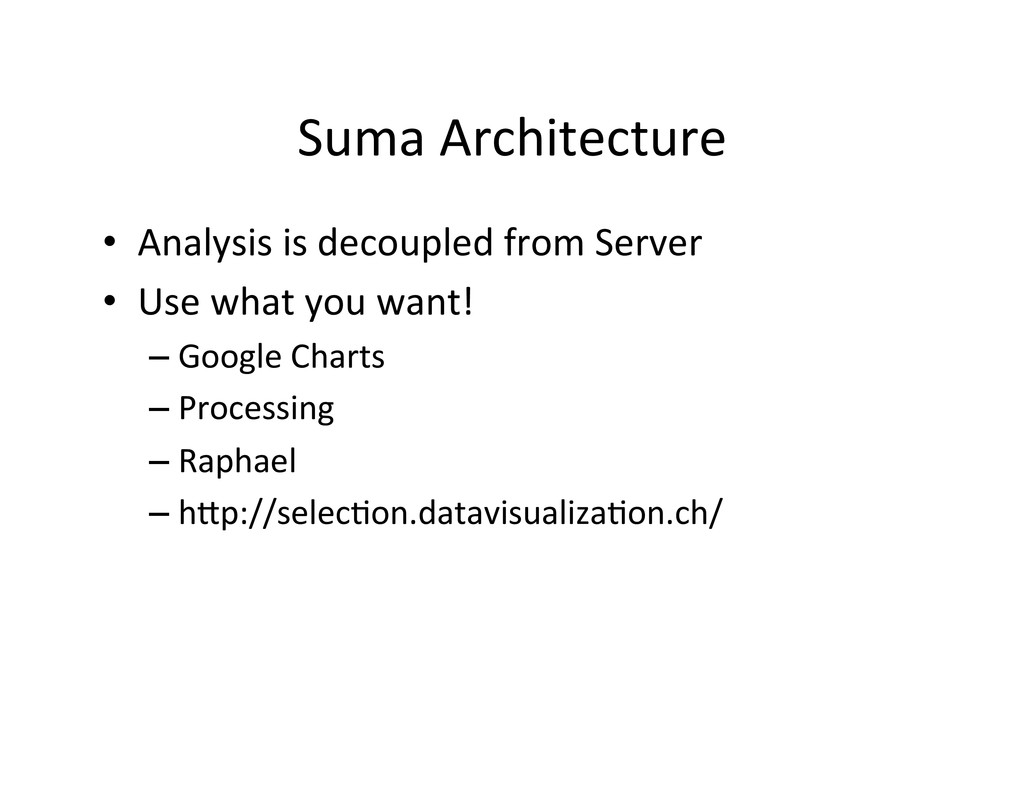
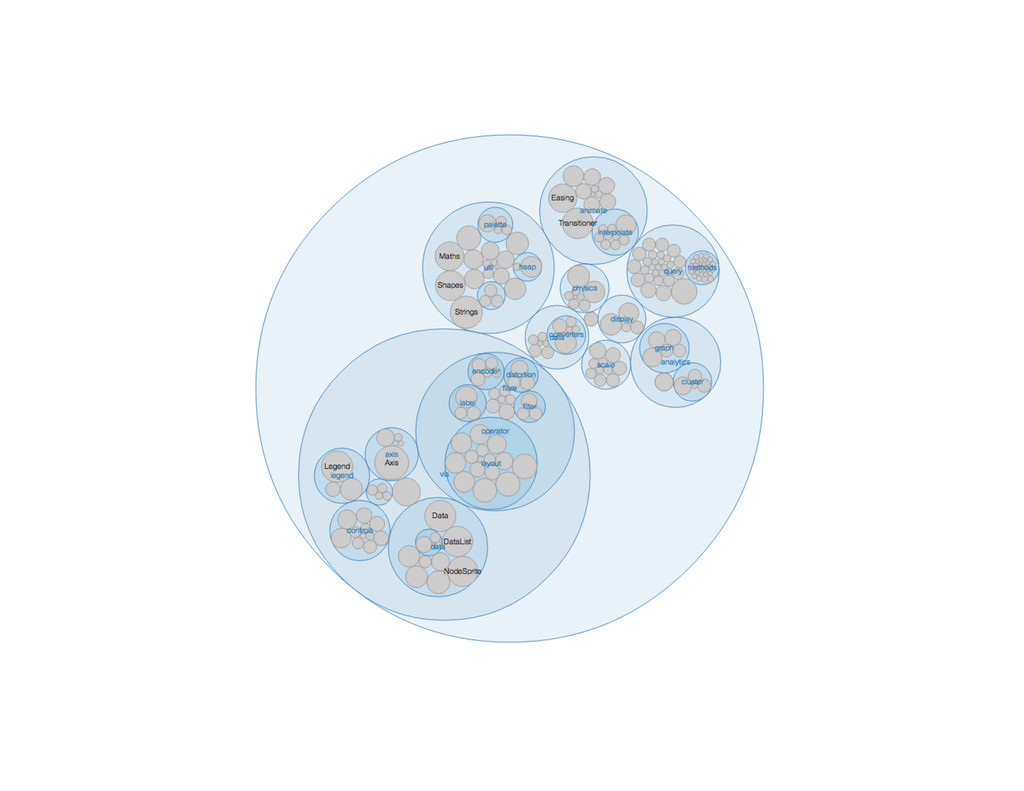
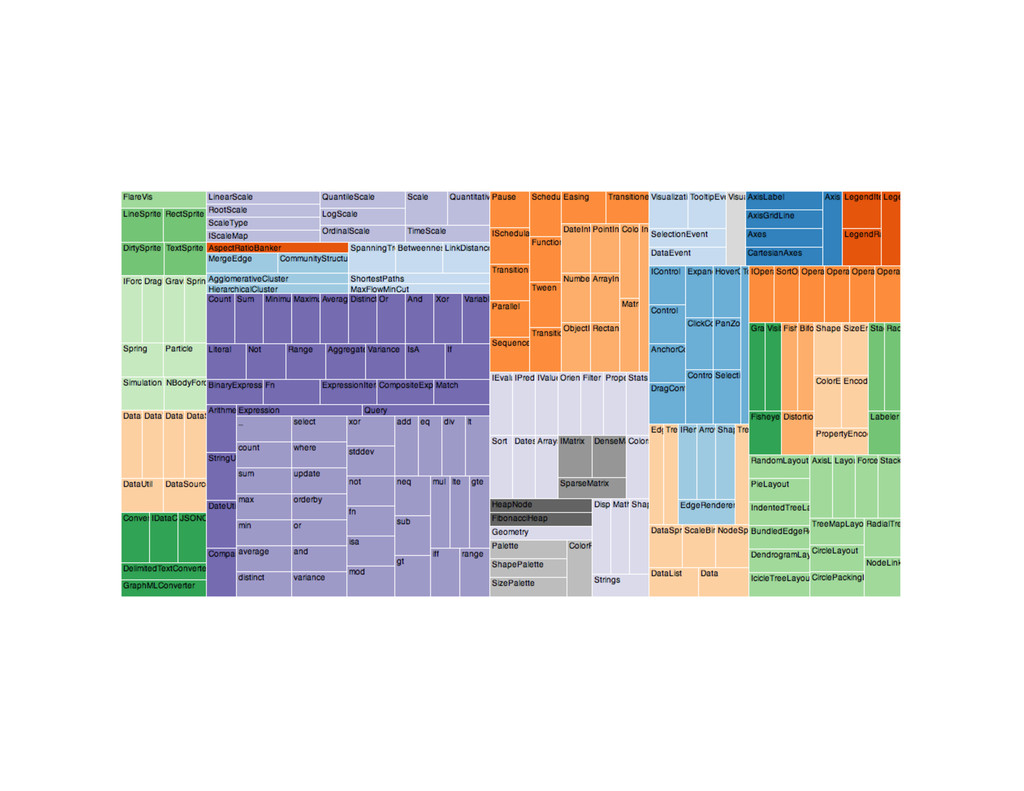
     we  hope  to  answer   •  Viz  principles   –  Data  to  ink  raCo   –  Focus  on  answering  quesCons   –  MulCple  views  on  the  same  data   –  InteracCve  usage   •  MenCon  d3,  principles  of  using  naCve  browser  tools   •  Suma  architectural  benefits  (decoupling  analysis  from  server)   •  Future  plans   –  CSV  output   –  ProporConal  acCvity  views   –  Experimental  viz  
  8. VisualizaCon  Principles   •  Focus  on  answering  real  quesCons  

    •  InteracCve  usage   •  MulCple  views  of  same  data   •  Apply  best  pracCces   – High  “data  to  ink”  raCo   – Don’t  distort  data   – Tu`e,  Few,  etc.    
  9. QuesCons   •  Are  there  trends  in  usage  across  different

      spaces?   •  How  does  one  semester  compare  to  another?   •  Which  locaCons  support  which  acCviCes?   •  What  reference  transacCons  are  being   supported  most?    
  10. Browser  Based  Tools   •  D3.js    =>  d3js.org  

    •  SVG   •  Advantages   – InteracCve   – Portable   – Known  technologies  
  11. Suma  Architecture   •  Analysis  is  decoupled  from  Server  

    •  Use  what  you  want!   – Google  Charts   – Processing   – Raphael   – hgp://selecCon.datavisualizaCon.ch/  
  12. Future  Analysis   •  CSV  export  of  selected  data  

    •  ProporConal  analysis  of  acCviCes   •  Experimental  VisualizaCons  
  13. Project  team     •  Jason  Casden   •  Joyce

     Chapman   •  Rob  Rucker   •  Eric  McEachern   •  Rusty  Earl   •  Bret  Davidson  
  14. Thanks!     Jason  Casden   [email protected]     Bret

     Davidson   [email protected]     hgp://www.lib.ncsu.edu/dli/projects/spaceassesstool   hgp://github.com/cazzerson/Suma