Upgrade to Pro — share decks privately, control downloads, hide ads and more …

Analyzing Java Memory Usage and Leaks

Analyzing Java Memory Usage and Leaks

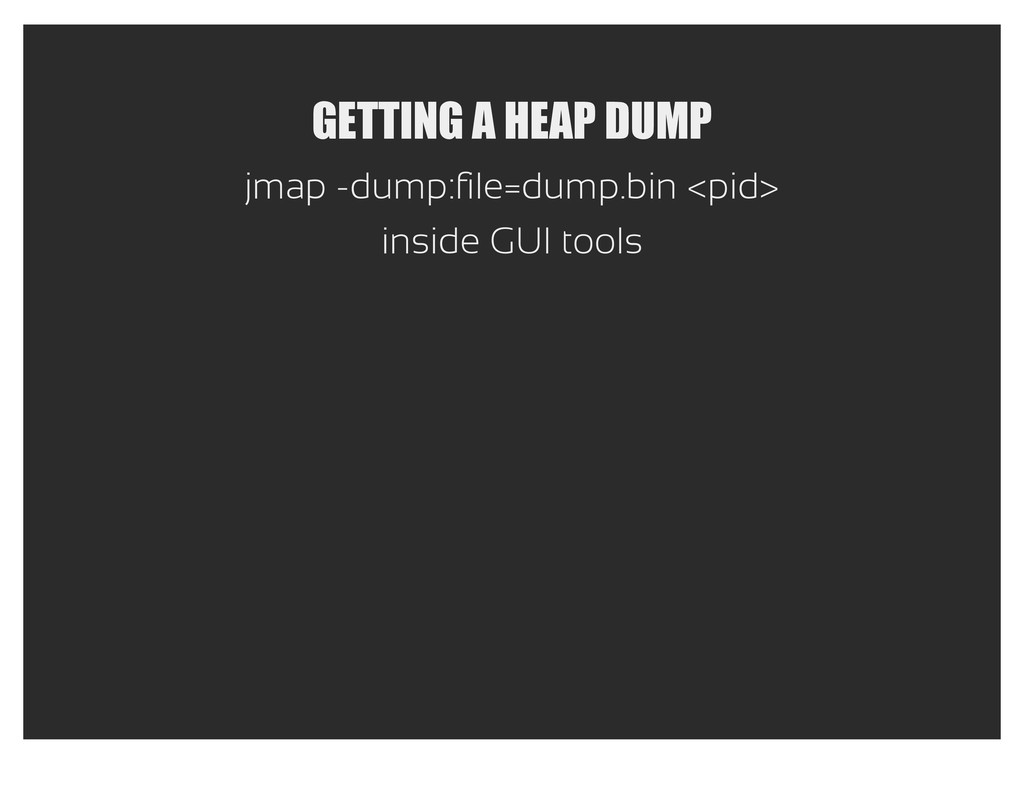
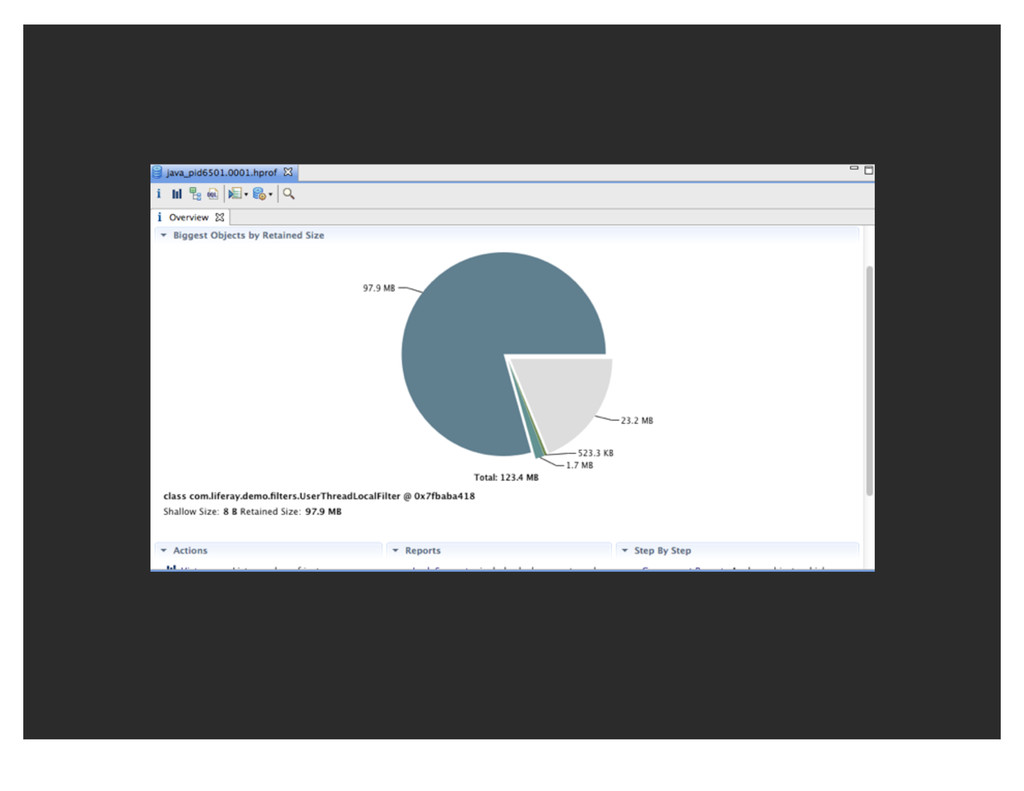
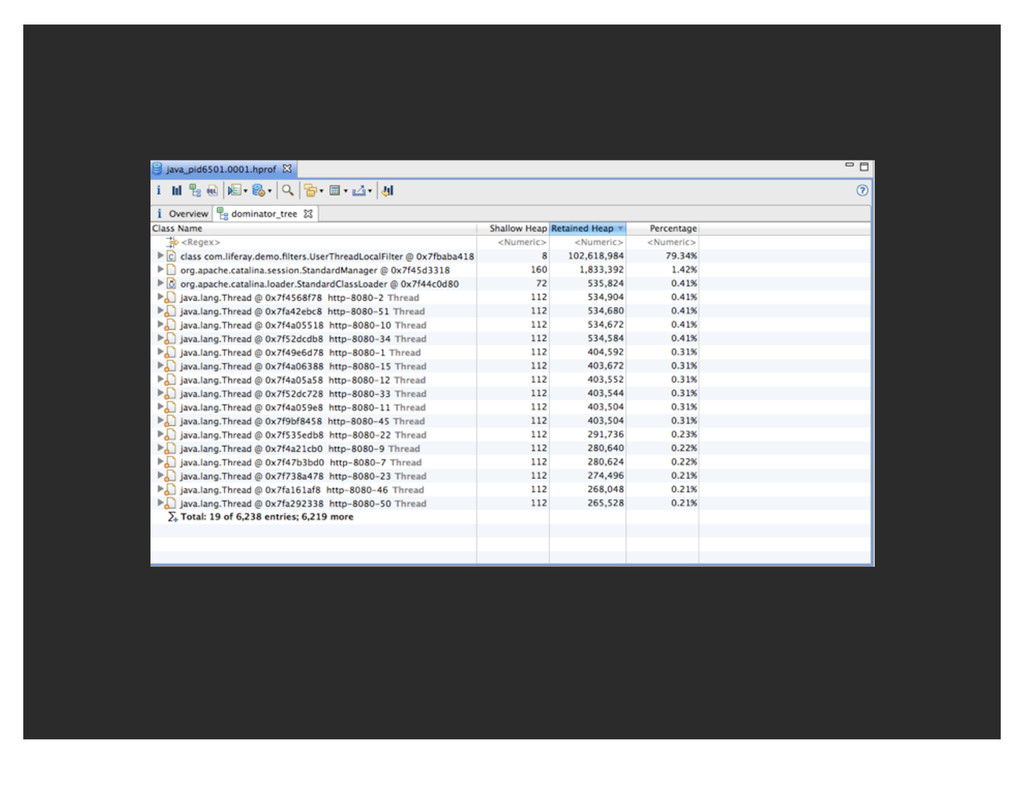
Never had a memory issue in Java? Consider yourself lucky. Unfortunately Garbage Collection can't solvle all your problems. There are many things that can cause your application to have memory issues.

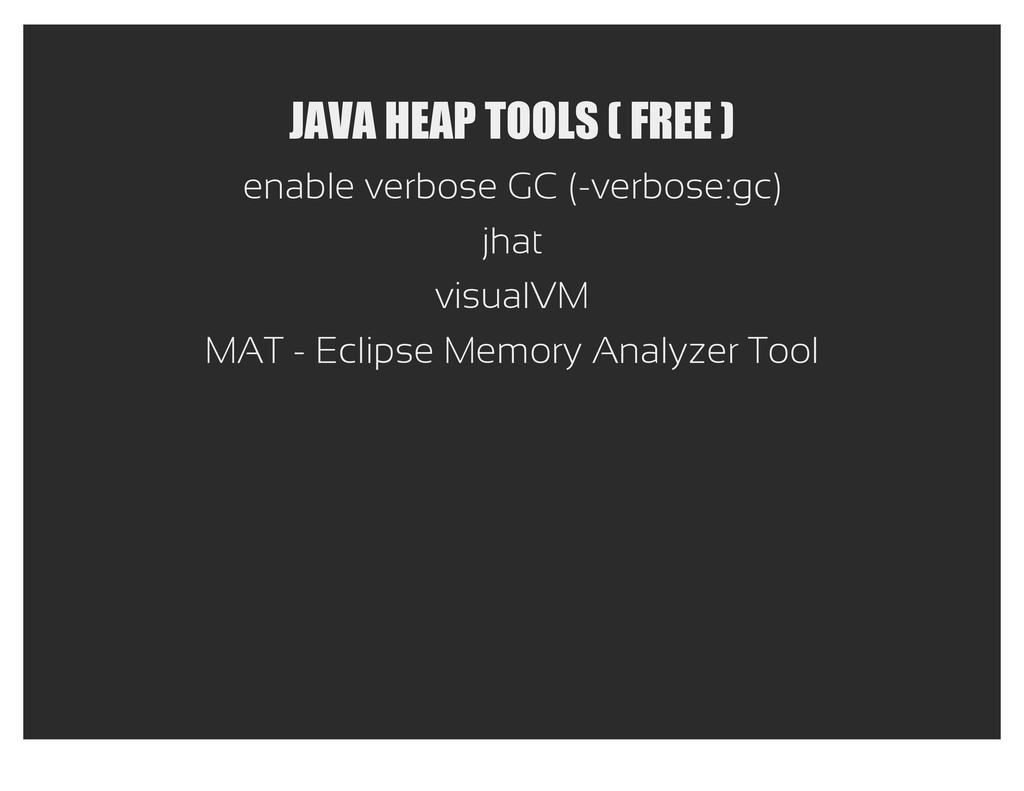
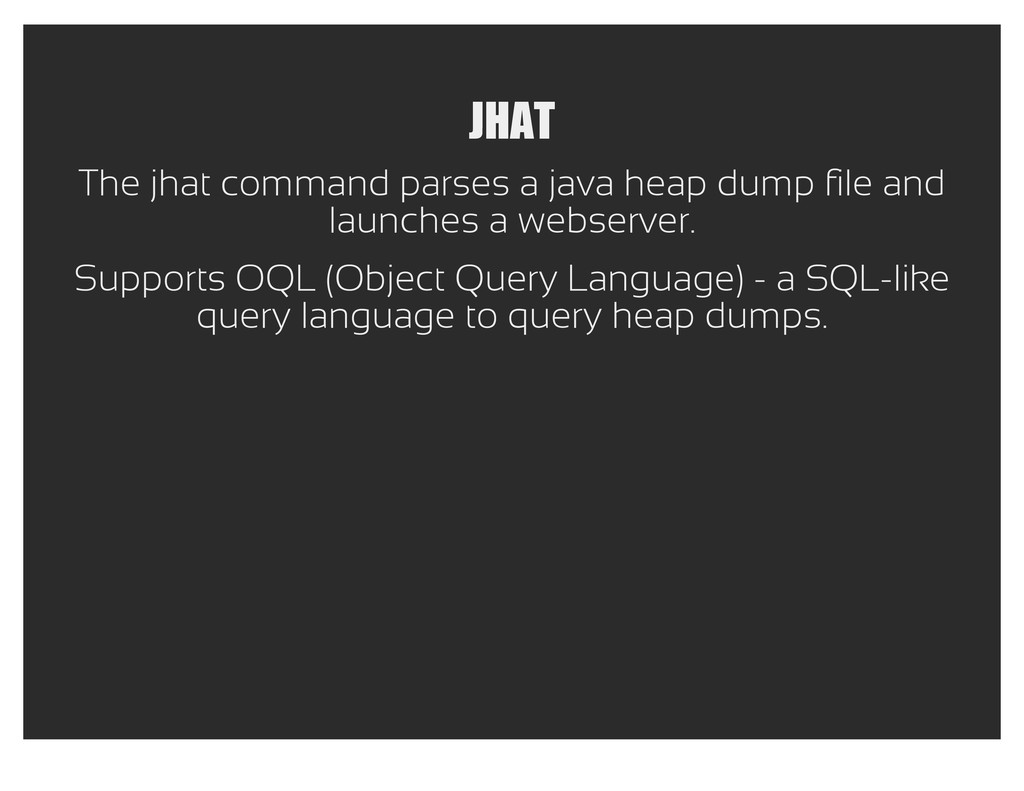
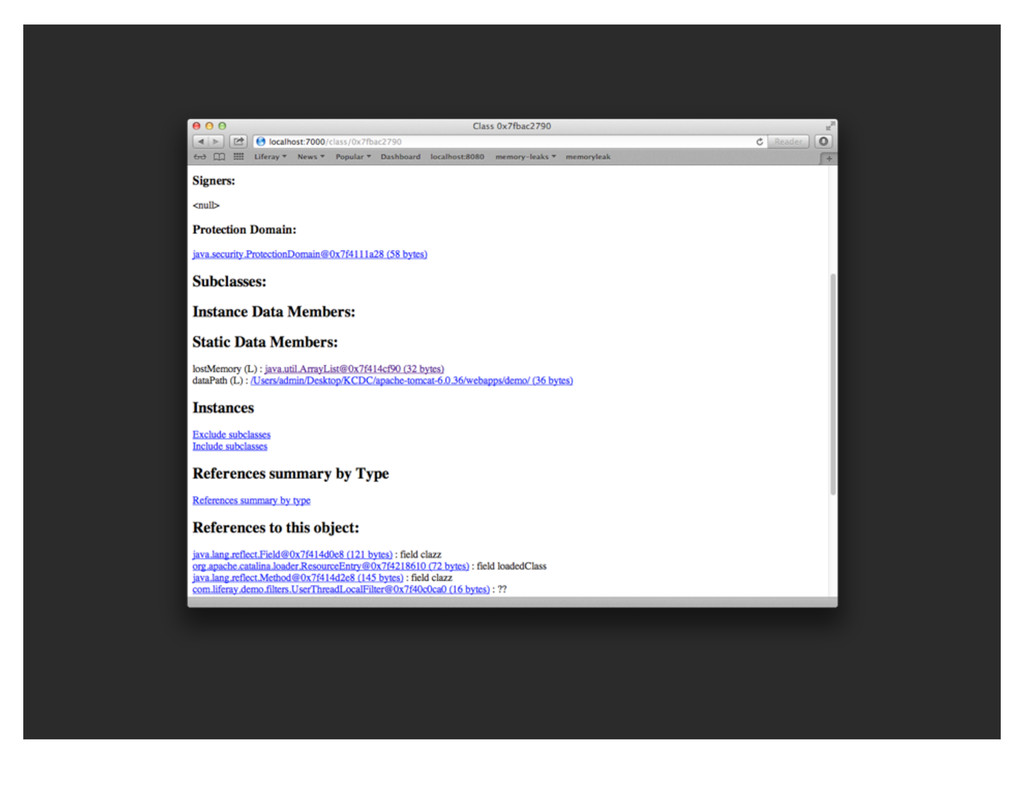
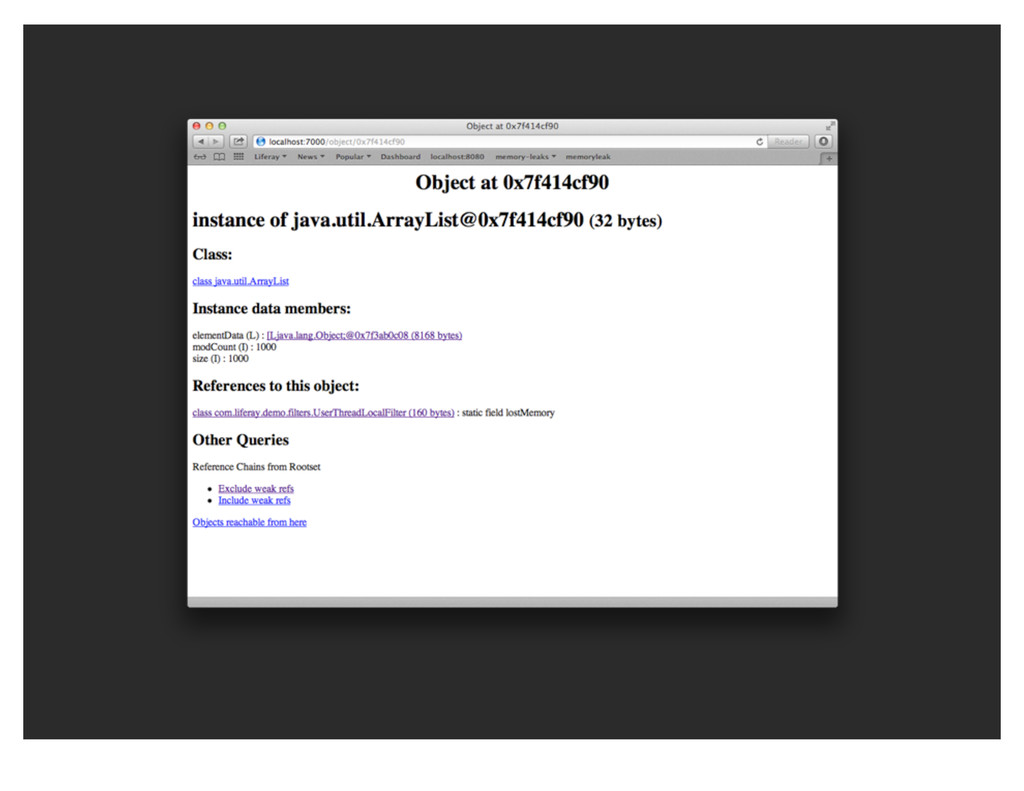
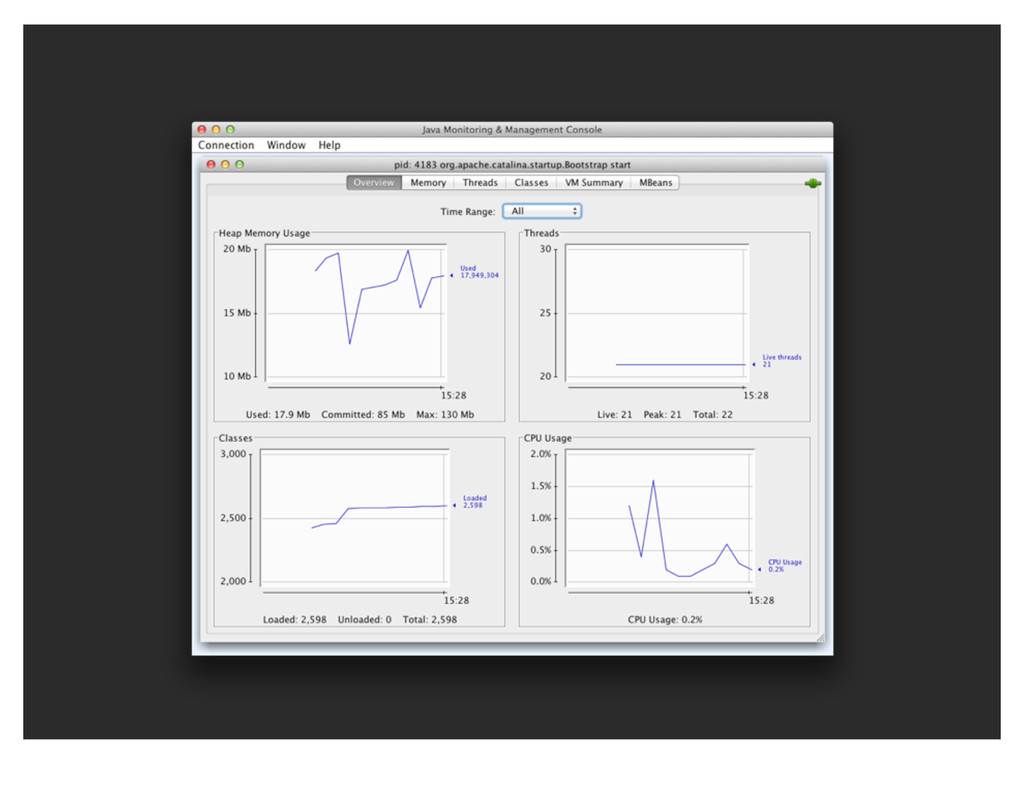
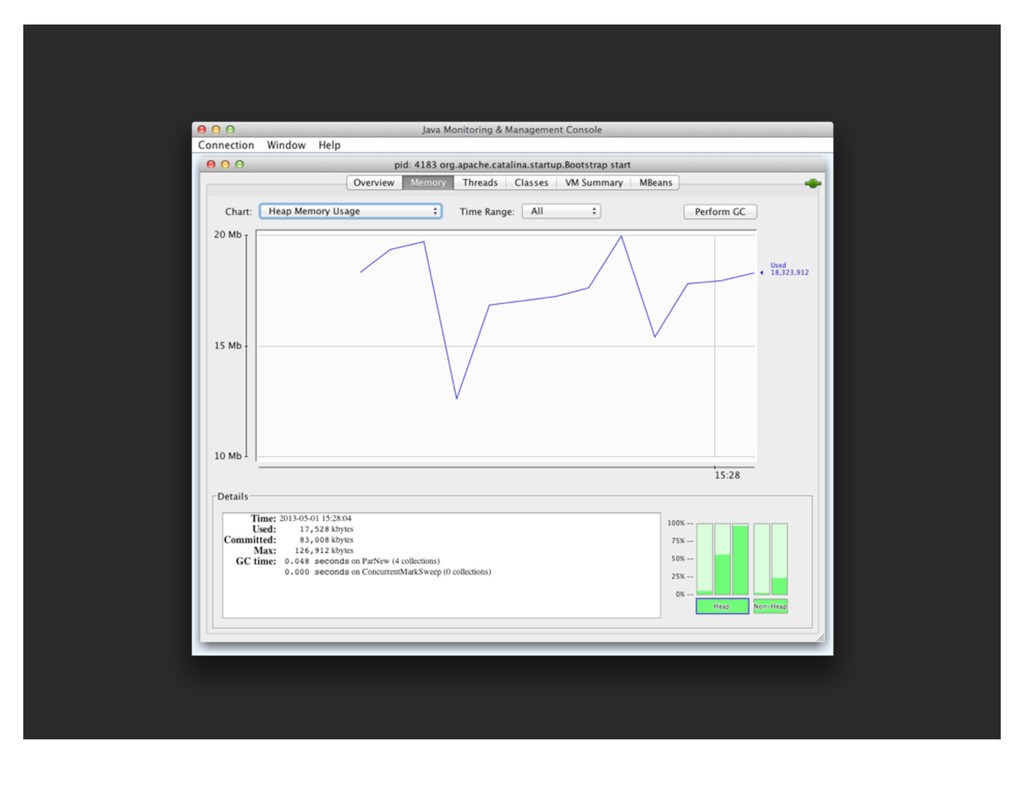
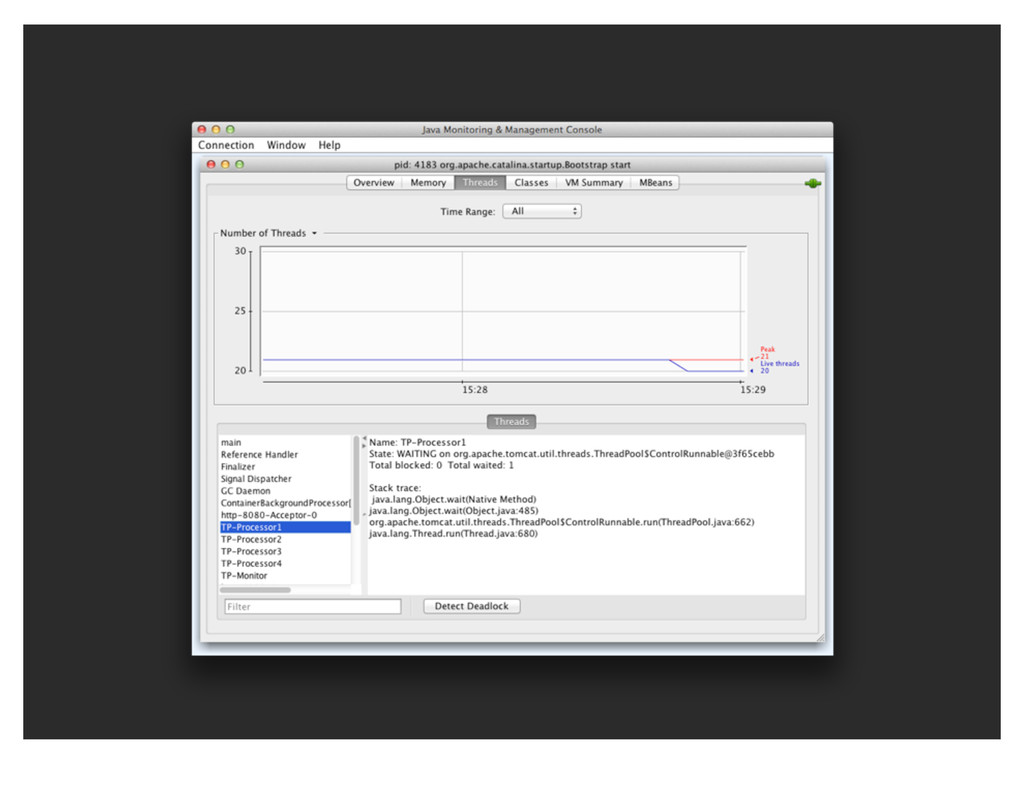
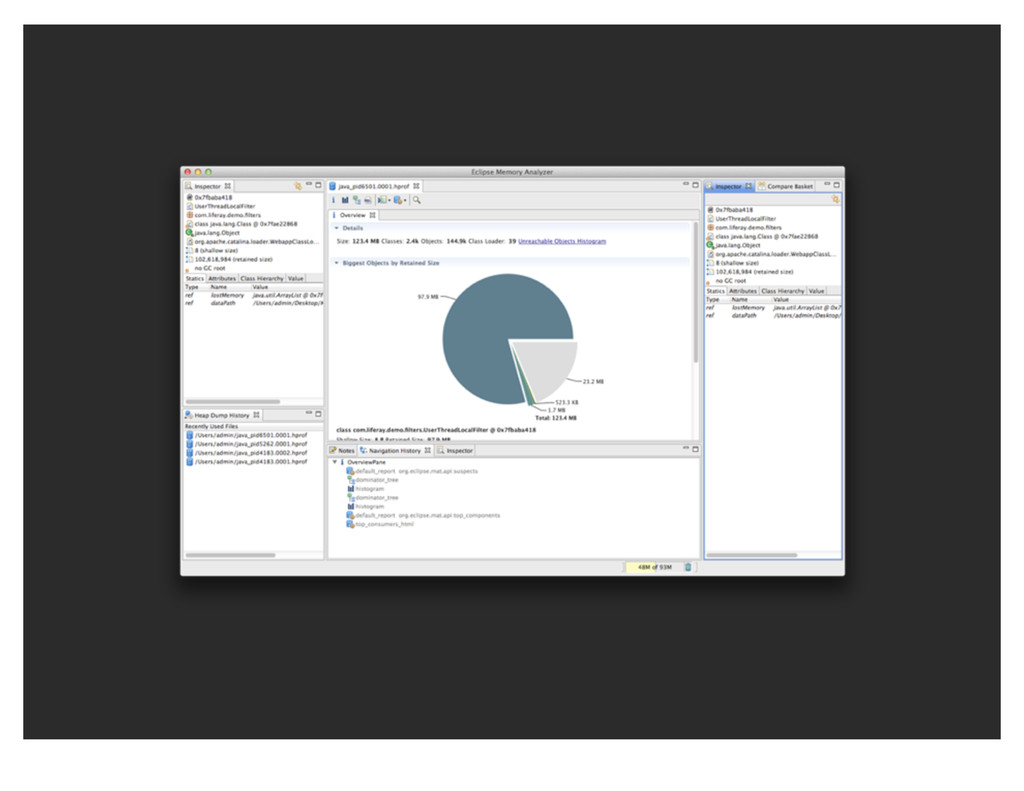
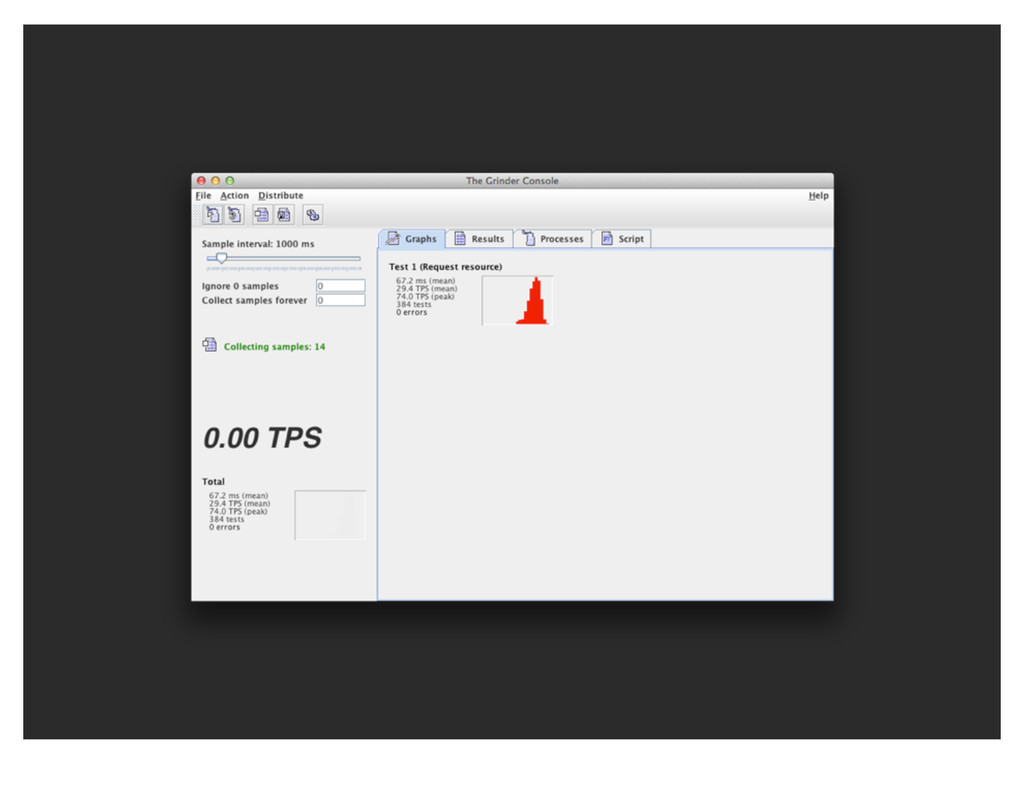
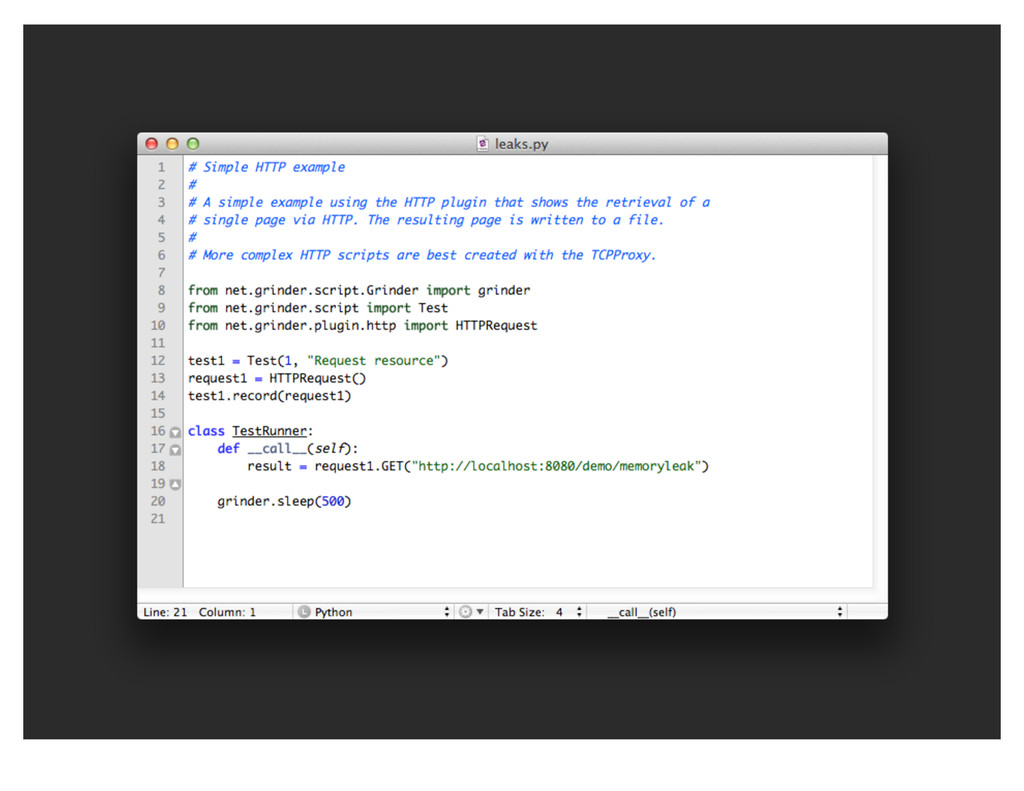
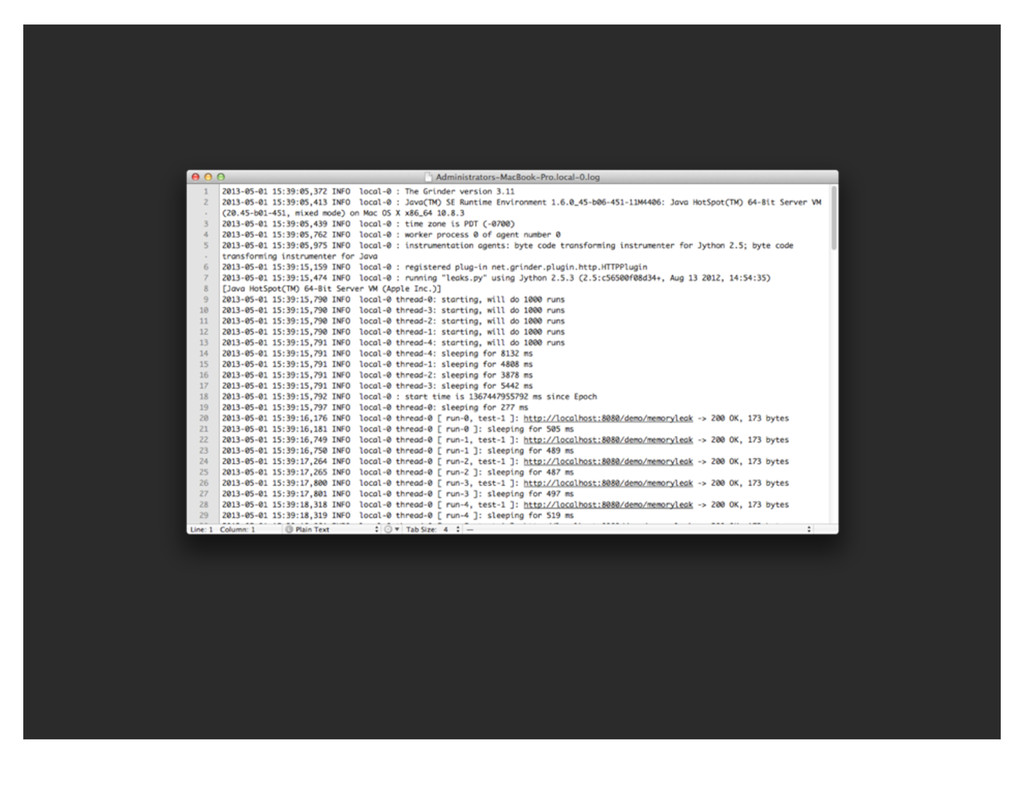
In this session we'll take a look at free tools like the Eclipse Memory Analyzer Tool (MAT), JConsole/JMX and VisualVM/VisualGC that you can use to help identify those memory issues. I'll also be using a few of these tools in a live demonstration of finding the cause of a memory leak in code.

Barrie Selack

May 03, 2013
Tweet

More Decks by Barrie Selack

Other Decks in Programming

Transcript

  1. FIND YOUR APPLICATION PID FIND YOUR APPLICATION PID jps -lv

    jps -lv 5273 sun.tools.jps.Jps - 5273 sun.tools.jps.Jps - Dapplication.home=/System/Library/Java/JavaVirtualMachines/1.6.0.jdk/Contents/Home -Xms8m Dapplication.home=/System/Library/Java/JavaVirtualMachines/1.6.0.jdk/Contents/Home -Xms8m 5237 5237 -Dosgi.requiredJavaVersion=1.5 -Dhelp.lucene.tokenizer=standard -XstartOnFirstThread - -Dosgi.requiredJavaVersion=1.5 -Dhelp.lucene.tokenizer=standard -XstartOnFirstThread - Dorg.eclipse.swt.internal.carbon.smallFonts -XX:MaxPermSize=256m -Xms40m -Xmx512m - Dorg.eclipse.swt.internal.carbon.smallFonts -XX:MaxPermSize=256m -Xms40m -Xmx512m - Xdock:icon=../Resources/Eclipse.icns -XstartOnFirstThread -Dorg.eclipse.swt.internal.carbon.smallFonts Xdock:icon=../Resources/Eclipse.icns -XstartOnFirstThread -Dorg.eclipse.swt.internal.carbon.smallFonts 5262 org.apache.catalina.startup.Bootstrap -Dcatalina.base=/Users/admin/Desktop/KCDC/apache- 5262 org.apache.catalina.startup.Bootstrap -Dcatalina.base=/Users/admin/Desktop/KCDC/apache- tomcat-6.0.36 -Dcatalina.home=/Users/admin/Desktop/KCDC/apache-tomcat-6.0.36 - tomcat-6.0.36 -Dcatalina.home=/Users/admin/Desktop/KCDC/apache-tomcat-6.0.36 - Dwtp.deploy=/Users/admin/Desktop/KCDC/apache-tomcat-6.0.36/webapps - Dwtp.deploy=/Users/admin/Desktop/KCDC/apache-tomcat-6.0.36/webapps - Djava.endorsed.dirs=/Users/admin/Desktop/KCDC/apache-tomcat-6.0.36/endorsed - Djava.endorsed.dirs=/Users/admin/Desktop/KCDC/apache-tomcat-6.0.36/endorsed - Dfile.encoding=MacRoman Dfile.encoding=MacRoman
  2. FIND YOUR APPLICATION PID FIND YOUR APPLICATION PID jps -l

    jps -l 5274 sun.tools.jps.Jps 5274 sun.tools.jps.Jps 5237 5237 5262 org.apache.catalina.startup.Bootstrap 5262 org.apache.catalina.startup.Bootstrap
  3. JAVA HEAP TOOLS ( FREE ) JAVA HEAP TOOLS (

    FREE ) enable verbose GC (-verbose:gc) jhat visualVM MAT - Eclipse Memory Analyzer Tool
  4. JHAT JHAT The jhat command parses a java heap dump

    file and The jhat command parses a java heap dump file and launches a webserver. launches a webserver. Supports OQL (Object Query Language) - a SQL-like Supports OQL (Object Query Language) - a SQL-like query language to query heap dumps. query language to query heap dumps.
  5. VISUALVM VISUALVM VisualVM is a visual tool integrating several VisualVM

    is a visual tool integrating several commandline JDK tools and lightweight profiling commandline JDK tools and lightweight profiling capabilities. capabilities. Designed for both production and development time Designed for both production and development time use, it further enhances the capability of monitoring use, it further enhances the capability of monitoring and performance analysis for the Java SE platform and performance analysis for the Java SE platform
  6. MAT - ECLIPSE MEMORY ANALYZER TOOL MAT - ECLIPSE MEMORY

    ANALYZER TOOL The Eclipse Memory Analyzer is a fast and feature- The Eclipse Memory Analyzer is a fast and feature- rich Java heap analyzer that helps you find memory rich Java heap analyzer that helps you find memory leaks and reduce memory consumption. leaks and reduce memory consumption. Supports OQL (Object Query Language) - a SQL-like Supports OQL (Object Query Language) - a SQL-like query language to query heap dumps. query language to query heap dumps.
  7. THE GRINDER, A JAVA LOAD TESTING FRAMEWORK THE GRINDER, A

    JAVA LOAD TESTING FRAMEWORK The Grinder is a Java load testing framework that The Grinder is a Java load testing framework that makes it easy to run a distributed test using many makes it easy to run a distributed test using many load injector machines. load injector machines.