Upgrade to Pro — share decks privately, control downloads, hide ads and more …

Manipulating financial data in Python

Buzzvil
November 18, 2020

Manipulating financial data in Python

By Harry

Buzzvil

November 18, 2020
Tweet

More Decks by Buzzvil

Other Decks in Programming

Transcript

  1. TABLE OF CONTENTS Introduction Processing Stock Data 01 02 03

    04 Using Processed Stock Data Conclusions
  2. About this Presentation How to process historical financial data using

    Python Example usages of processed stock data
  3. Useful Python Libraries for Finance “A fast, powerful, flexible and

    easy to use open source data analysis and manipulation tool” Pandas - read_csv() - DataFrame - joining and slicing dataframes
  4. Useful Python Libraries for Finance NumPy “Powerful N-Dimensional Arrays” “Numerical

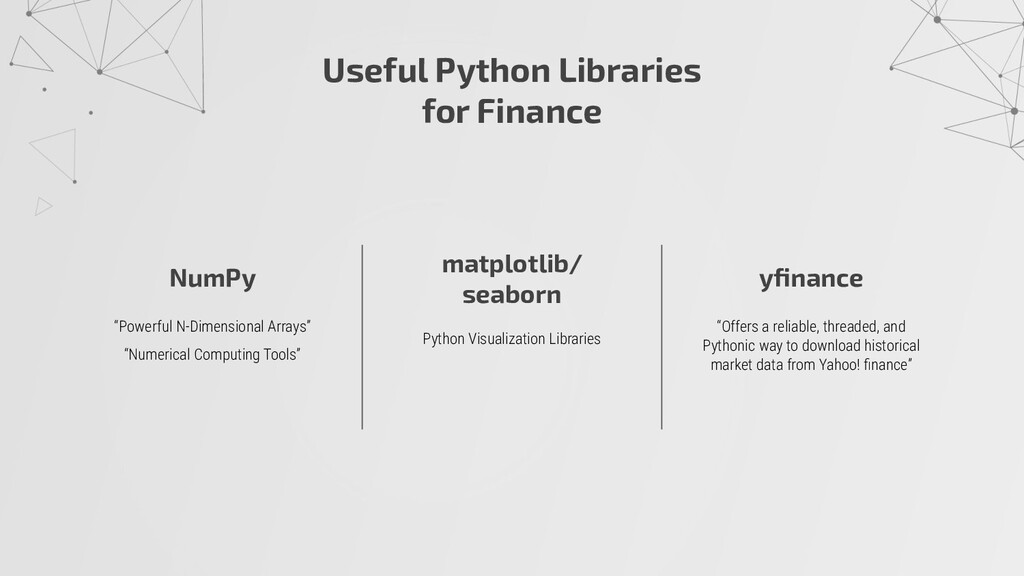
    Computing Tools” matplotlib/ seaborn yfinance “Offers a reliable, threaded, and Pythonic way to download historical market data from Yahoo! finance” Python Visualization Libraries
  5. Combining Multiple Stock Data Find Important Statistical Values Performing Statistical

    Analysis Plotting Multiple Stocks Compare Stocks in a Intuitive Way Portfolio Optimization Find the Best Proportions of Stocks to Own
  6. Problem #1. Trading Days Step 1 Create an empty DataFrame

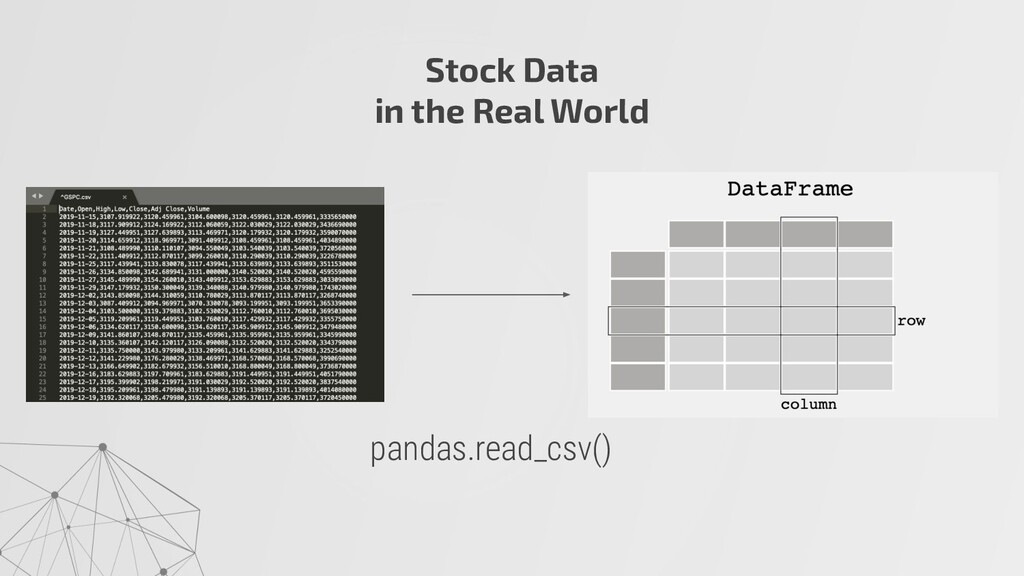
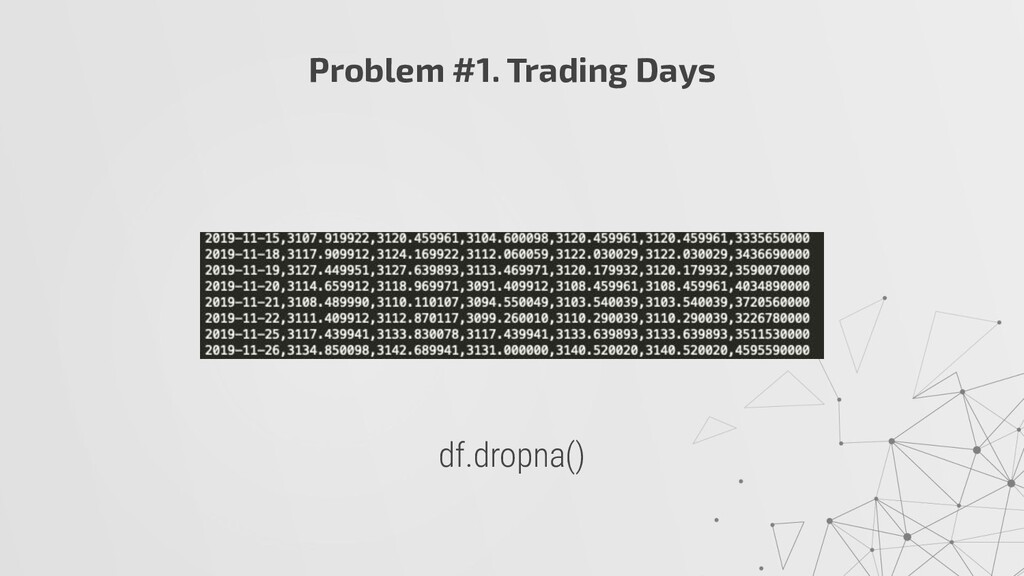
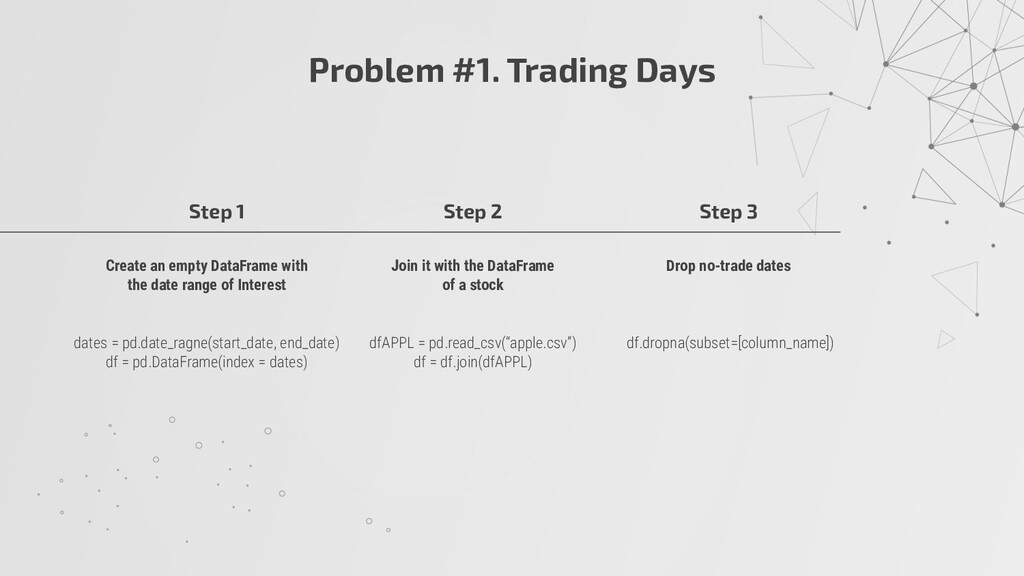
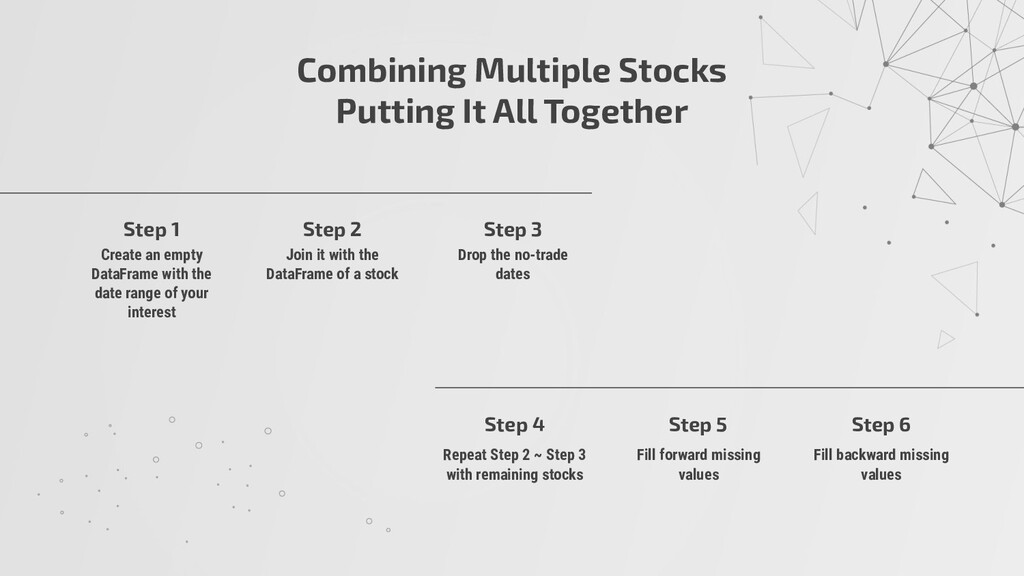
    with the date range of Interest dates = pd.date_ragne(start_date, end_date) df = pd.DataFrame(index = dates) Step 2 Join it with the DataFrame of a stock dfAPPL = pd.read_csv(“apple.csv”) df = df.join(dfAPPL) Step 3 Drop no-trade dates df.dropna(subset=[column_name])
  7. Problem #2. Incomplete Data What if a stock is no

    longer traded? What if a new stock share began trading recently? JAVA TSLA
  8. Combining Multiple Stocks Putting It All Together Step 1 Create

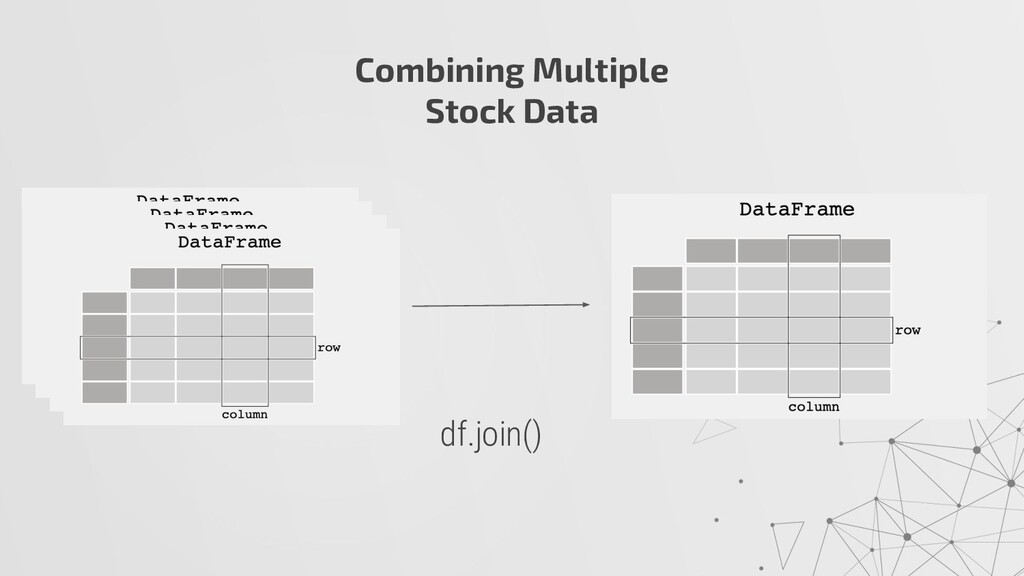
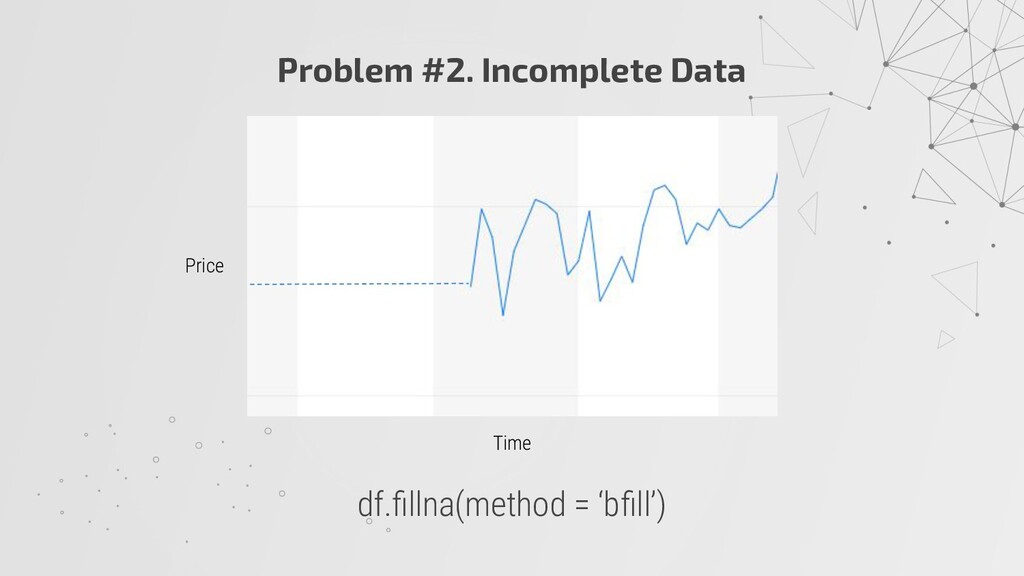
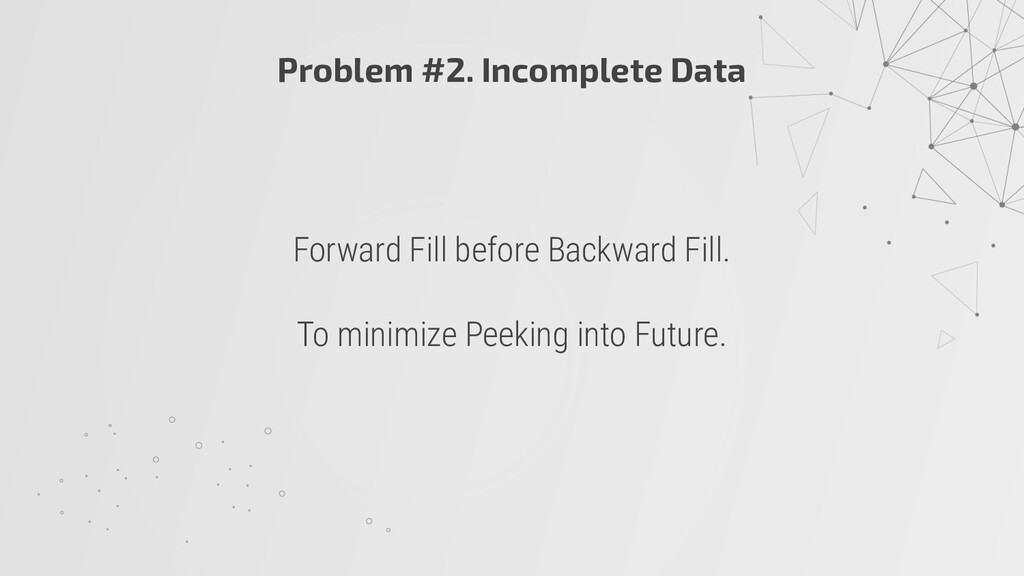
    an empty DataFrame with the date range of your interest Step 2 Join it with the DataFrame of a stock Step 3 Drop the no-trade dates Step 4 Repeat Step 2 ~ Step 3 with remaining stocks Step 5 Fill forward missing values Step 6 Fill backward missing values
  9. Assumption GOOGL APPL TSLA 2000.xx.xx price 1 price 5 price

    9 2000.xx.xx price 2 price 6 price 10 2000.xx.xx price 3 price 7 price 11 2000.xx.xx price 4 price 8 price 12 Combined DataFrame
  10. Computing Financial Statistics Sharpe Ratio (return of portfolio - risk-free

    rate) / std of portfolio ex) 1.43, 0.74 Simply put, a metric for risk-adjusted return
  11. Portfolio Optimization “The process of selecting the best portfolio (asset

    allocation), out of the set of all portfolios being considered, according to some objective.”
  12. Portfolio Optimization What should be the objective function to minimize?

    -1 * Cumulative Return -1 * Sharpe Ratio (risk-adjusted return)
  13. Portfolio Optimization Find the ‘x’ to minimize f(x) = -1

    * Sharpe Ratio scipy.optimize.minimize()
  14. How to utilize some Python libraries for Finance Problems with

    stock data and how to solve them Example usages of processed stock data Takeaways
  15. CREDITS: This presentation template was created by Slidesgo, including icons

    by Flaticon, and infographics & images by Freepik. Please keep this slide for attribution. Does anyone have any questions? THANKS