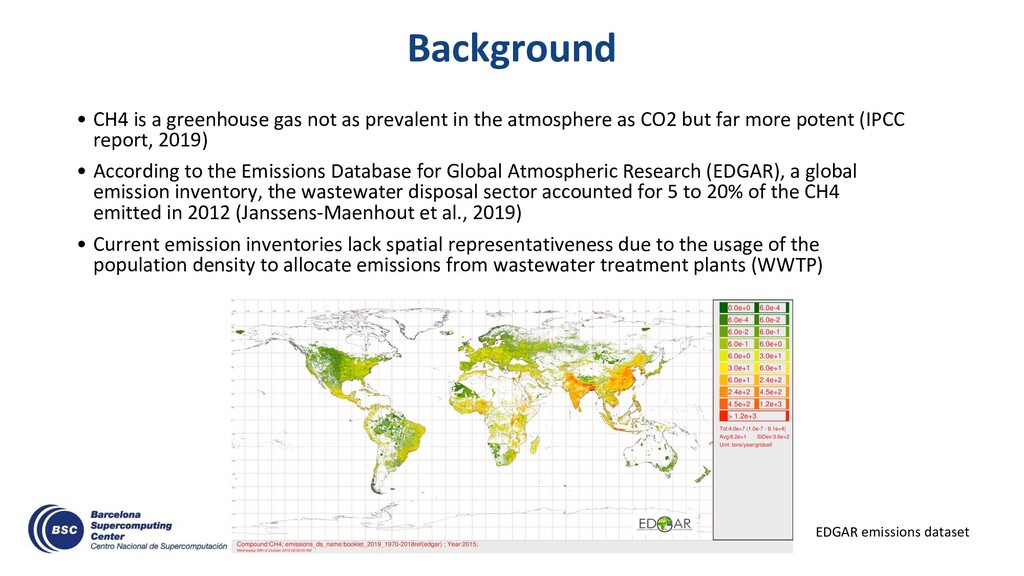
in the atmosphere as CO2 but far more potent (IPCC report, 2019) • According to the Emissions Database for Global Atmospheric Research (EDGAR), a global emission inventory, the wastewater disposal sector accounted for 5 to 20% of the CH4 emitted in 2012 (Janssens-Maenhout et al., 2019) • Current emission inventories lack spatial representativeness due to the usage of the population density to allocate emissions from wastewater treatment plants (WWTP) EDGAR emissions dataset
for the identification and localization of Spanish CH4 emission sources, with a focus on WWTPs • Using European Space Agency images from the Sentinel-2 mission • Design a methodology that could be applied to other geographical areas where the identification of emission sources is more scarce • Enhance the spatial representativeness of current emission inventories/databases
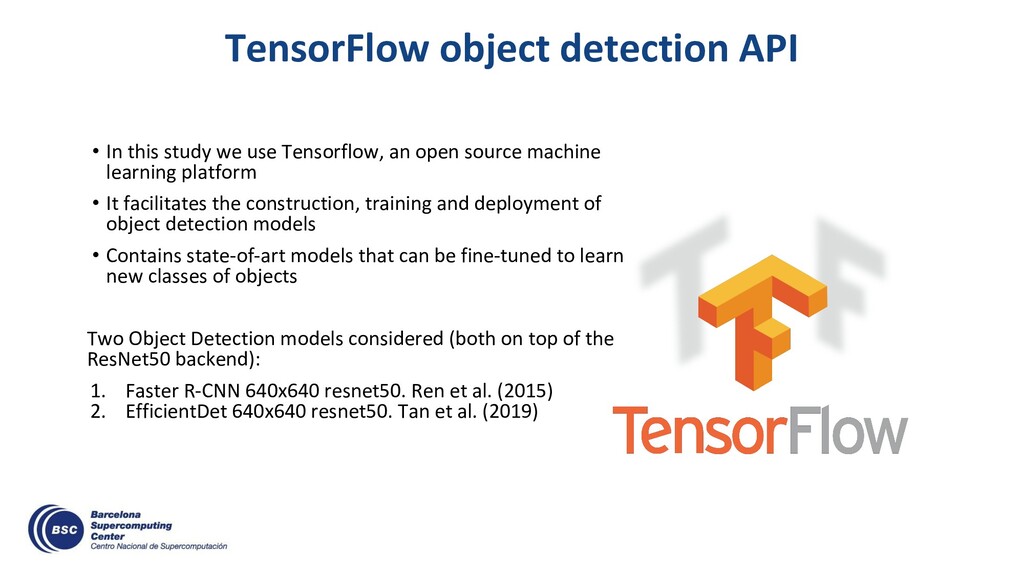
Tensorflow, an open source machine learning platform • It facilitates the construction, training and deployment of object detection models • Contains state-of-art models that can be fine-tuned to learn new classes of objects Two Object Detection models considered (both on top of the ResNet50 backend): 1. Faster R-CNN 640x640 resnet50. Ren et al. (2015) 2. EfficientDet 640x640 resnet50. Tan et al. (2019)
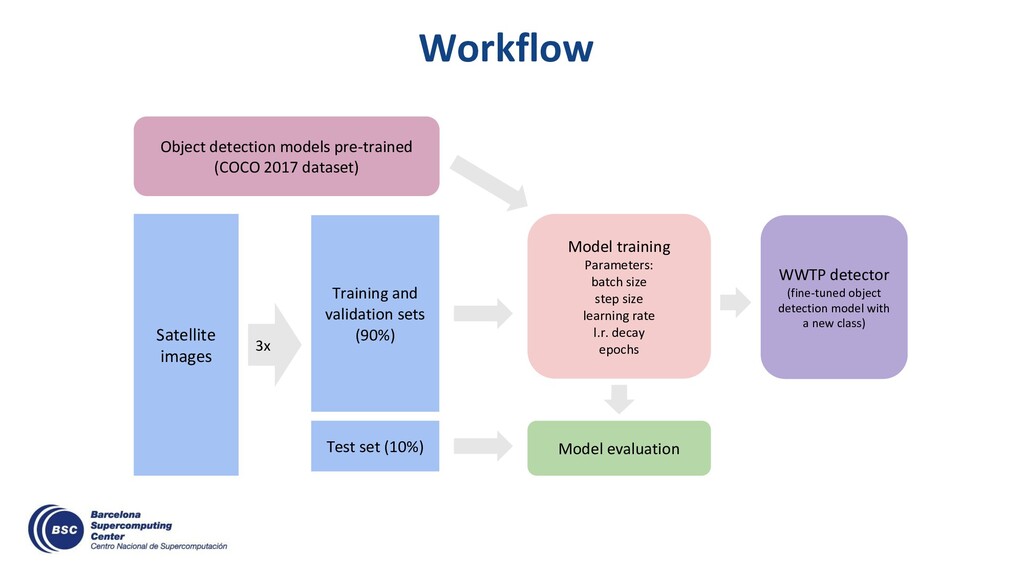
(10%) 3x Model training Parameters: batch size step size learning rate l.r. decay epochs WWTP detector (fine-tuned object detection model with a new class) Model evaluation Object detection models pre-trained (COCO 2017 dataset)
• 100 km x 100 km images • Earth imagery every 5 days • The characteristic size of the WWTP (meters to tens of meters) presents a challenge to the usage of Sentinel-2 images
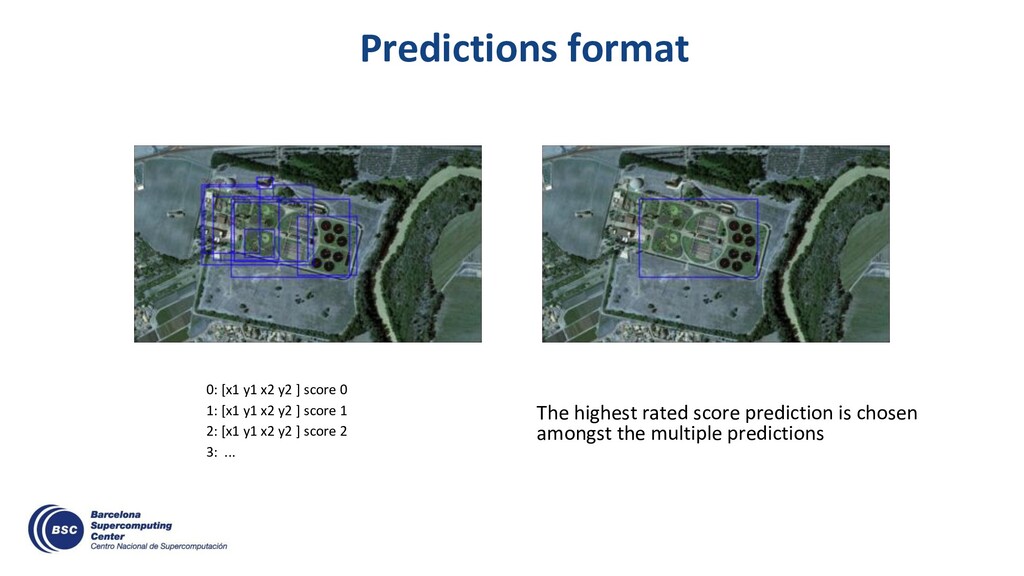
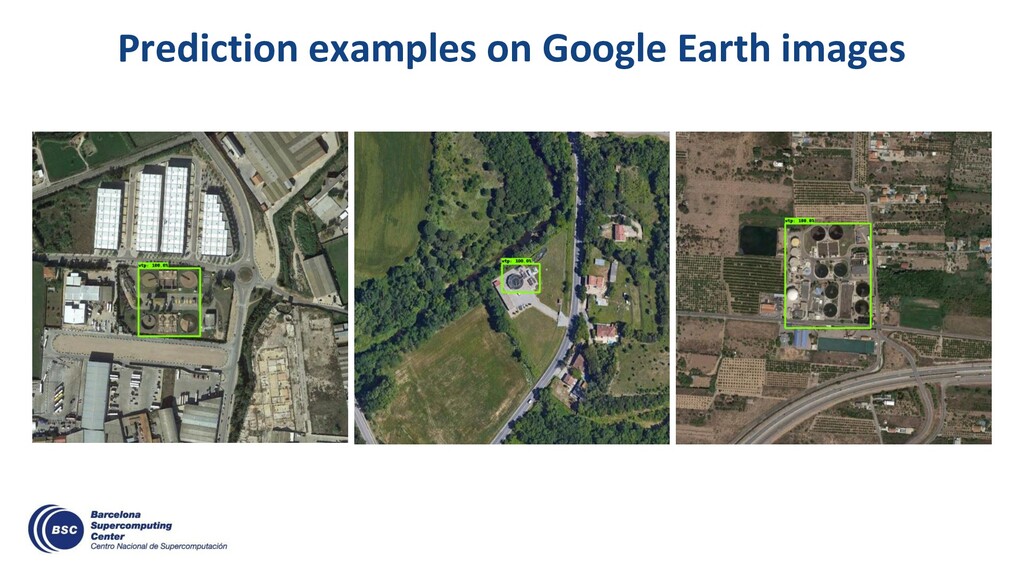
created containing the same WWTPs for a comparison with the Sentinel-2 counterpart. • Left: Sentinel-2 image (10 m resolution) • Right: Google Earth image (1 m resolution)
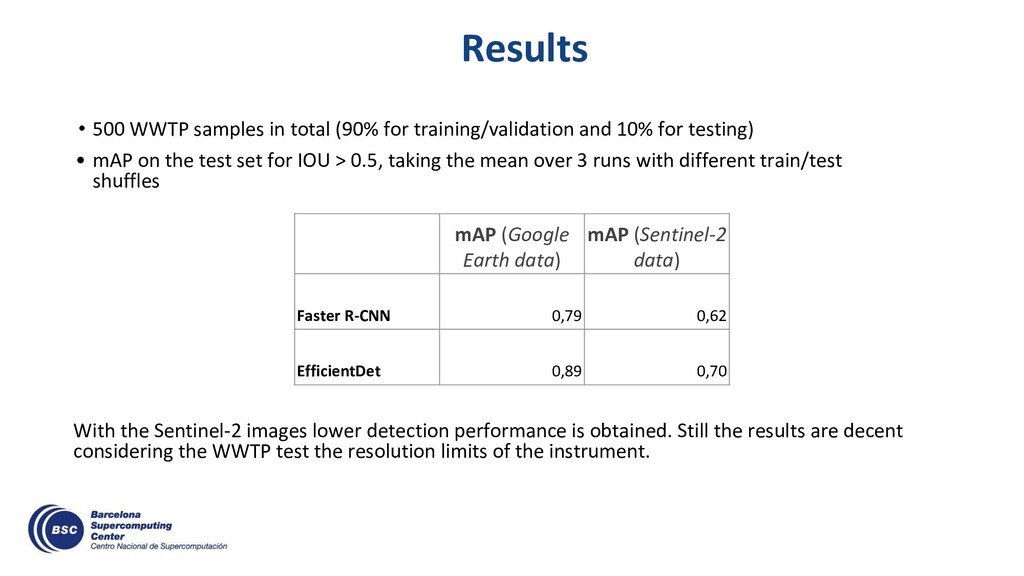
and 10% for testing) • mAP on the test set for IOU > 0.5, taking the mean over 3 runs with different train/test shuffles With the Sentinel-2 images lower detection performance is obtained. Still the results are decent considering the WWTP test the resolution limits of the instrument. mAP (Google Earth data) mAP (Sentinel-2 data) Faster R-CNN 0,79 0,62 EfficientDet 0,89 0,70
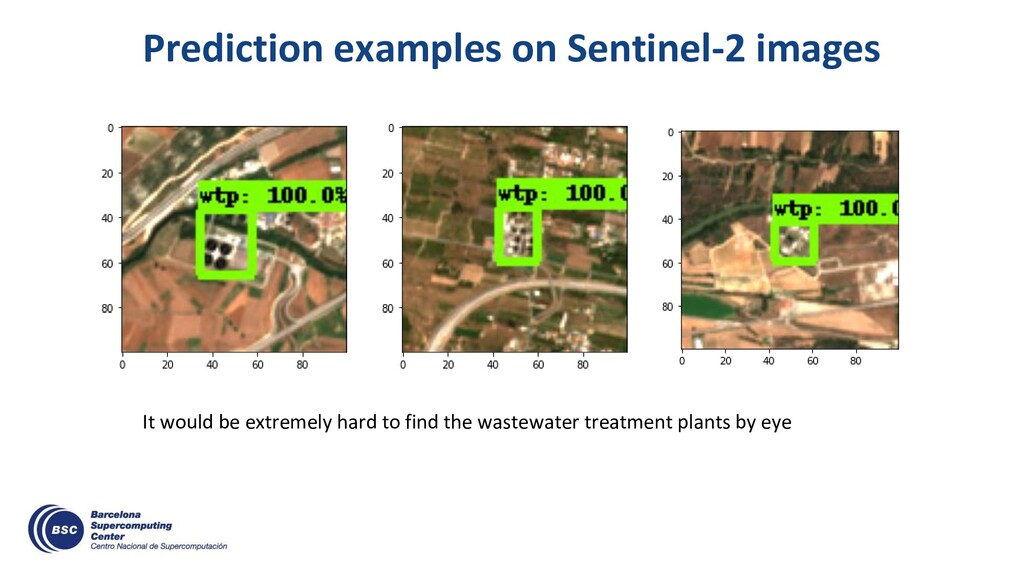
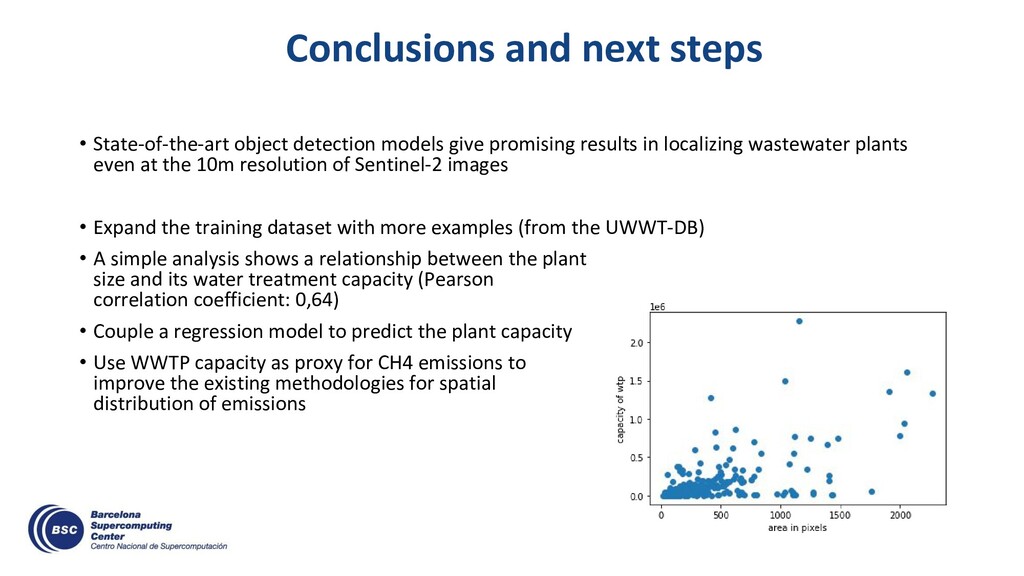
promising results in localizing wastewater plants even at the 10m resolution of Sentinel-2 images • Expand the training dataset with more examples (from the UWWT-DB) • A simple analysis shows a relationship between the plant size and its water treatment capacity (Pearson correlation coefficient: 0,64) • Couple a regression model to predict the plant capacity • Use WWTP capacity as proxy for CH4 emissions to improve the existing methodologies for spatial distribution of emissions
![Thank you [email protected] This study has been possible thanks to](https://files.speakerdeck.com/presentations/102b0a1793184c23be5aa9a7fe929c84/slide_18.jpg)