Great app • A screen with a list • With animations for every item within a list • Overlays • Transparencies • May change the order of the items with a drag gesture
for every item within a list, overlays, transparencies • Problems with views (tons of views), slow app • What to do? (I want to keep the user experience)
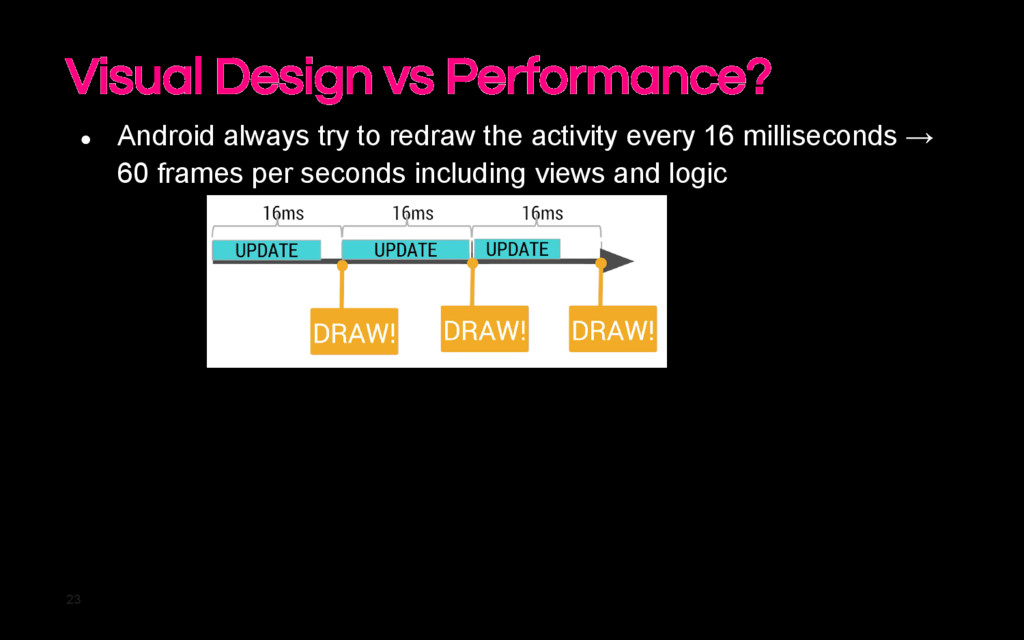
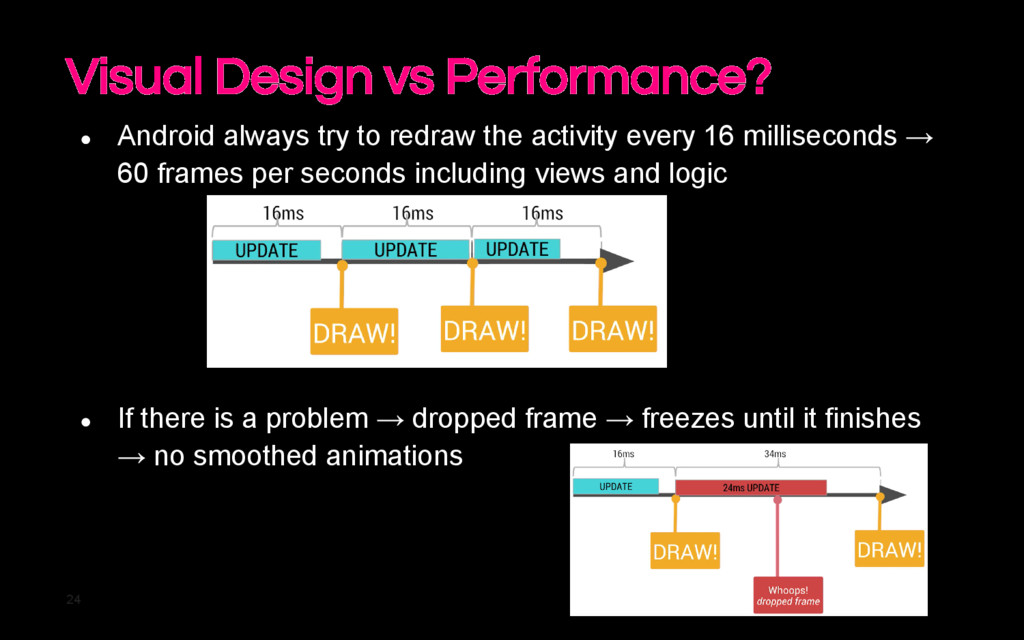
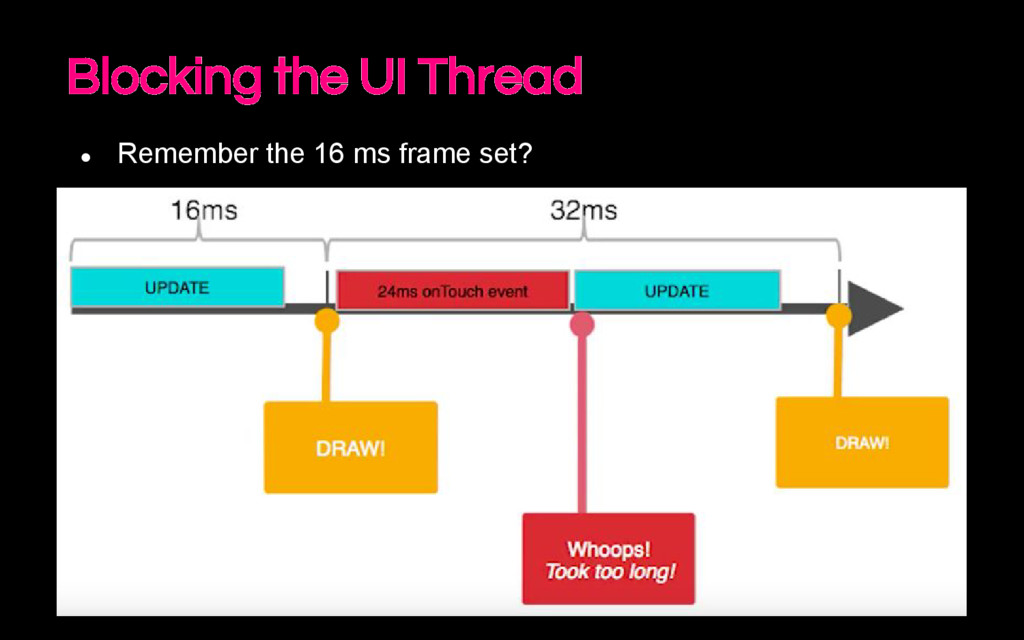
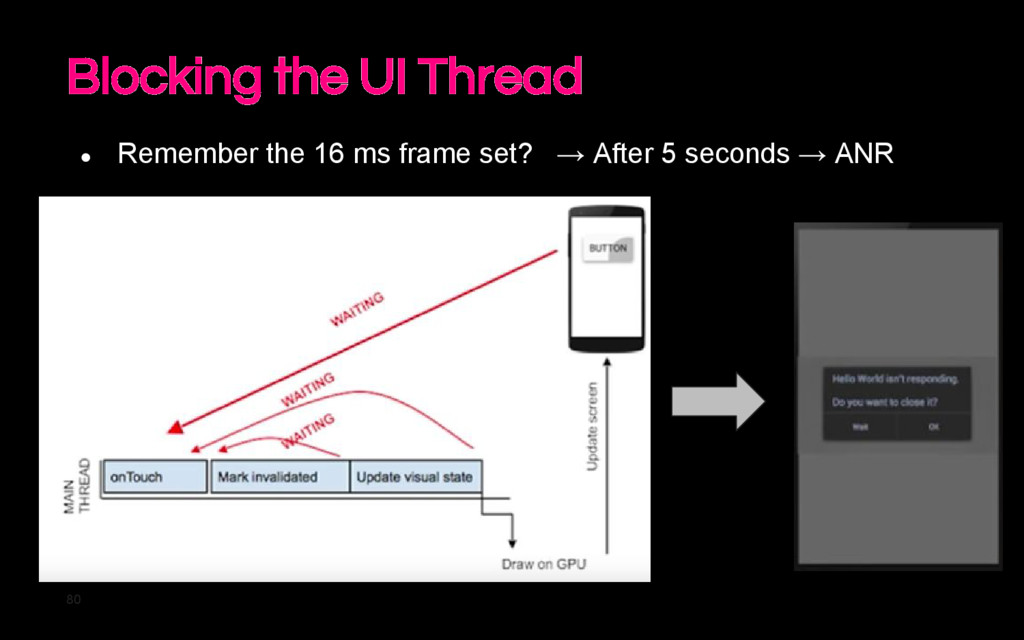
redraw the activity every 16 milliseconds → 60 frames per seconds including views and logic • If there is a problem → dropped frame → freezes until it finishes → no smoothed animations
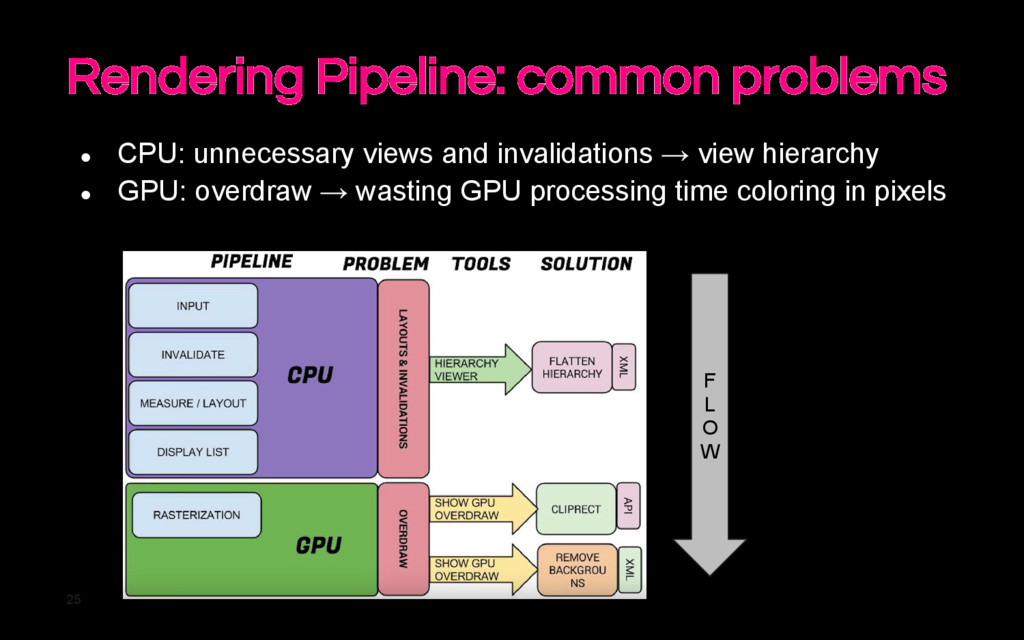
accelerates rasterization process → polygons and textures • CPU feeding the GPU • CPU + GPU using API OpenGL ES • All resources within an Android Theme are grouped into a single texture and then uploaded into the GPU (this types of views fast) • GPU bottleneck → overdraw
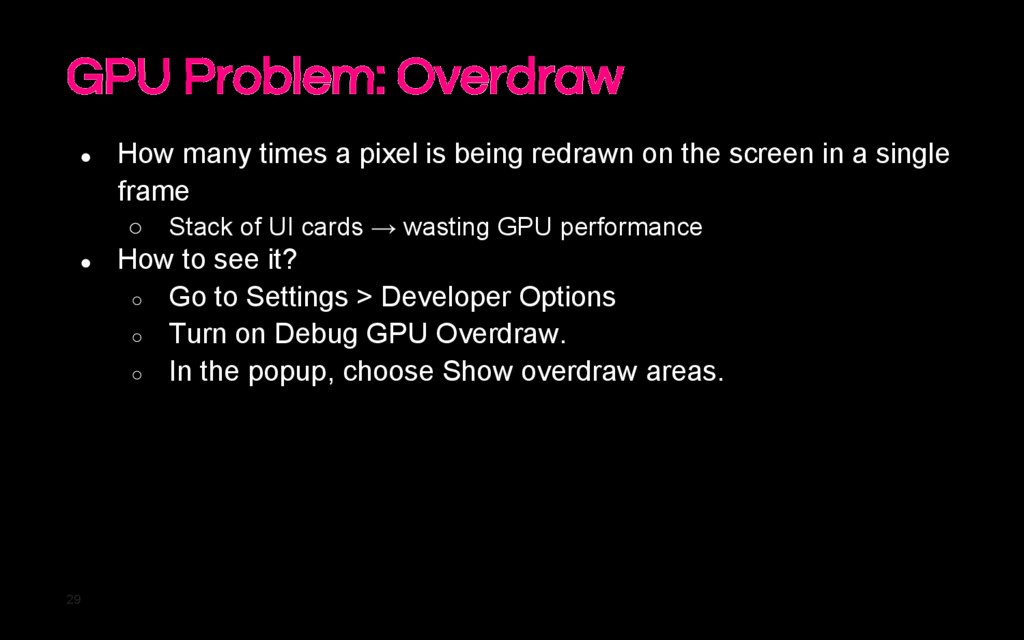
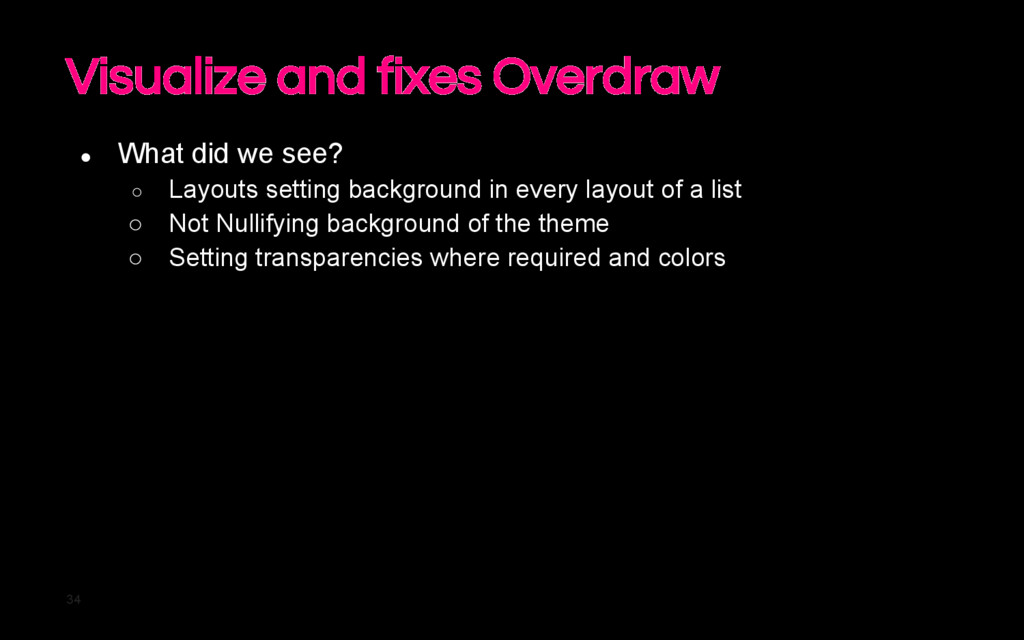
is being redrawn on the screen in a single frame ◦ Stack of UI cards → wasting GPU performance • How to see it? ◦ Go to Settings > Developer Options ◦ Turn on Debug GPU Overdraw. ◦ In the popup, choose Show overdraw areas.
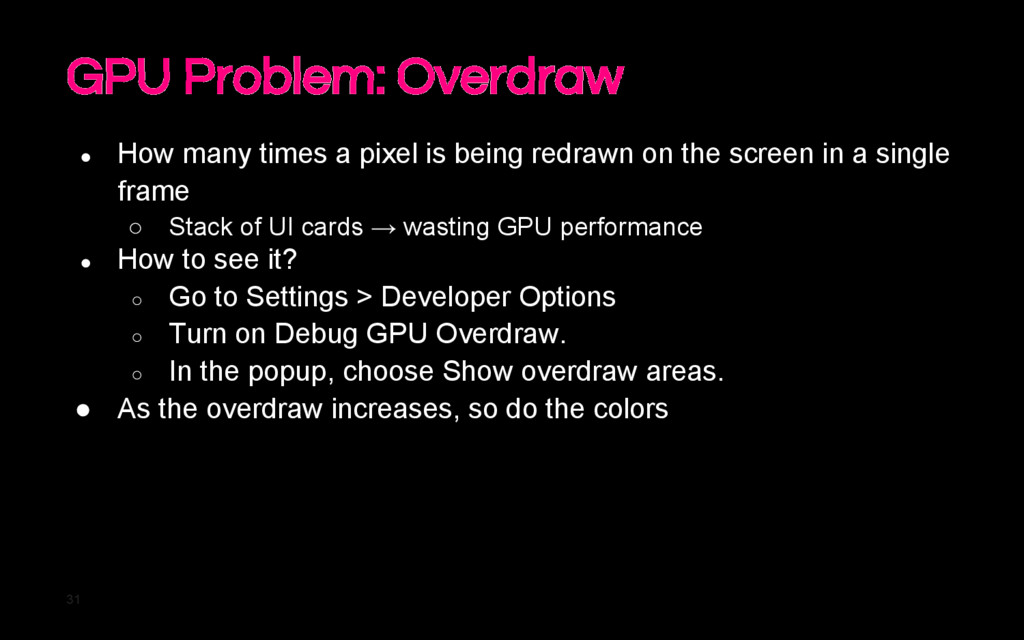
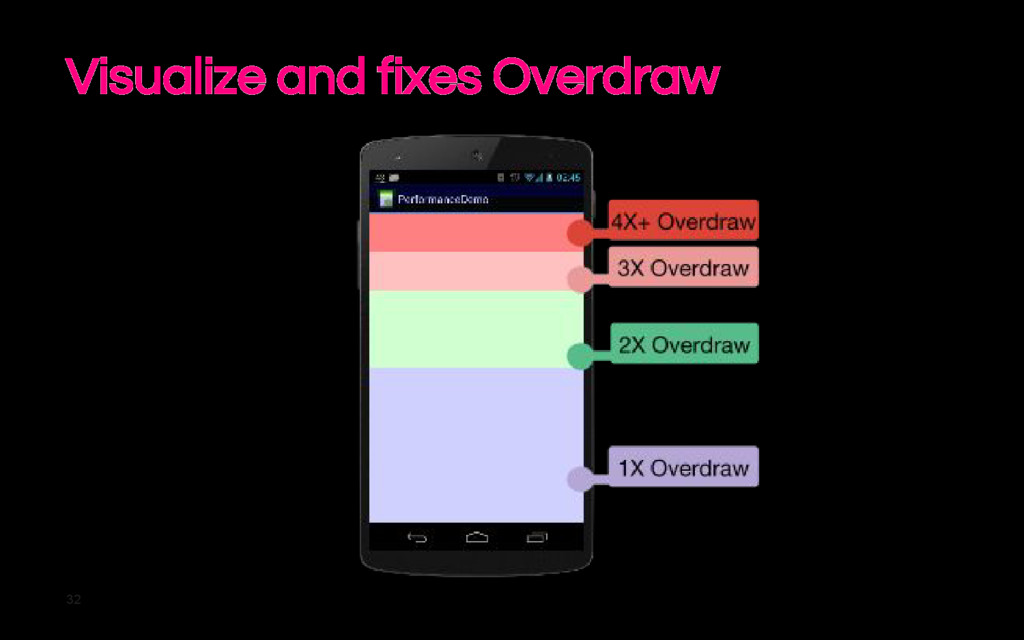
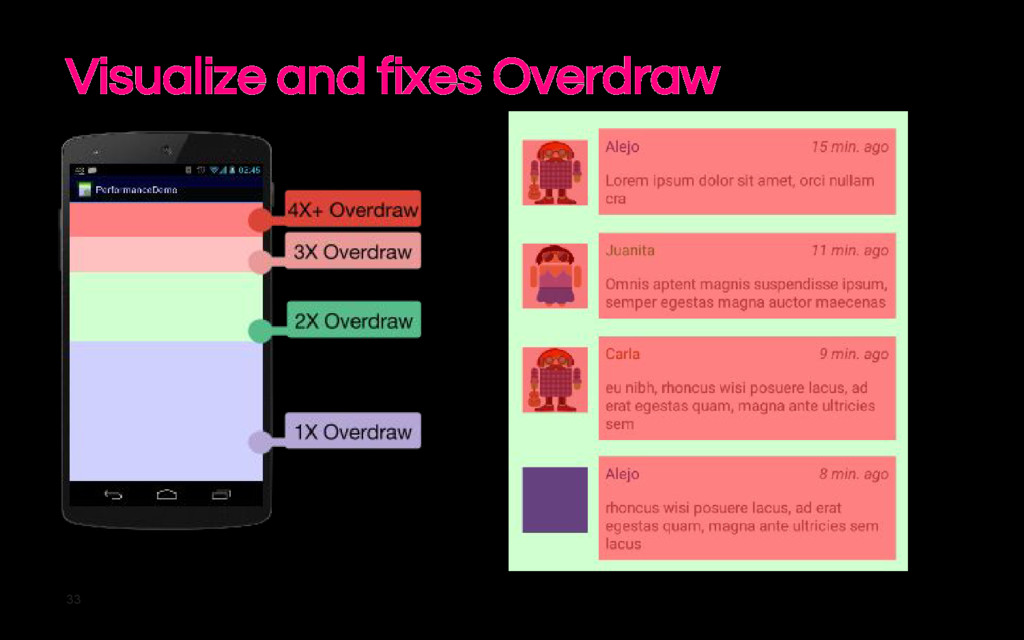
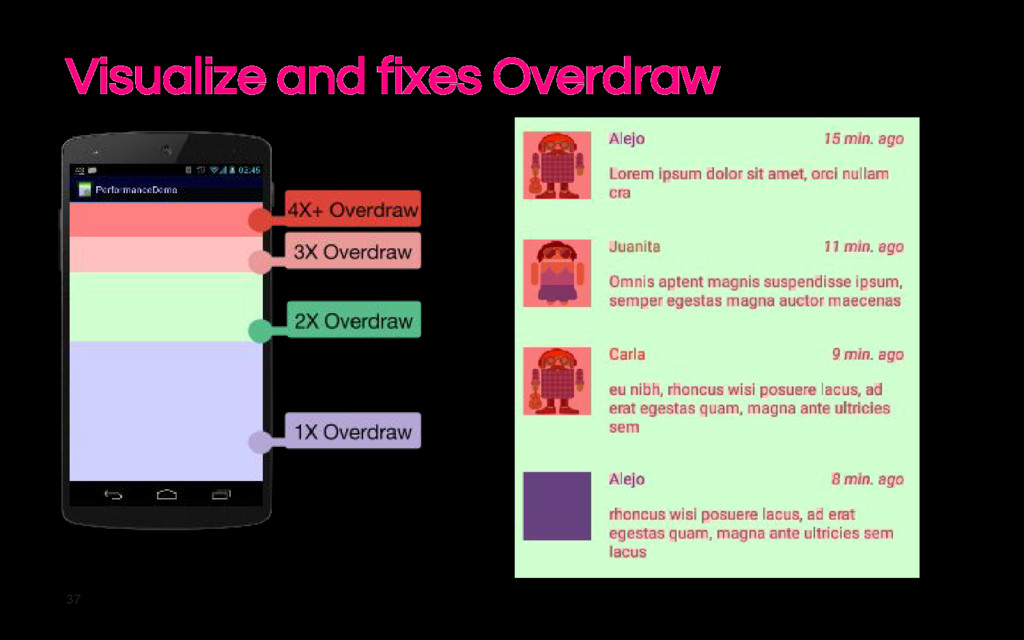
is being redrawn on the screen in a single frame ◦ Stack of UI cards → wasting GPU performance • How to see it? ◦ Go to Settings > Developer Options ◦ Turn on Debug GPU Overdraw. ◦ In the popup, choose Show overdraw areas. • As the overdraw increases, so do the colors
is being redrawn on the screen in a single frame ◦ Stack of UI cards → wasting GPU performance • How to see it? ◦ Go to Settings > Developer Options ◦ Turn on Debug GPU Overdraw. ◦ In the popup, choose Show overdraw areas. • As the overdraw increases, so do the colors
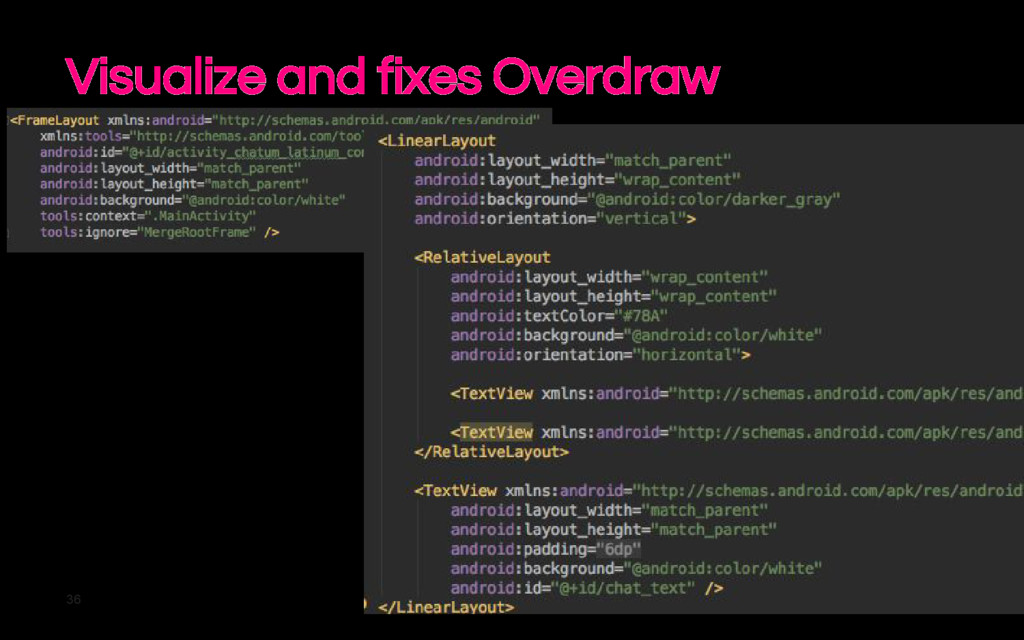
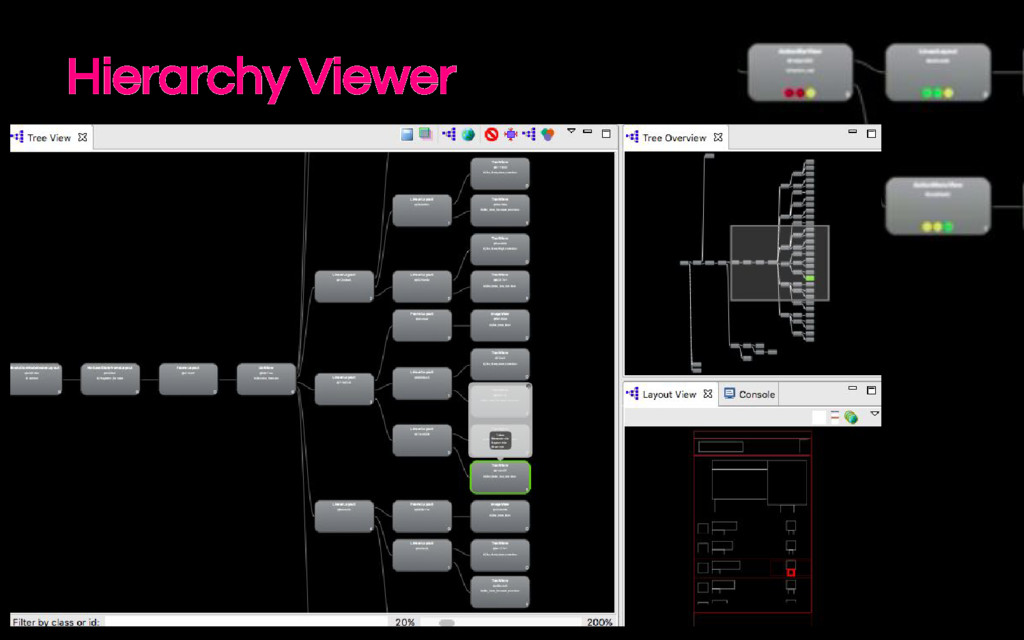
very expensive process • Every nested layout impacts the performance • Example of Items of a list using several linear layouts and using a relative layout to flattens the view → Show profile in Hierarchy View
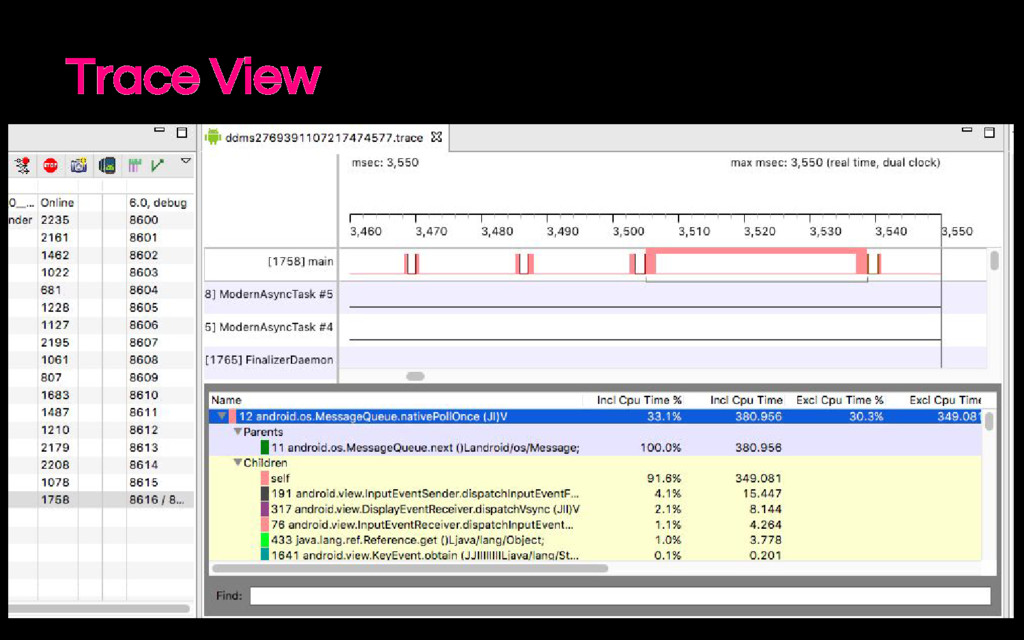
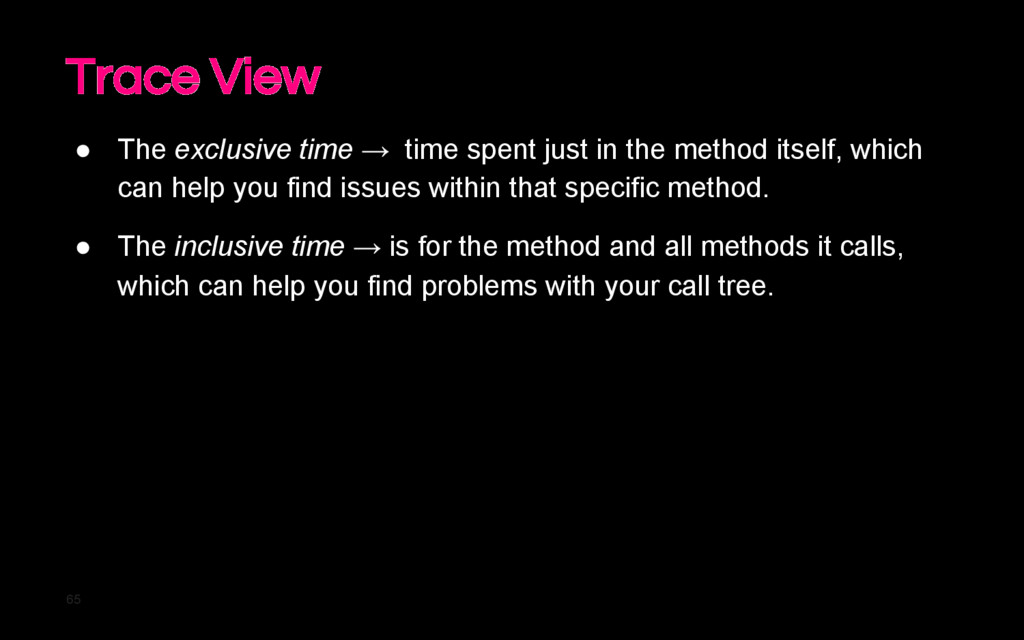
just in the method itself, which can help you find issues within that specific method. • The inclusive time → is for the method and all methods it calls, which can help you find problems with your call tree.
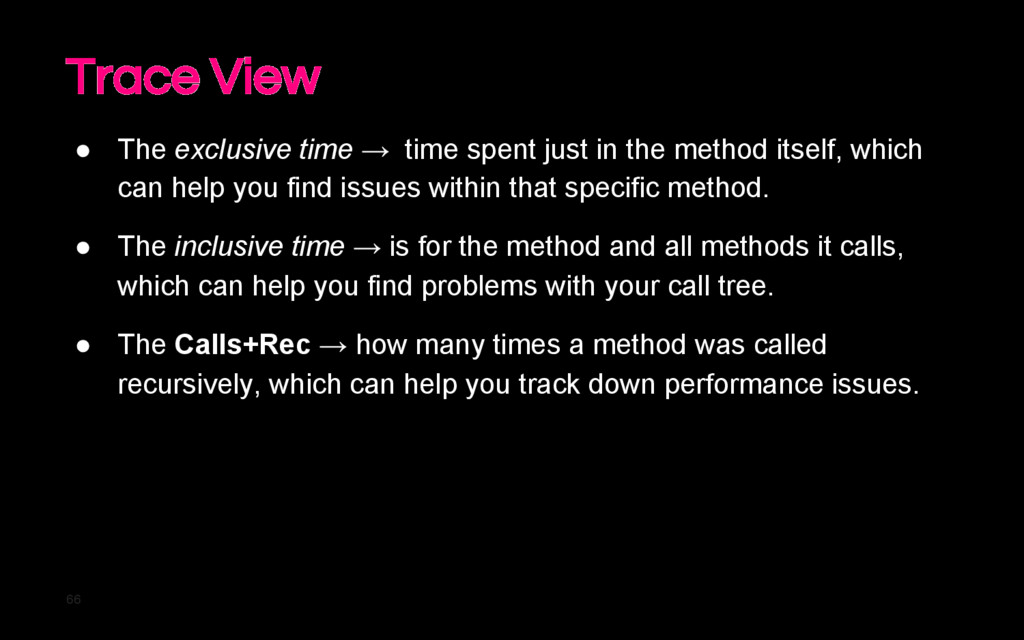
just in the method itself, which can help you find issues within that specific method. • The inclusive time → is for the method and all methods it calls, which can help you find problems with your call tree. • The Calls+Rec → how many times a method was called recursively, which can help you track down performance issues.
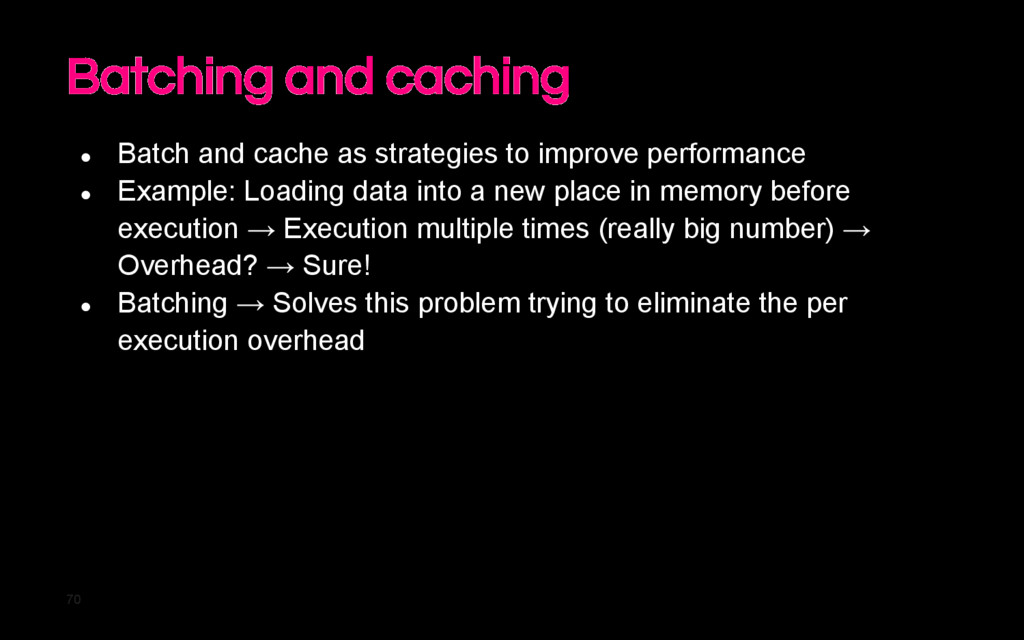
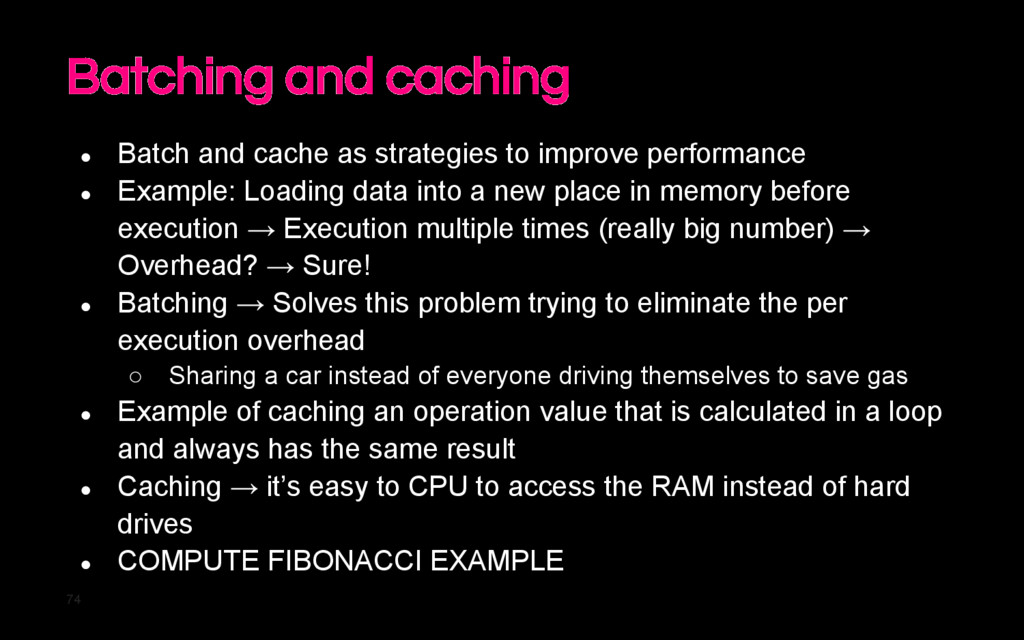
to improve performance • Example: Loading data into a new place in memory before execution → Execution multiple times (really big number) → Overhead? → Sure!
to improve performance • Example: Loading data into a new place in memory before execution → Execution multiple times (really big number) → Overhead? → Sure! • Batching → Solves this problem trying to eliminate the per execution overhead
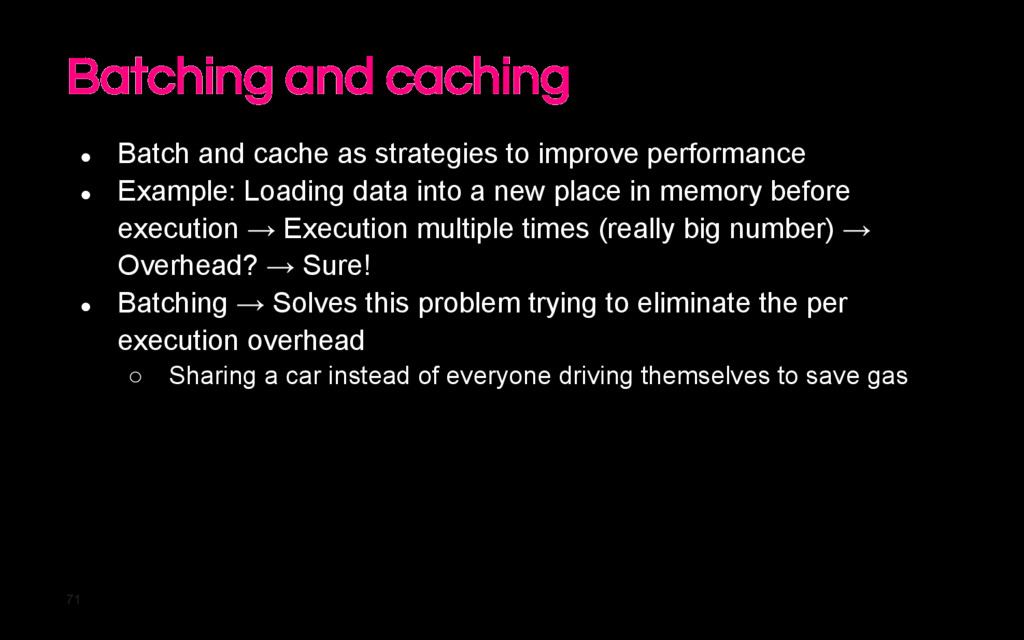
to improve performance • Example: Loading data into a new place in memory before execution → Execution multiple times (really big number) → Overhead? → Sure! • Batching → Solves this problem trying to eliminate the per execution overhead ◦ Sharing a car instead of everyone driving themselves to save gas
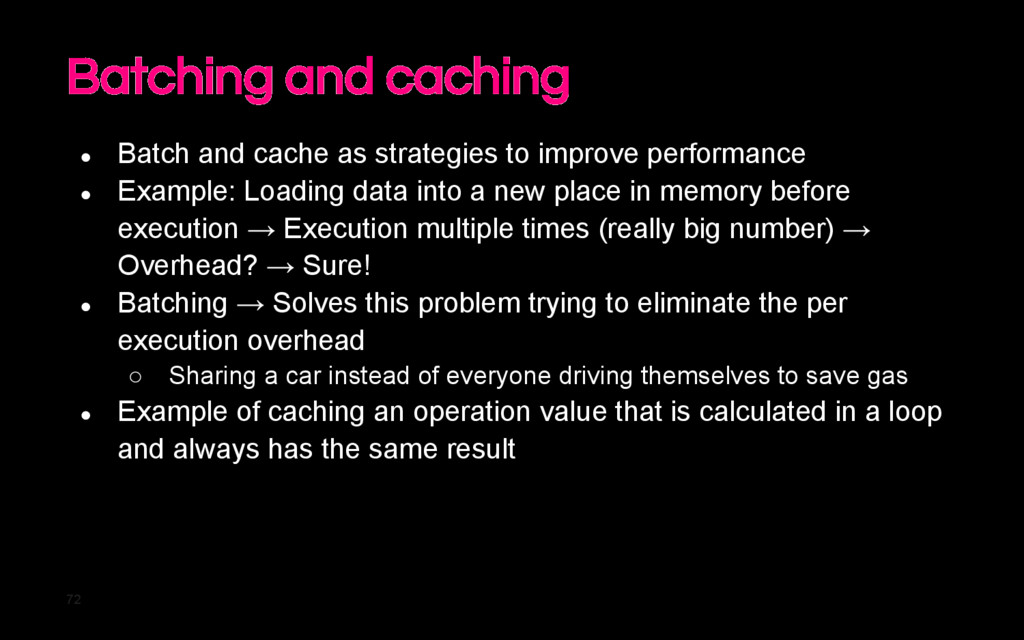
to improve performance • Example: Loading data into a new place in memory before execution → Execution multiple times (really big number) → Overhead? → Sure! • Batching → Solves this problem trying to eliminate the per execution overhead ◦ Sharing a car instead of everyone driving themselves to save gas • Example of caching an operation value that is calculated in a loop and always has the same result
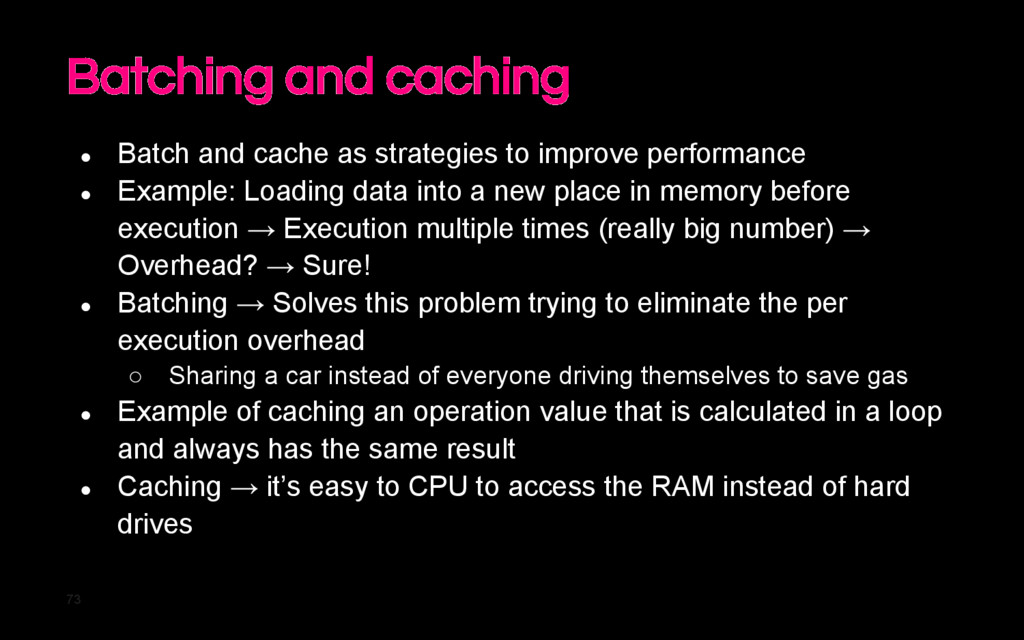
to improve performance • Example: Loading data into a new place in memory before execution → Execution multiple times (really big number) → Overhead? → Sure! • Batching → Solves this problem trying to eliminate the per execution overhead ◦ Sharing a car instead of everyone driving themselves to save gas • Example of caching an operation value that is calculated in a loop and always has the same result • Caching → it’s easy to CPU to access the RAM instead of hard drives
to improve performance • Example: Loading data into a new place in memory before execution → Execution multiple times (really big number) → Overhead? → Sure! • Batching → Solves this problem trying to eliminate the per execution overhead ◦ Sharing a car instead of everyone driving themselves to save gas • Example of caching an operation value that is calculated in a loop and always has the same result • Caching → it’s easy to CPU to access the RAM instead of hard drives • COMPUTE FIBONACCI EXAMPLE
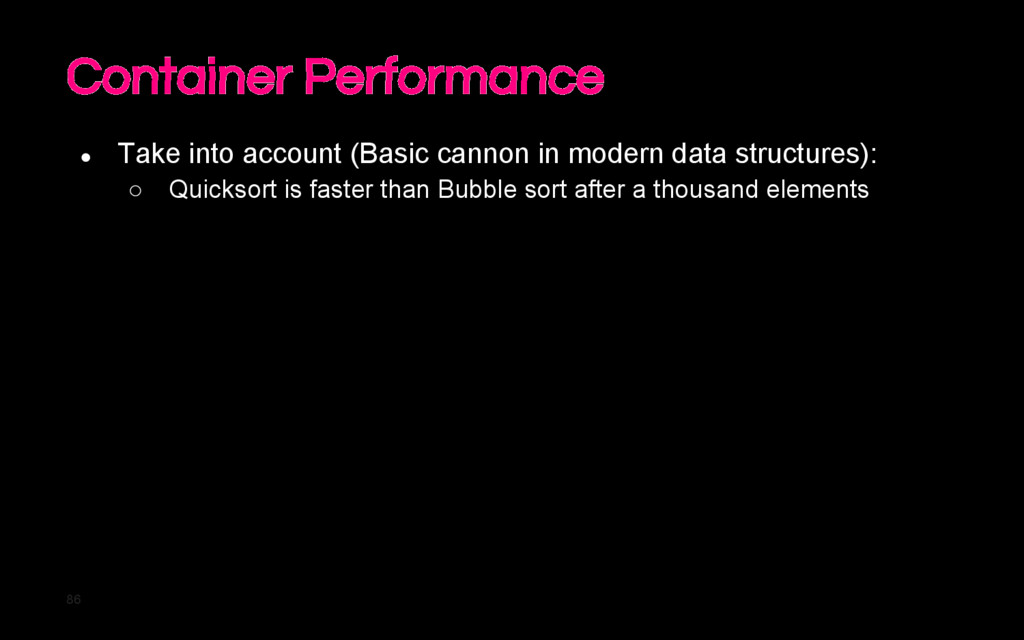
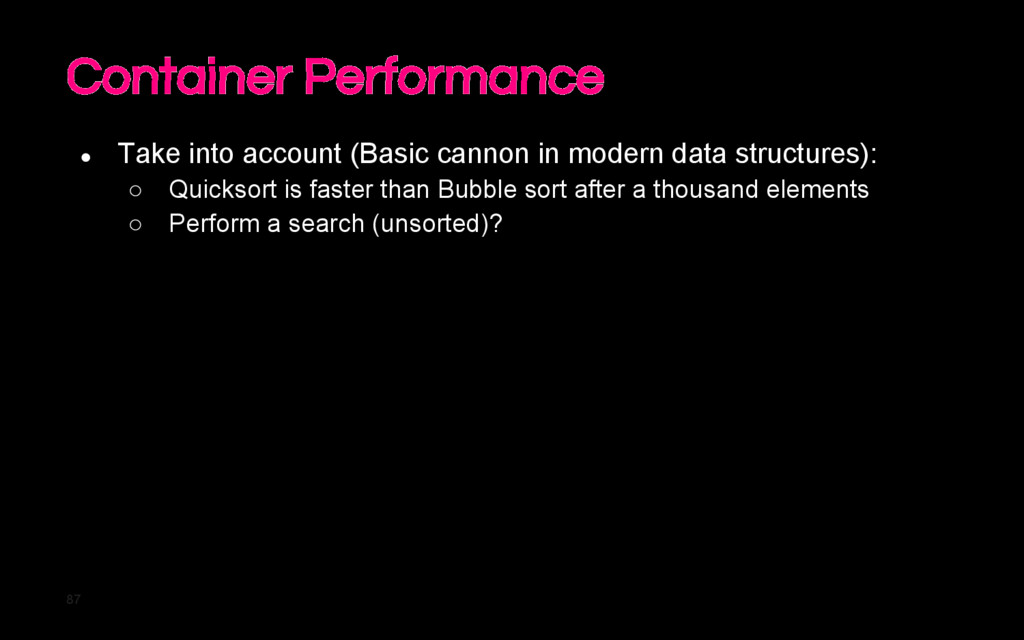
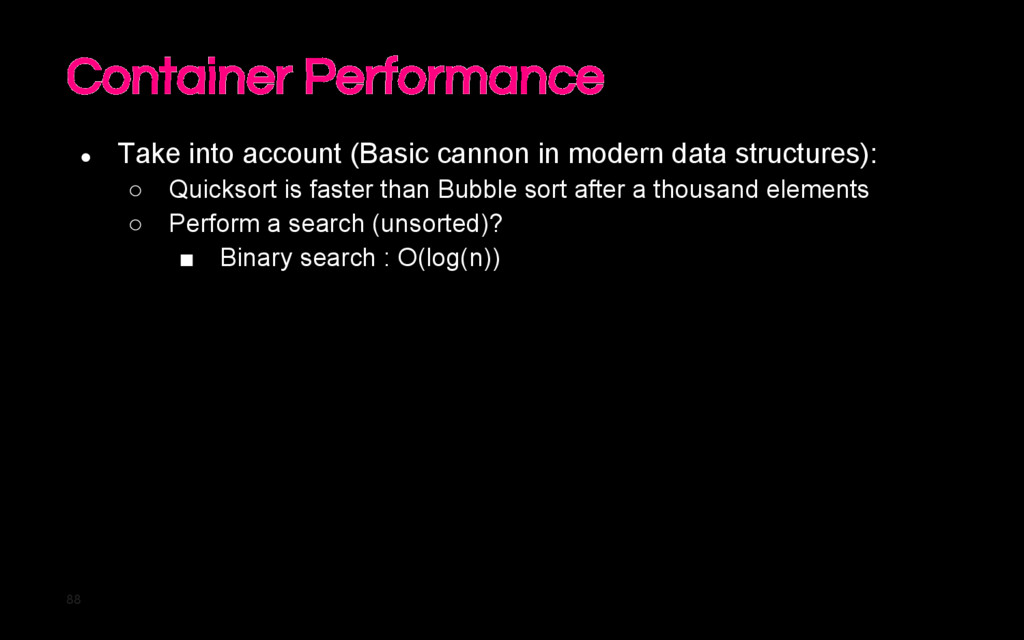
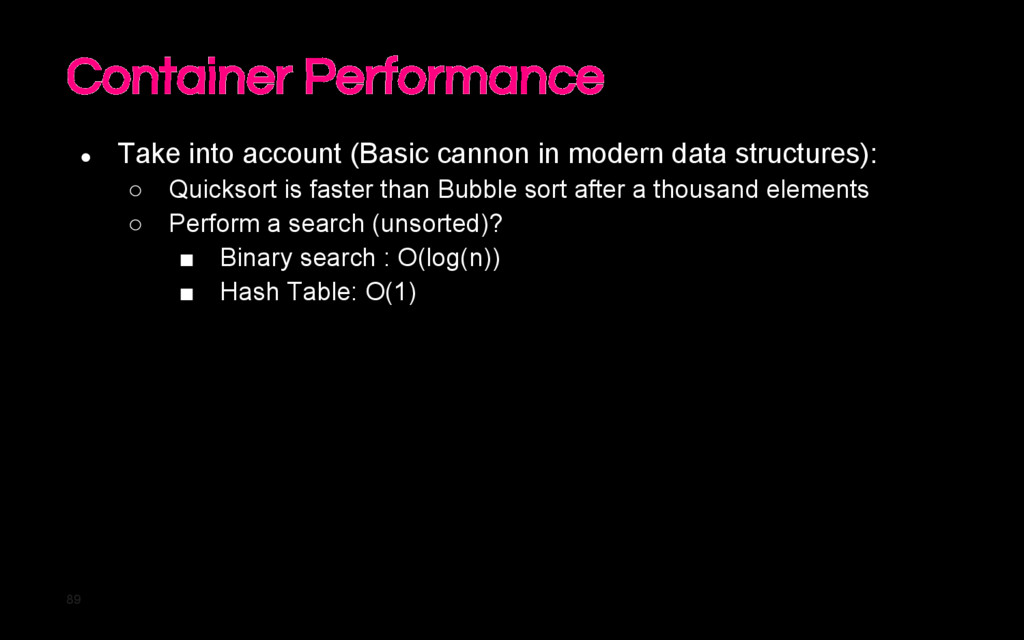
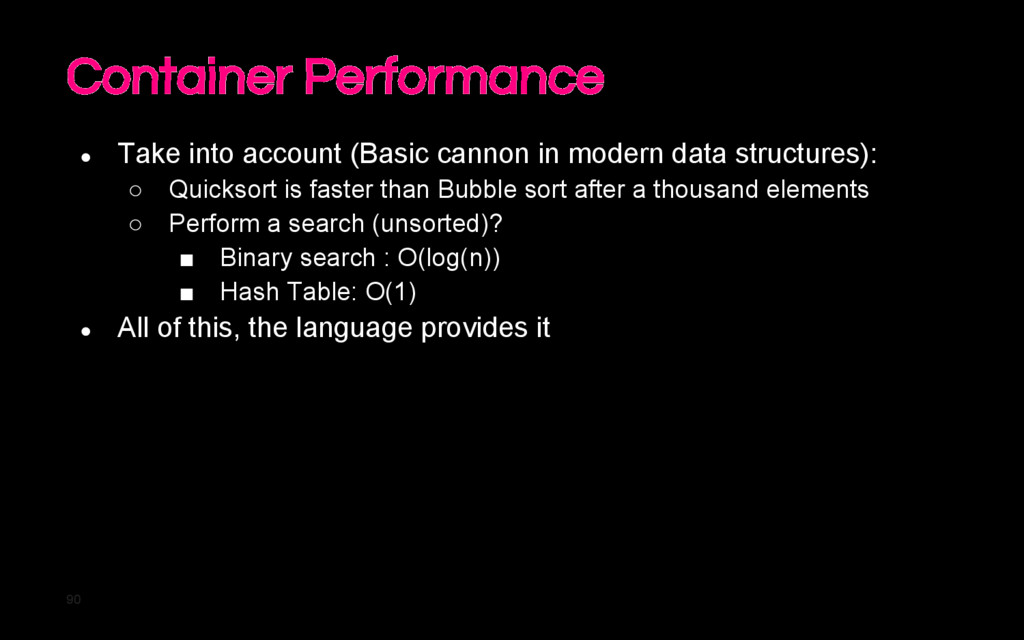
modern data structures): ◦ Quicksort is faster than Bubble sort after a thousand elements ◦ Perform a search (unsorted)? ▪ Binary search : O(log(n)) ▪ Hash Table: O(1)
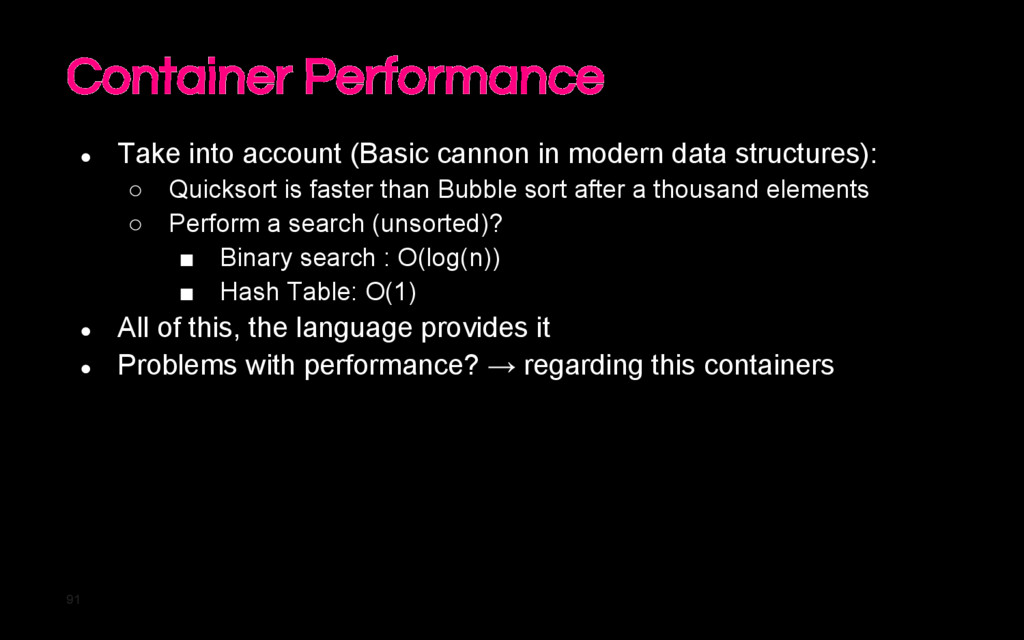
modern data structures): ◦ Quicksort is faster than Bubble sort after a thousand elements ◦ Perform a search (unsorted)? ▪ Binary search : O(log(n)) ▪ Hash Table: O(1) • All of this, the language provides it
modern data structures): ◦ Quicksort is faster than Bubble sort after a thousand elements ◦ Perform a search (unsorted)? ▪ Binary search : O(log(n)) ▪ Hash Table: O(1) • All of this, the language provides it • Problems with performance? → regarding this containers
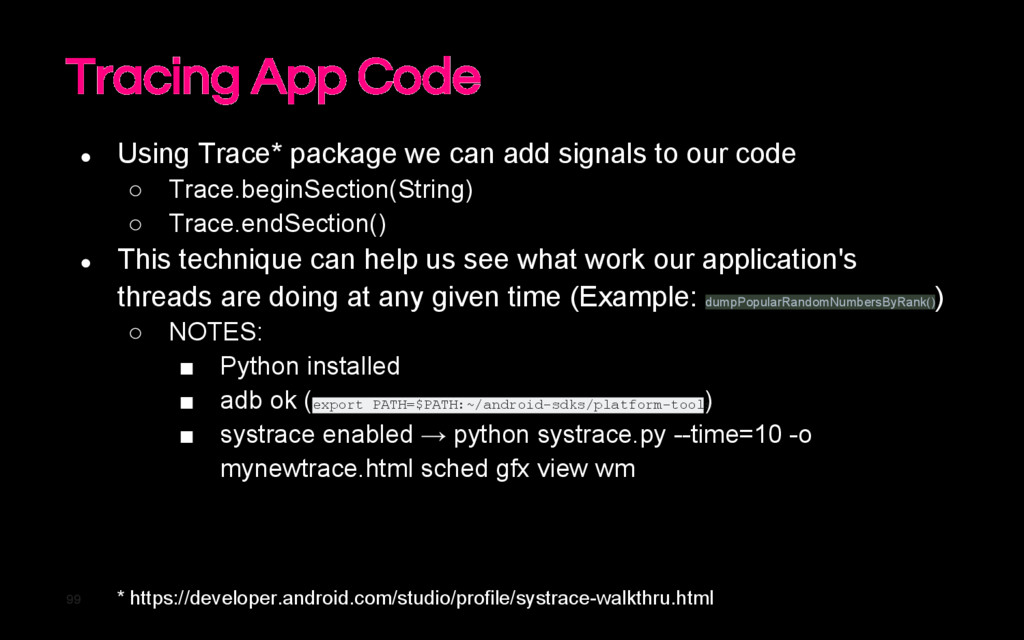
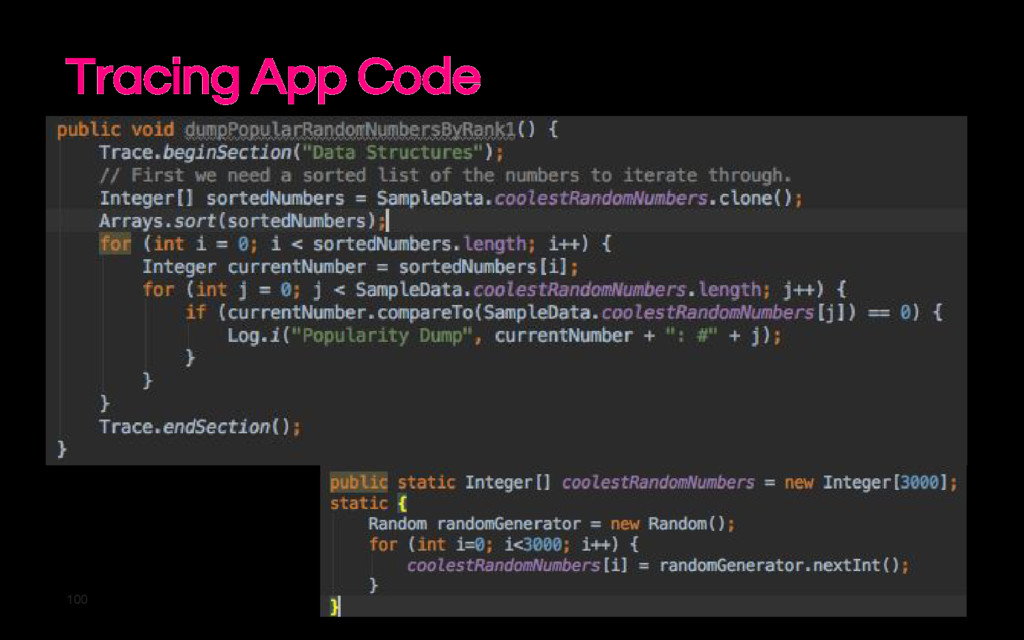
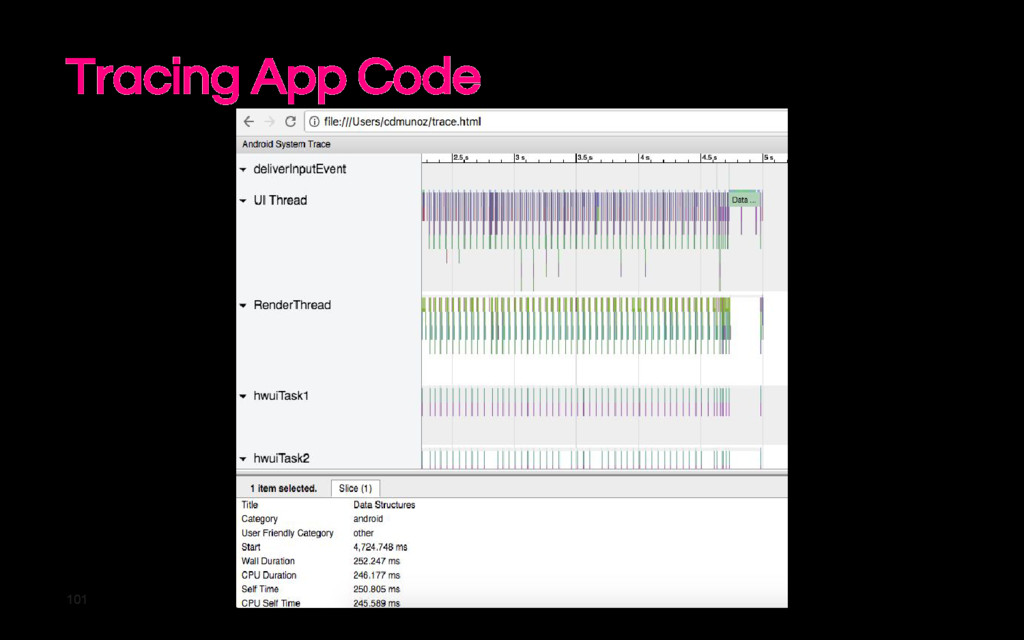
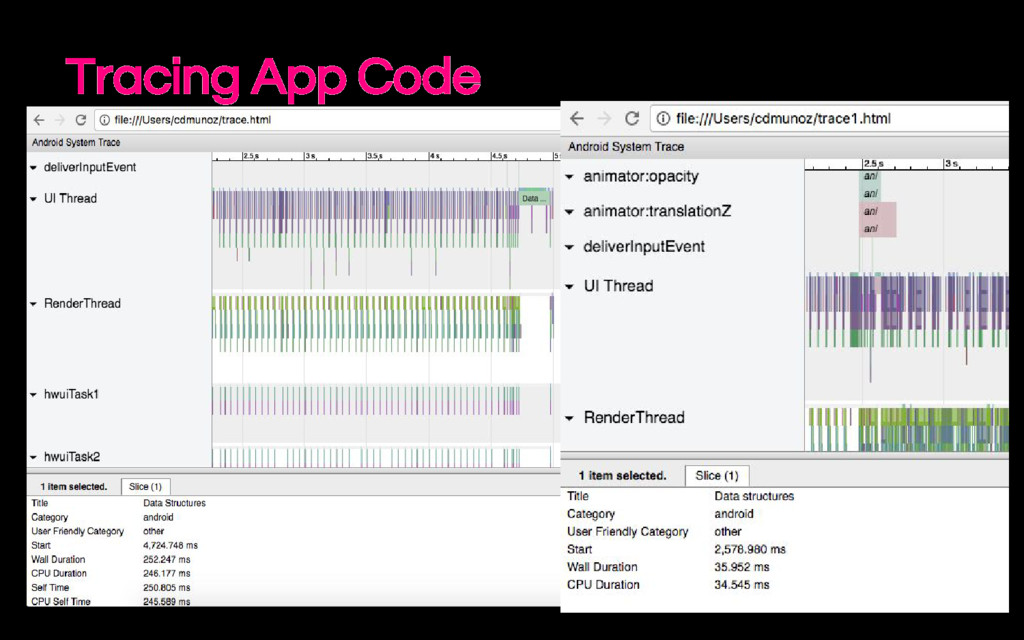
add signals to our code ◦ Trace.beginSection(String) ◦ Trace.endSection() • This technique → what work our application's threads are doing at any given time Example: dumpPopularRandomNumbersByRank() * https://developer.android.com/studio/profile/systrace-walkthru.html
add signals to our code ◦ Trace.beginSection(String) ◦ Trace.endSection() • This technique can help us see what work our application's threads are doing at any given time (Example: dumpPopularRandomNumbersByRank() ) ◦ NOTES: ▪ Python installed ▪ adb ok (export PATH=$PATH:~/android-sdks/platform-tools ) ▪ systrace enabled → python systrace.py --time=10 -o mynewtrace.html sched gfx view wm * https://developer.android.com/studio/profile/systrace-walkthru.html
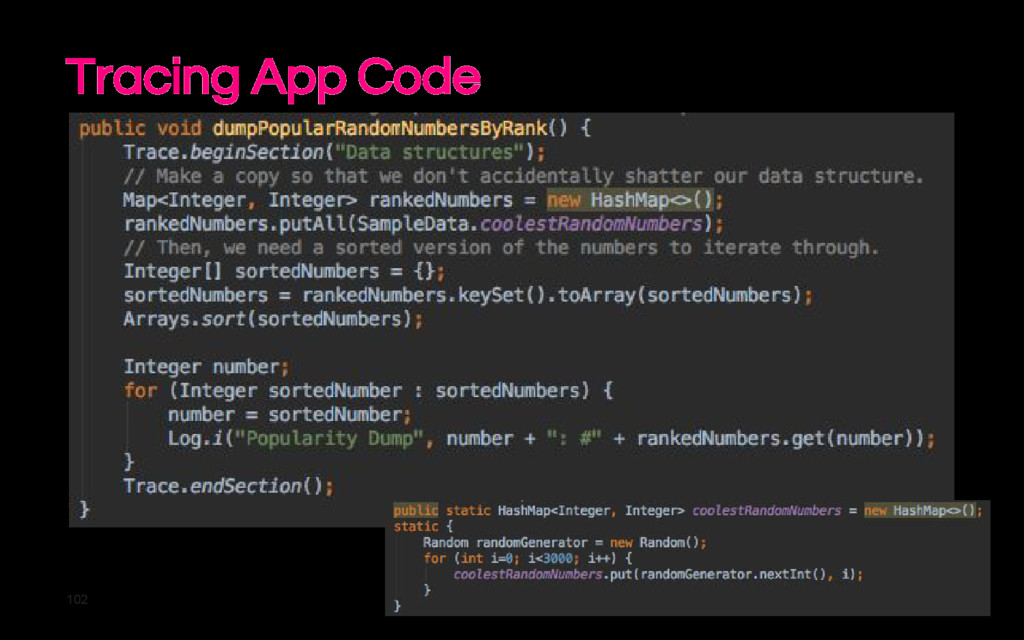
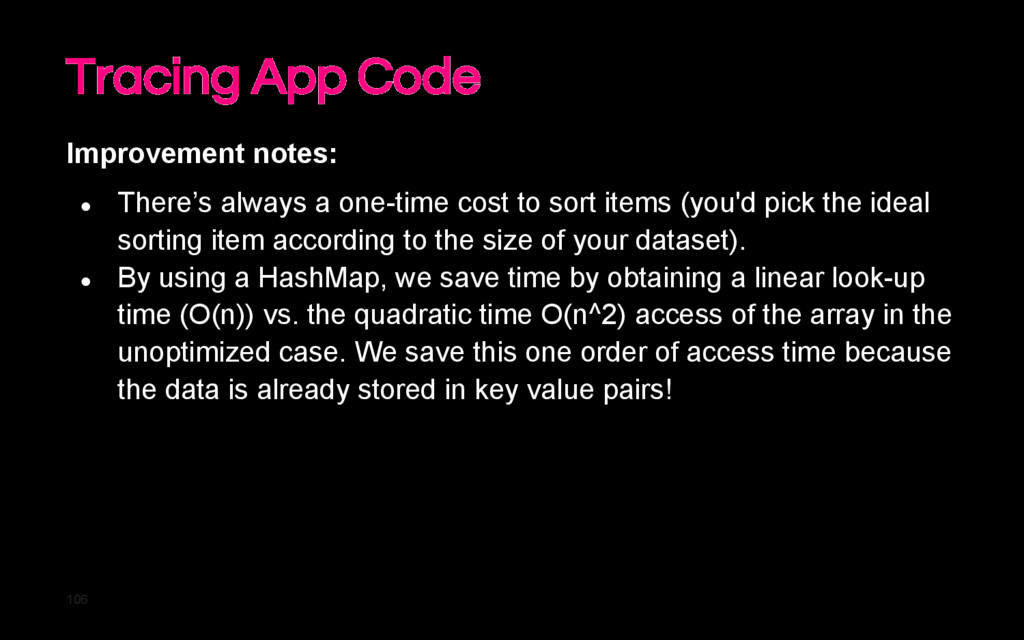
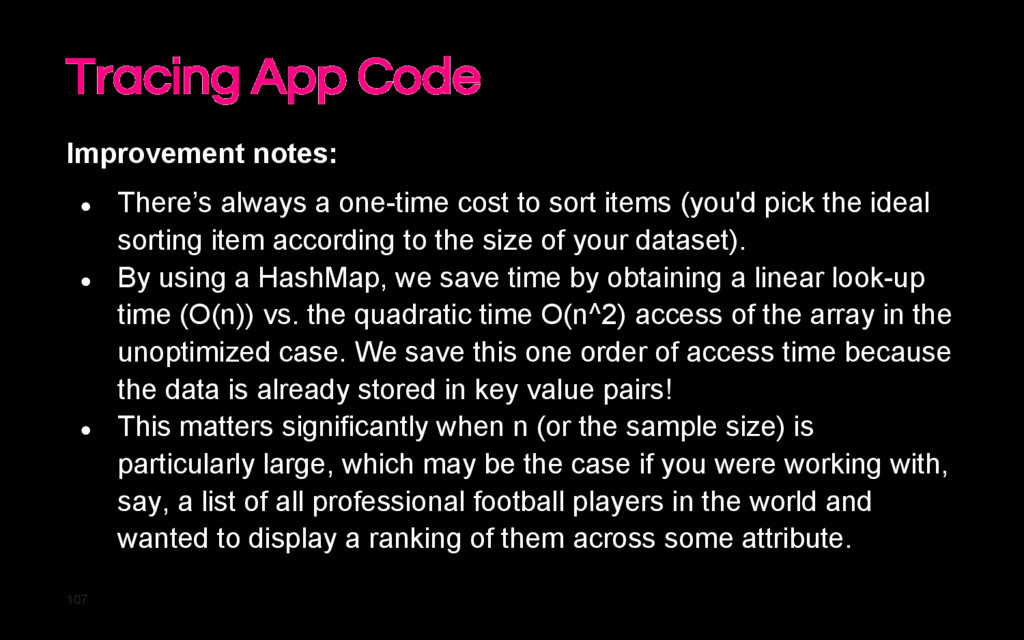
one-time cost to sort items (you'd pick the ideal sorting item according to the size of your dataset). • By using a HashMap, we save time by obtaining a linear look-up time (O(n)) vs. the quadratic time O(n^2) access of the array in the unoptimized case. We save this one order of access time because the data is already stored in key value pairs!
one-time cost to sort items (you'd pick the ideal sorting item according to the size of your dataset). • By using a HashMap, we save time by obtaining a linear look-up time (O(n)) vs. the quadratic time O(n^2) access of the array in the unoptimized case. We save this one order of access time because the data is already stored in key value pairs! • This matters significantly when n (or the sample size) is particularly large, which may be the case if you were working with, say, a list of all professional football players in the world and wanted to display a ranking of them across some attribute.
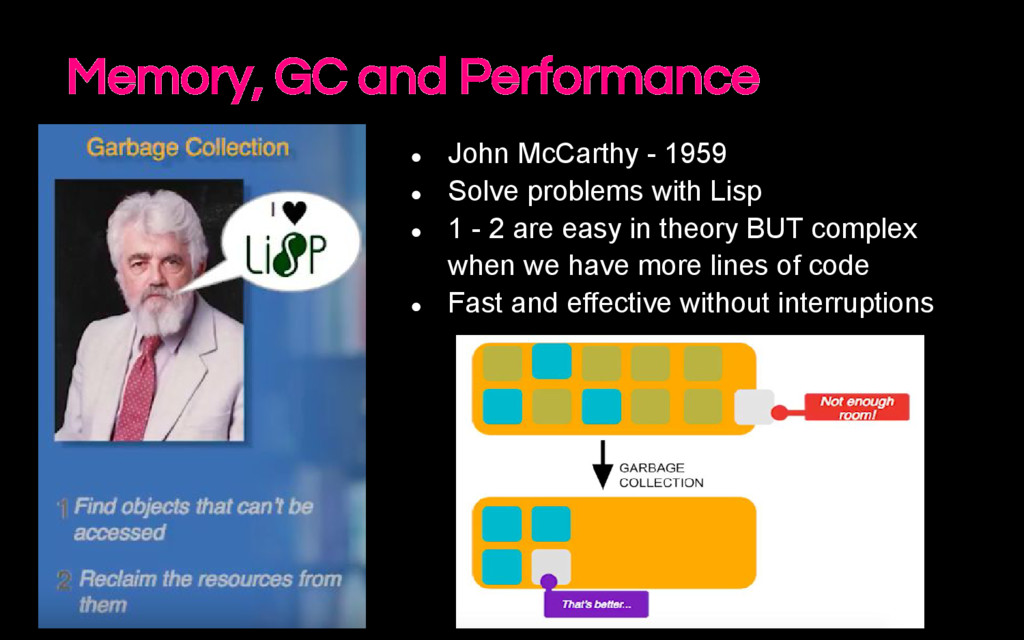
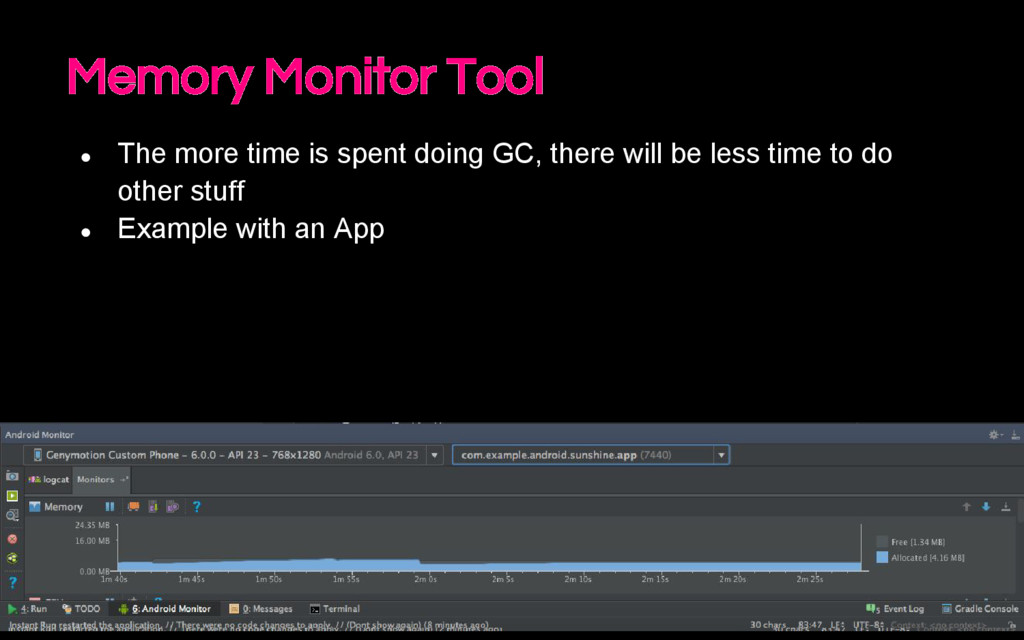
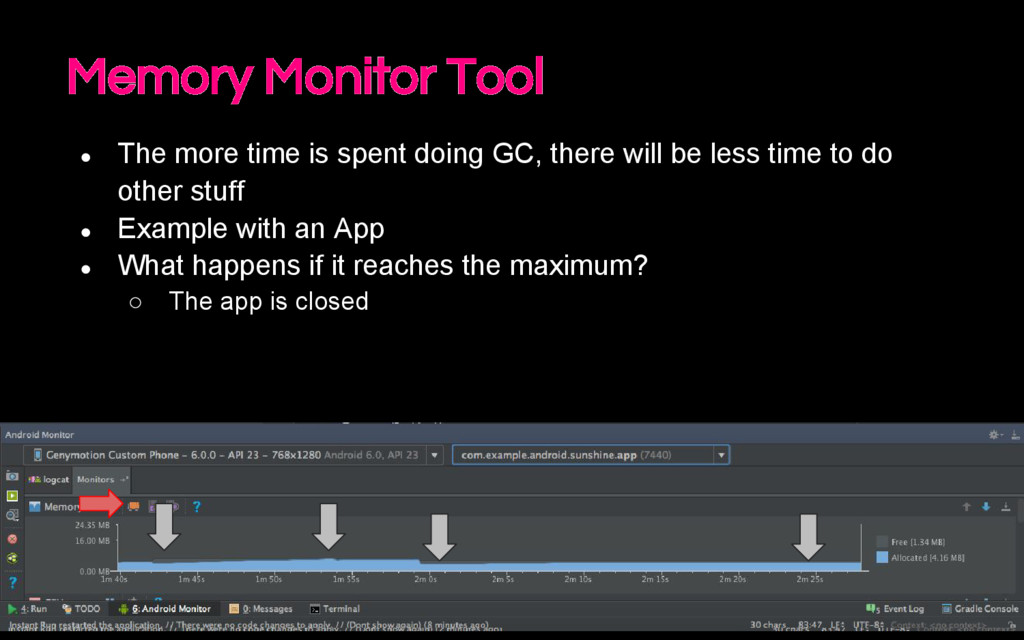
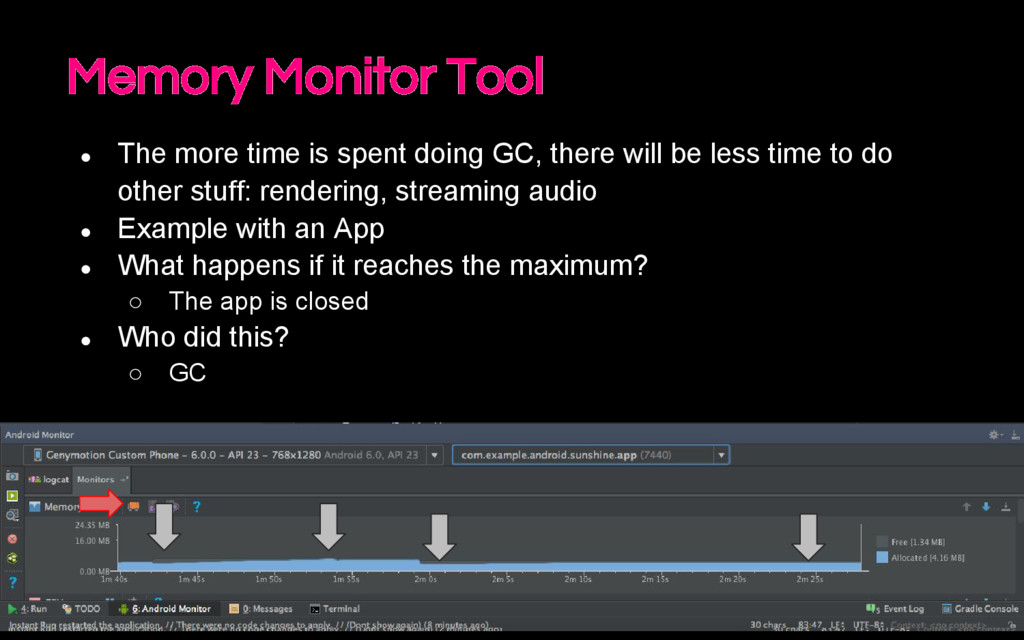
doing GC, there will be less time to do other stuff: rendering, streaming audio • Example with an App • What happens if it reaches the maximum? ◦ The app is closed • Who did this? ◦ GC
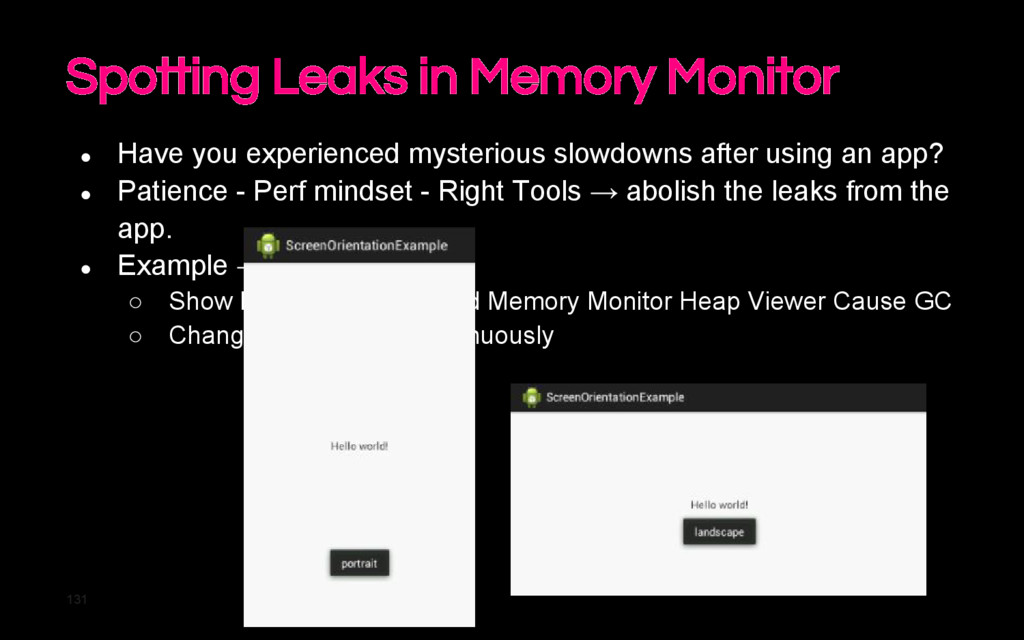
mysterious slowdowns after using an app? • Patience - Perf mindset - Right Tools → abolish the leaks from the app. • Example → Memory Leak ◦ Show Monitor behavior and Memory Monitor Heap Viewer Cause GC
mysterious slowdowns after using an app? • Patience - Perf mindset - Right Tools → abolish the leaks from the app. • Example → Memory Leak ◦ Show Monitor behavior and Memory Monitor Heap Viewer Cause GC ◦ Changing orientation continuously
mysterious slowdowns after using an app? • Patience - Perf mindset - Right Tools → abolish the leaks from the app. • Example → Memory Leak ◦ Show Monitor behavior and Memory Monitor Heap Viewer Cause GC ◦ Changing orientation continuously
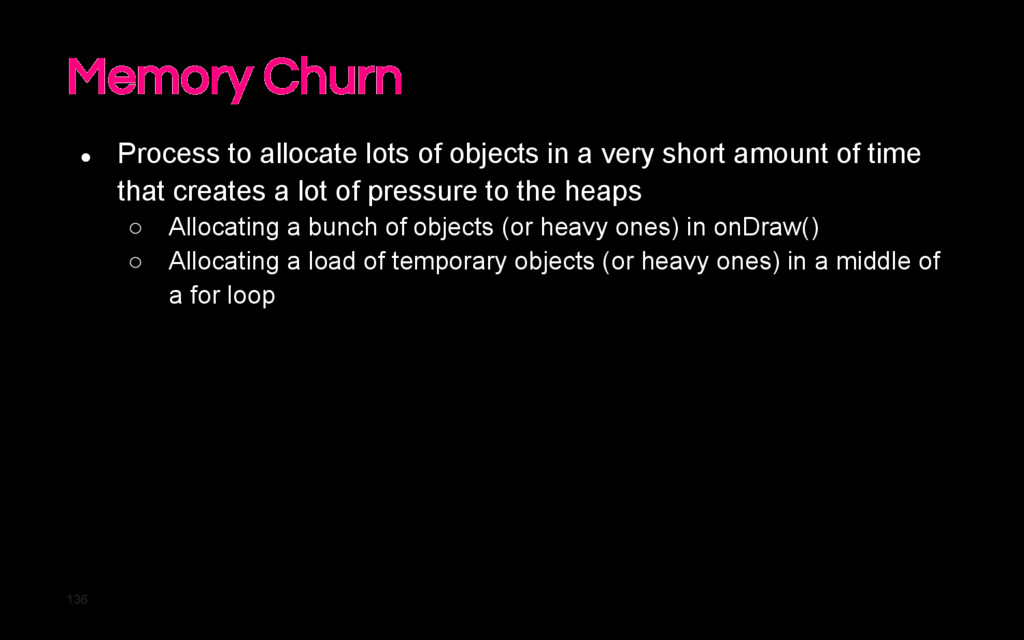
in a very short amount of time that creates a lot of pressure to the heaps ◦ Allocating a bunch of objects (or heavy ones) in onDraw() ◦ Allocating a load of temporary objects (or heavy ones) in a middle of a for loop
in a very short amount of time that creates a lot of pressure to the heaps ◦ Allocating a bunch of objects (or heavy ones) in onDraw() ◦ Allocating a load of temporary objects (or heavy ones) in a middle of a for loop
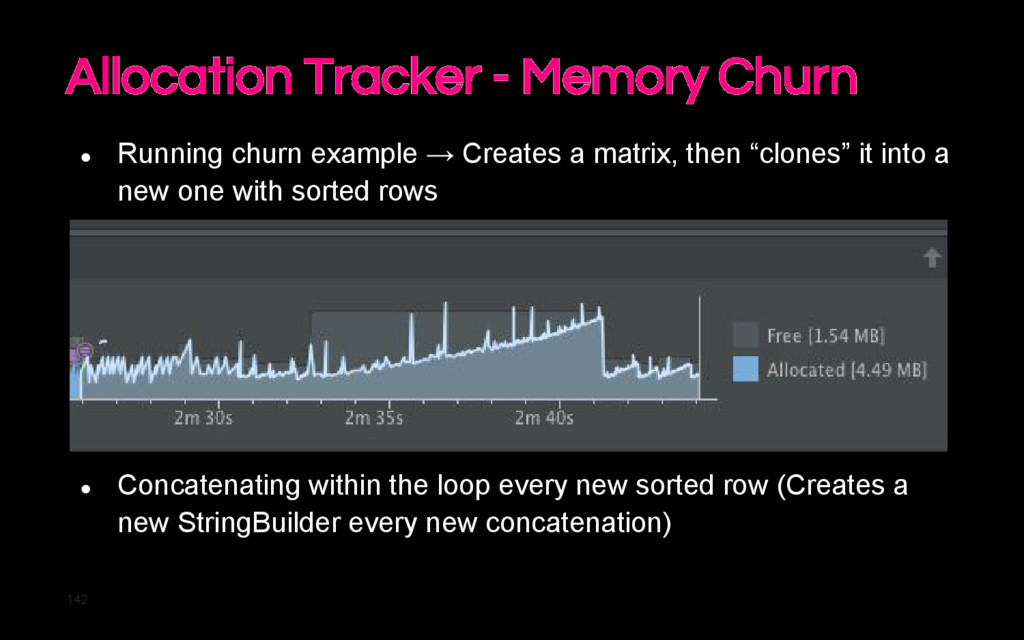
→ Creates a matrix, then “clones” it into a new one with sorted rows • Concatenating within the loop every new sorted row (Creates a new StringBuilder every new concatenation)
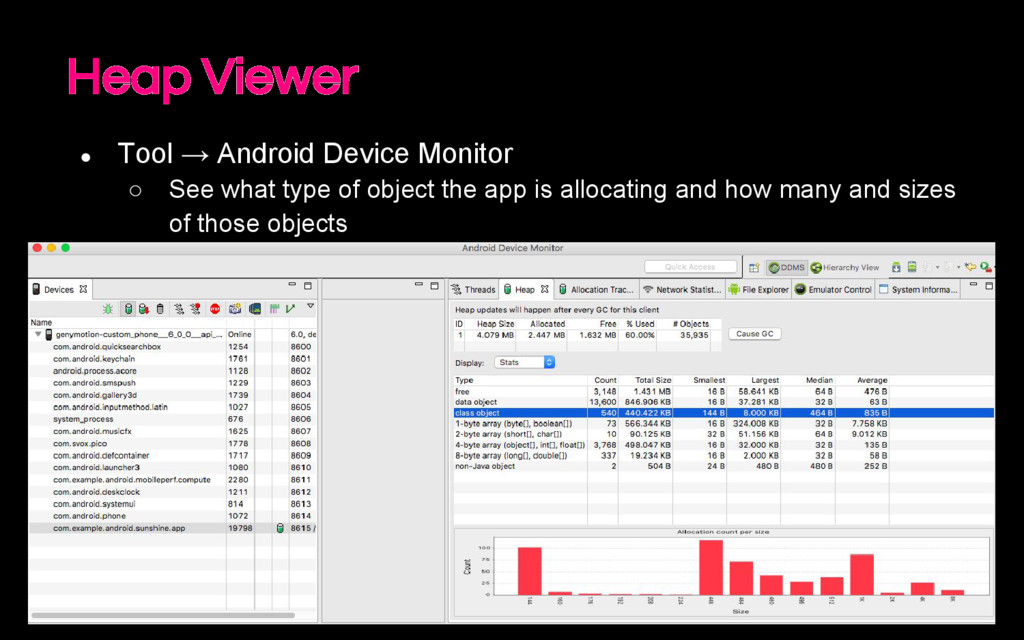
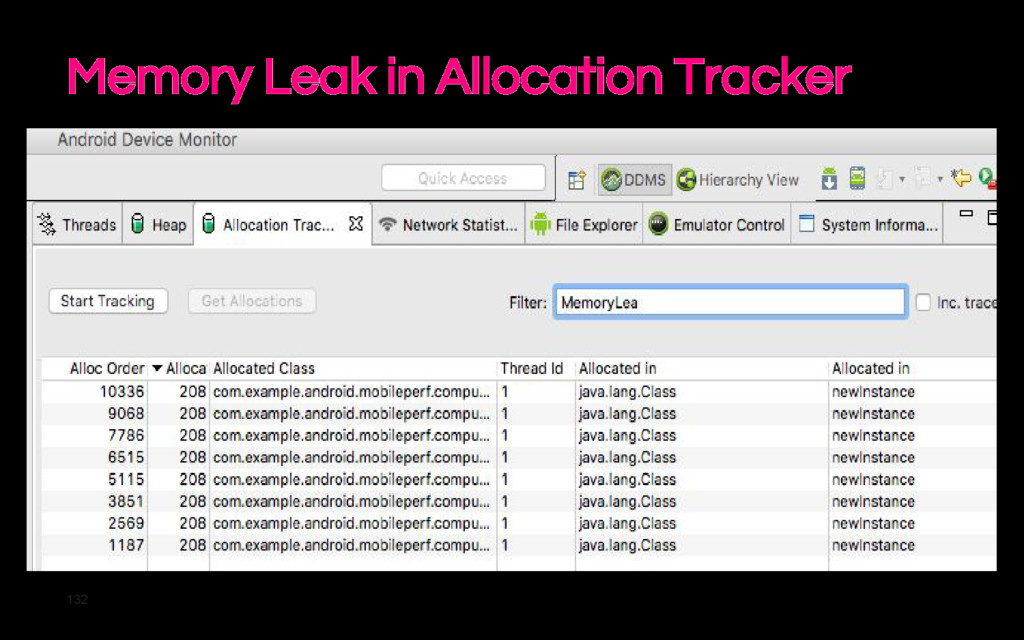
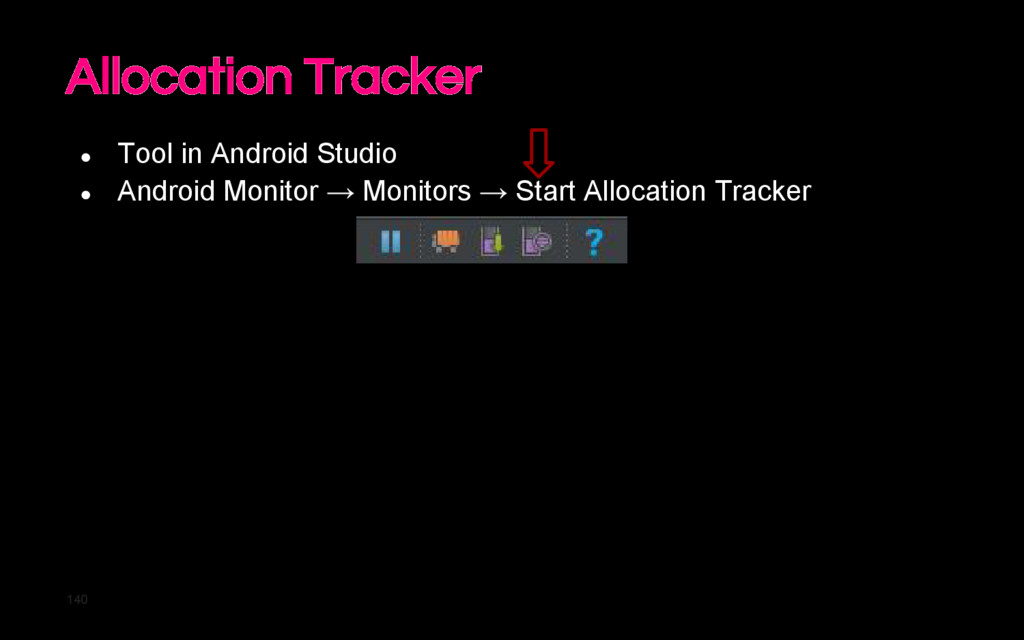
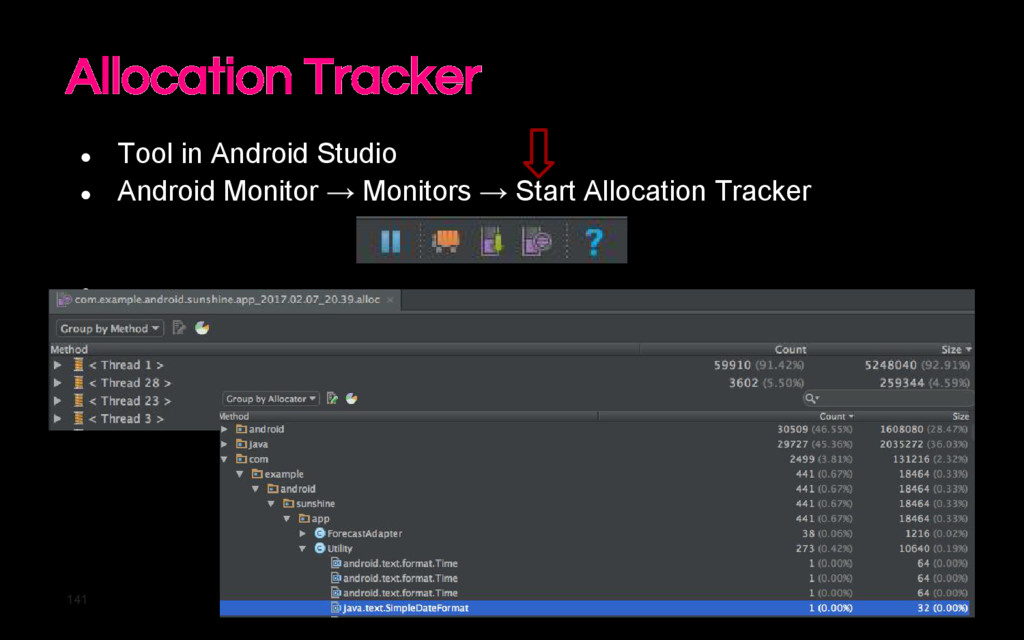
monitor → View state of memory over time ◦ Heat Viewer → What’s on the heap ◦ Allocation tracker → Where did it come from • Evaluate code against several tools and seek multiple perspectives
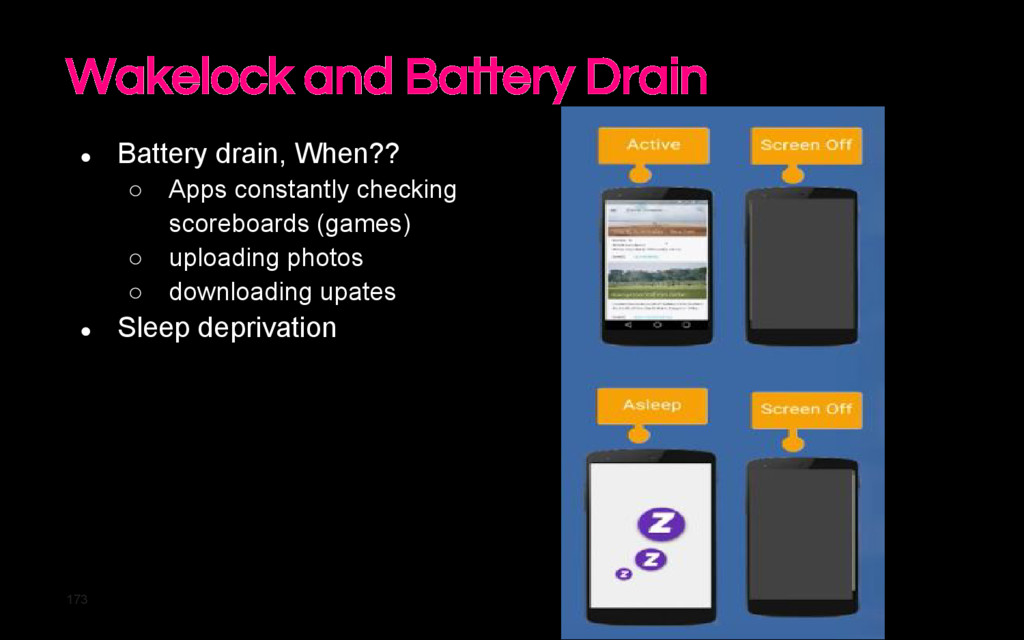
hood? ◦ Active phone: ▪ CPU processes ▪ cellular radio transmitting data ▪ screen awake - remember Render section? ◦ Application awakening the device: ▪ Wake clock ▪ Alarm manager
hood? ◦ Active phone: ▪ CPU processes ▪ cellular radio transmitting data ▪ screen awake - remember Render section? ◦ Application awakening the device: ▪ Wake clock ▪ Alarm manager • How do I identify battery behavior?
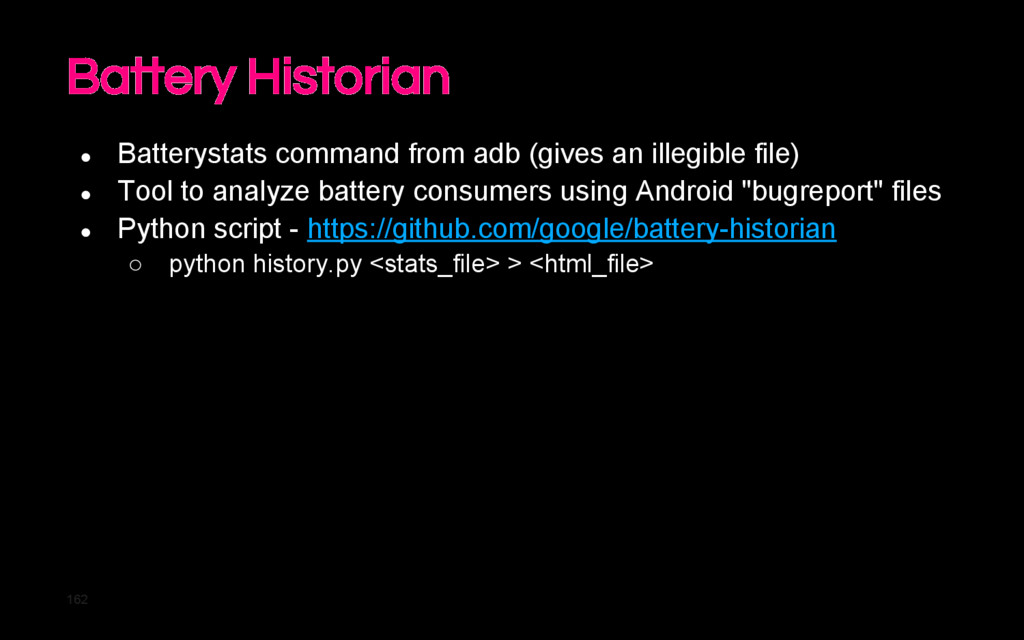
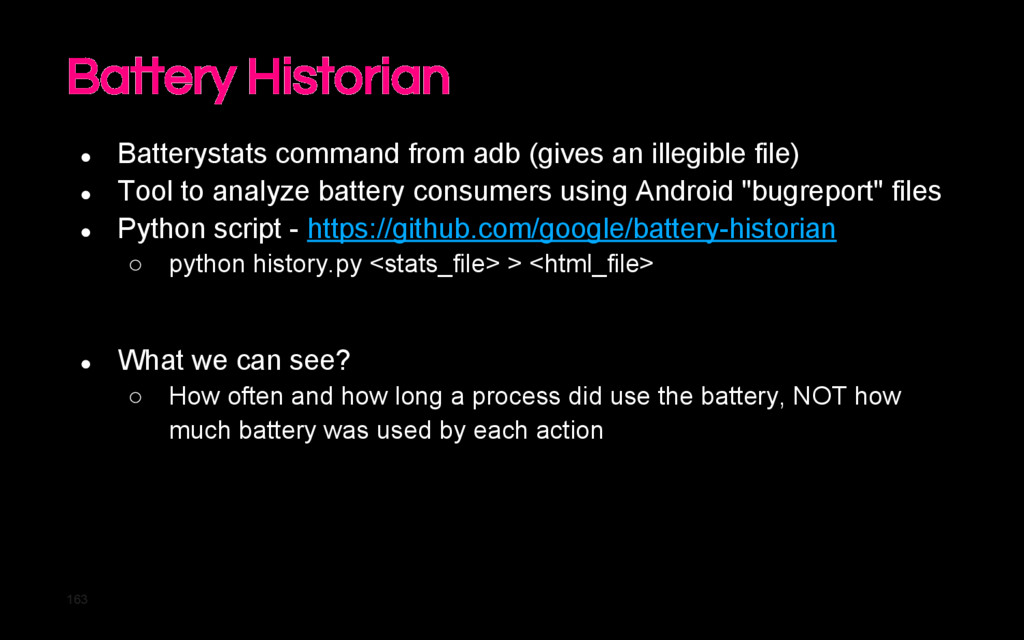
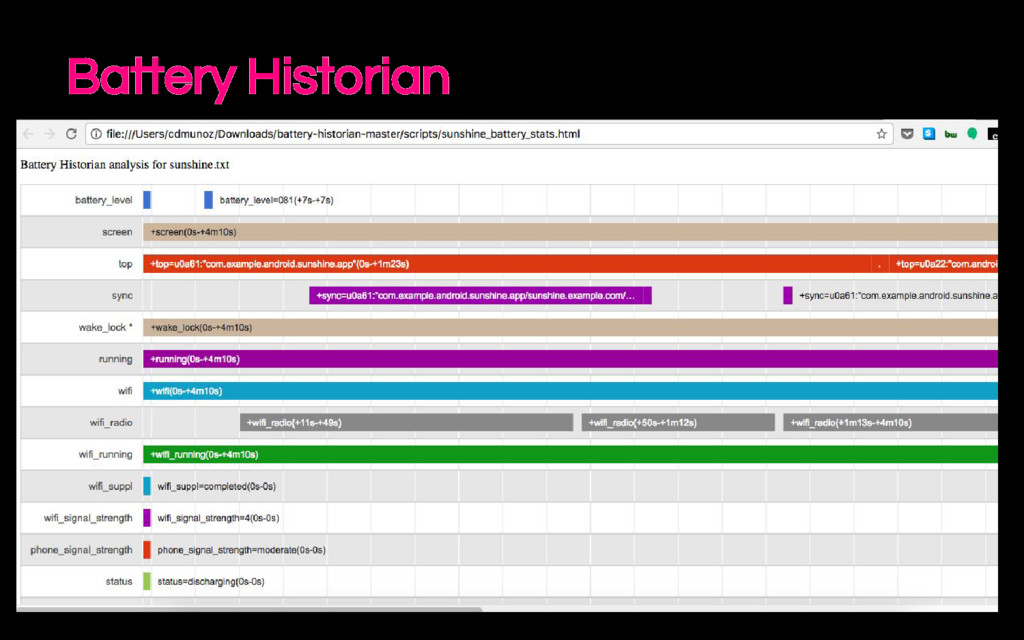
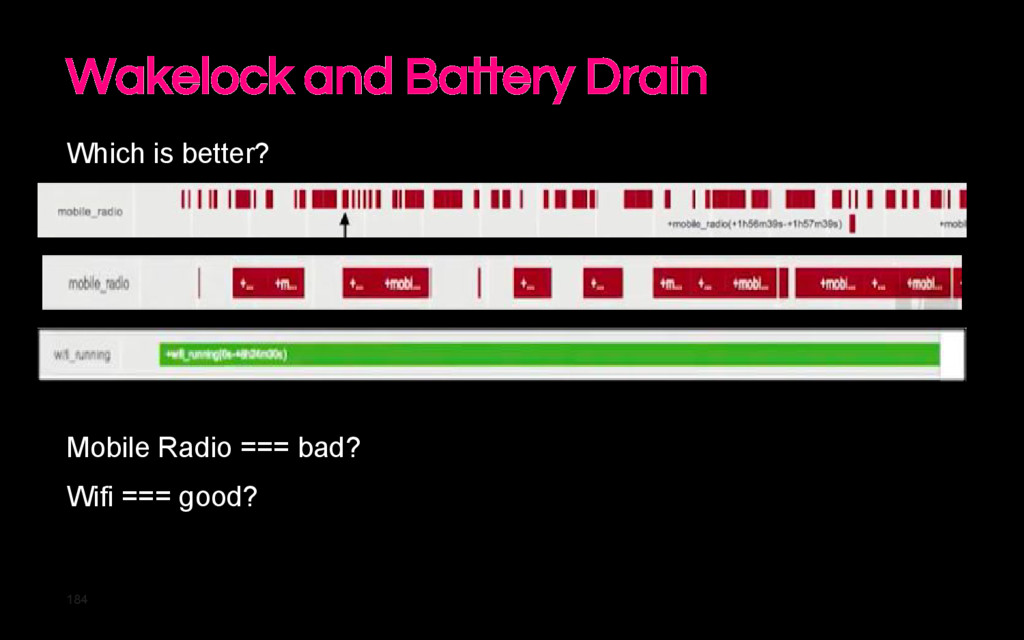
illegible file) • Tool to analyze battery consumers using Android "bugreport" files • Python script - https://github.com/google/battery-historian ◦ python history.py <stats_file> > <html_file> • What we can see? ◦ How often and how long a process did use the battery, NOT how much battery was used by each action
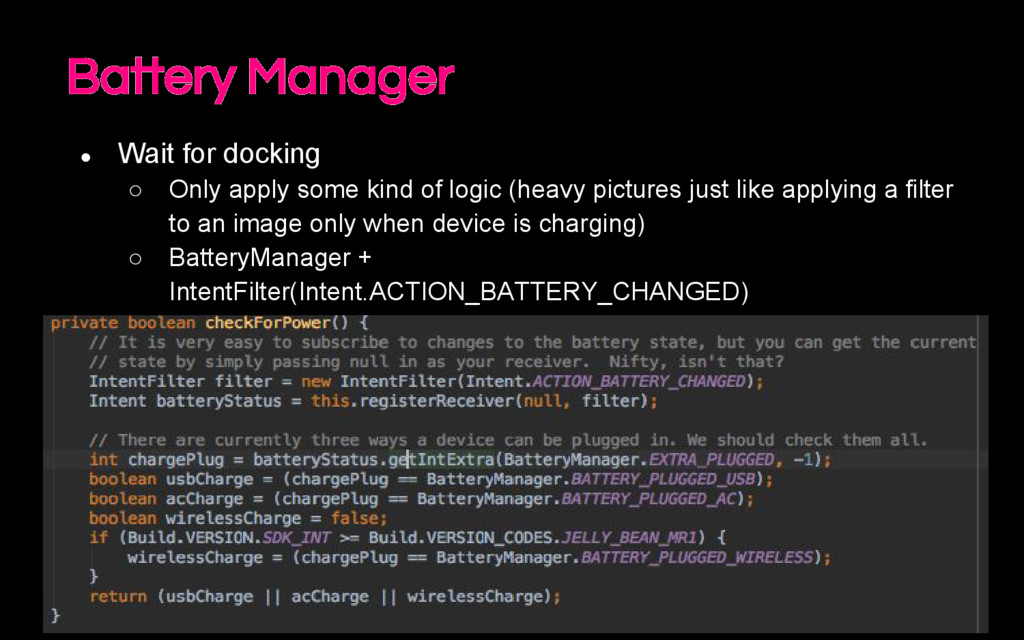
some kind of logic (heavy pictures just like applying a filter to an image only when device is charging) ◦ BatteryManager + IntentFilter(Intent.ACTION_BATTERY_CHANGED)
some kind of logic (heavy pictures just like applying a filter to an image only when device is charging) ◦ BatteryManager + IntentFilter(Intent.ACTION_BATTERY_CHANGED)
PowerManager.Wakelock API ◦ Keeps CPU running preventing screen to turn off ◦ Wakes phone up in future dates, do some work, sleep ◦ Defer some activities
PowerManager.Wakelock API ◦ Keeps CPU running preventing screen to turn off ◦ Wakes phone up in future dates, do some work, sleep ◦ Defer some activities ▪ Wifi connected ▪ Charging
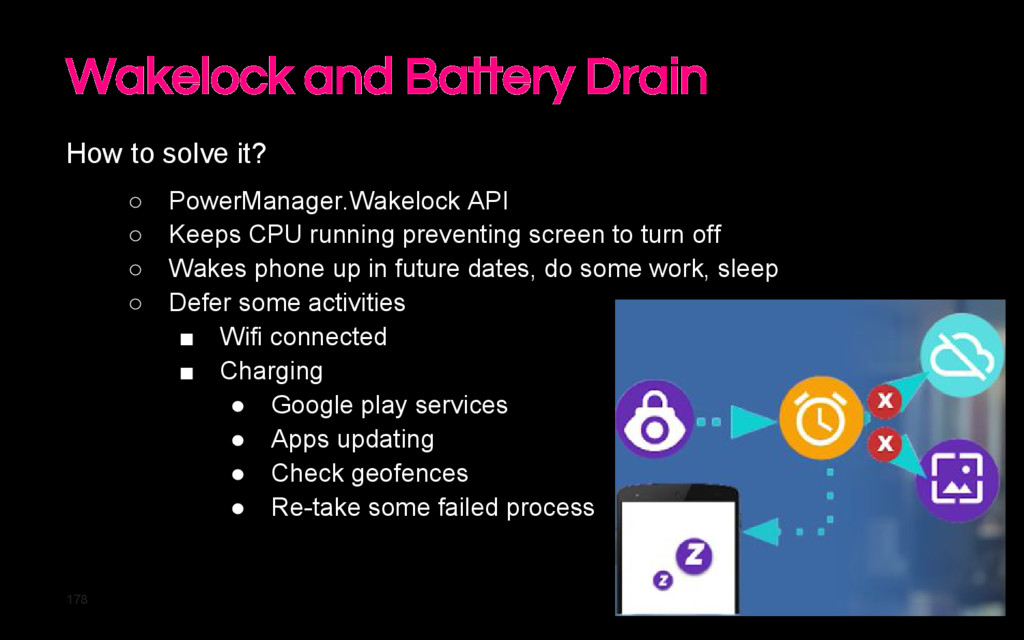
PowerManager.Wakelock API ◦ Keeps CPU running preventing screen to turn off ◦ Wakes phone up in future dates, do some work, sleep ◦ Defer some activities ▪ Wifi connected ▪ Charging • Google play services • Apps updating • Check geofences • Re-take some failed process
PowerManager.Wakelock API ◦ Keeps CPU running preventing screen to turn off ◦ Wakes phone up in future dates, do some work, sleep ◦ Defer some activities ▪ Wifi connected ▪ Charging • Google play services • Apps updating • Check geofences • Re-take some failed process
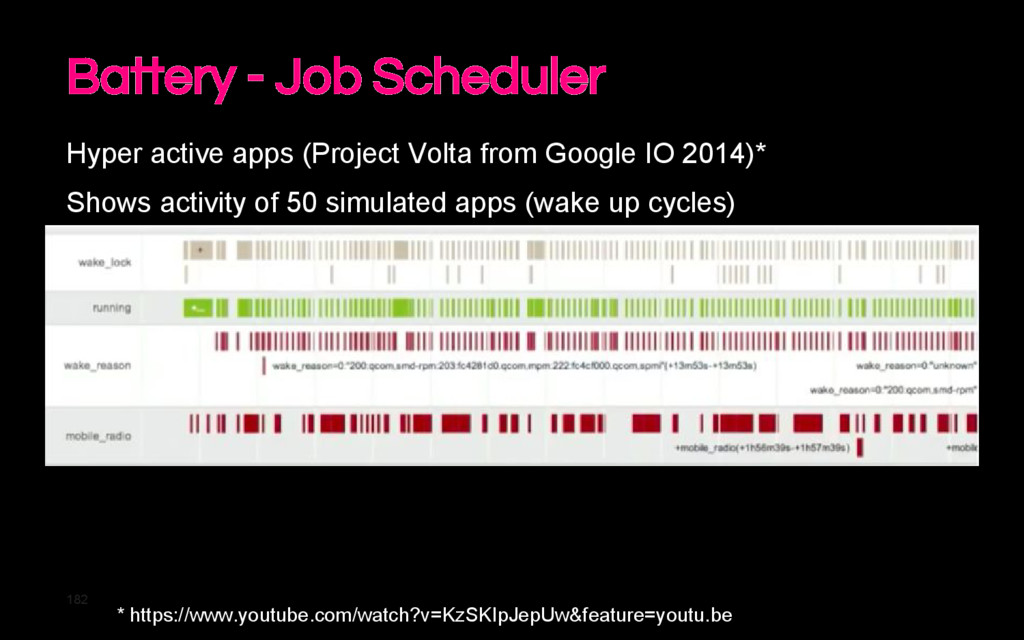
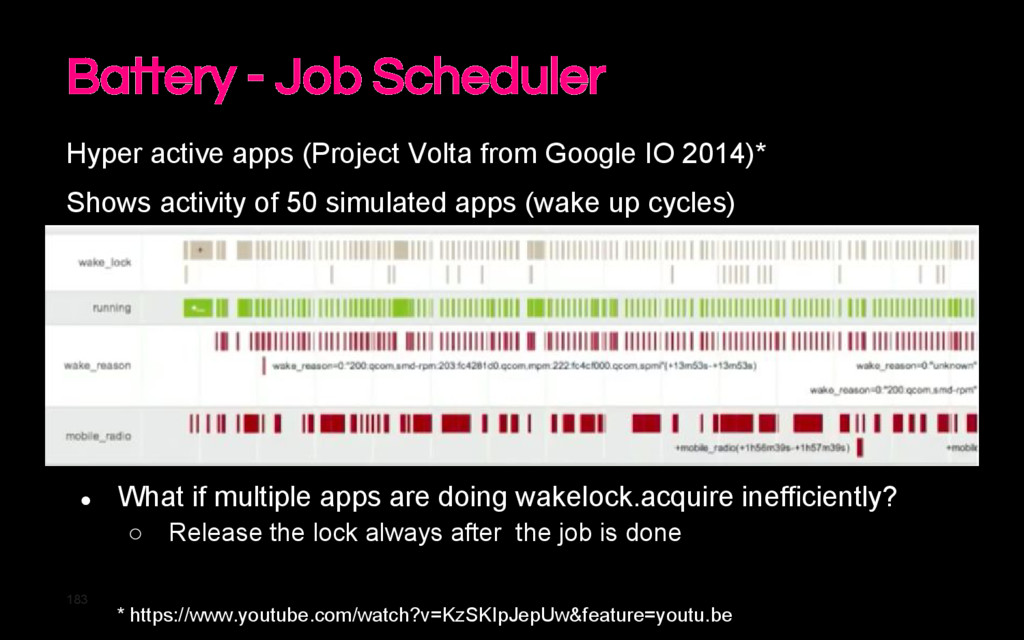
from Google IO 2014)* Shows activity of 50 simulated apps (wake up cycles) • What if multiple apps are doing wakelock.acquire inefficiently? ◦ Release the lock always after the job is done * https://www.youtube.com/watch?v=KzSKIpJepUw&feature=youtu.be
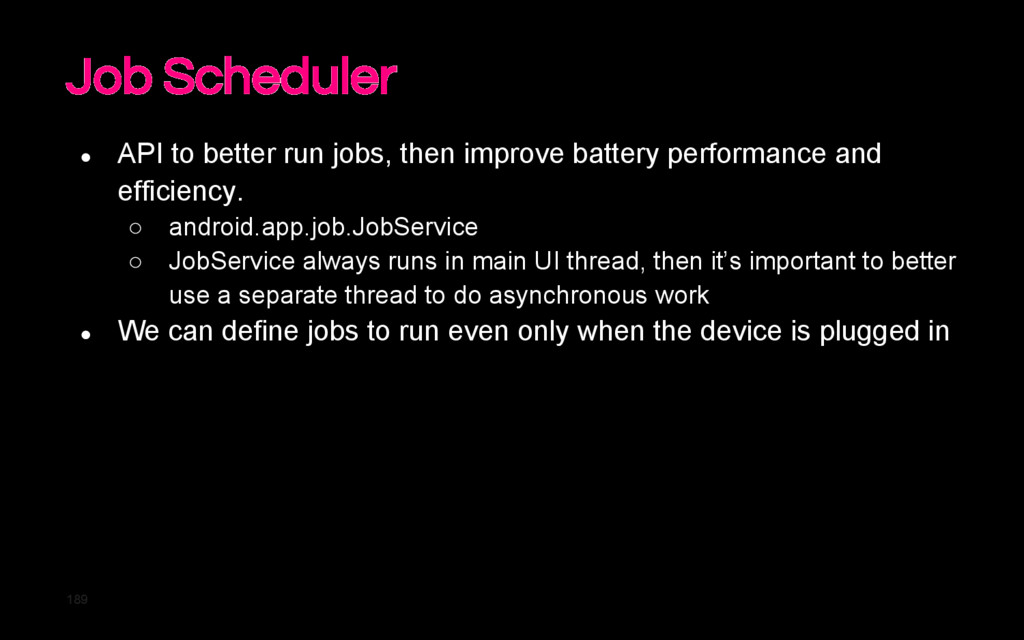
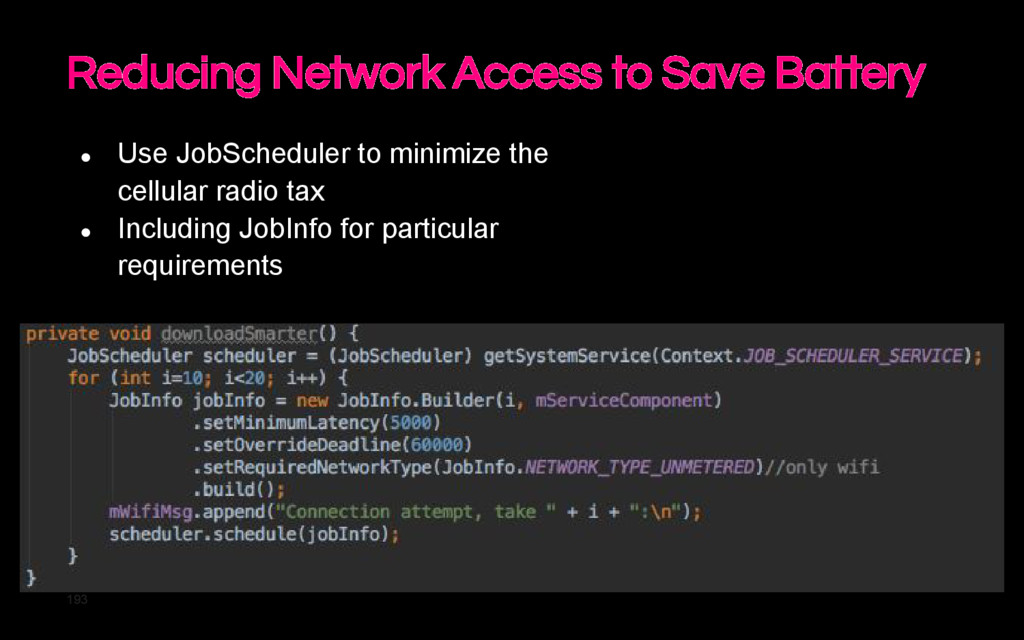
improve battery performance and efficiency. ◦ android.app.job.JobService ◦ JobService always runs in main UI thread, then it’s important to better use a separate thread to do asynchronous work
improve battery performance and efficiency. ◦ android.app.job.JobService ◦ JobService always runs in main UI thread, then it’s important to better use a separate thread to do asynchronous work • We can define jobs to run even only when the device is plugged in
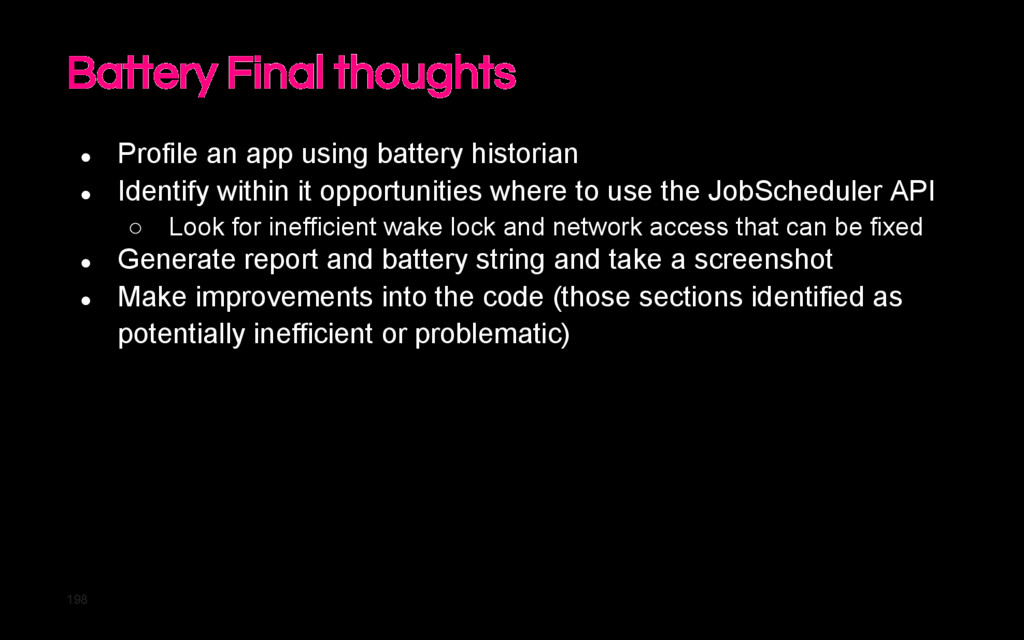
historian • Identify within it opportunities where to use the JobScheduler API ◦ Look for inefficient wake lock and network access that can be fixed • Generate report and battery string and take a screenshot
historian • Identify within it opportunities where to use the JobScheduler API ◦ Look for inefficient wake lock and network access that can be fixed • Generate report and battery string and take a screenshot • Make improvements into the code (those sections identified as potentially inefficient or problematic)
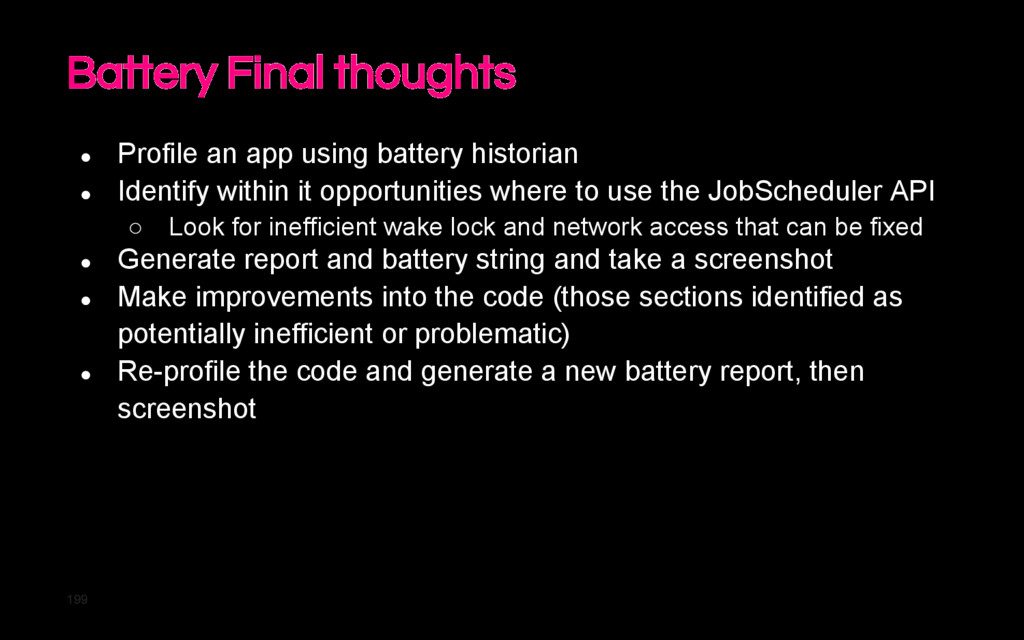
historian • Identify within it opportunities where to use the JobScheduler API ◦ Look for inefficient wake lock and network access that can be fixed • Generate report and battery string and take a screenshot • Make improvements into the code (those sections identified as potentially inefficient or problematic) • Re-profile the code and generate a new battery report, then screenshot
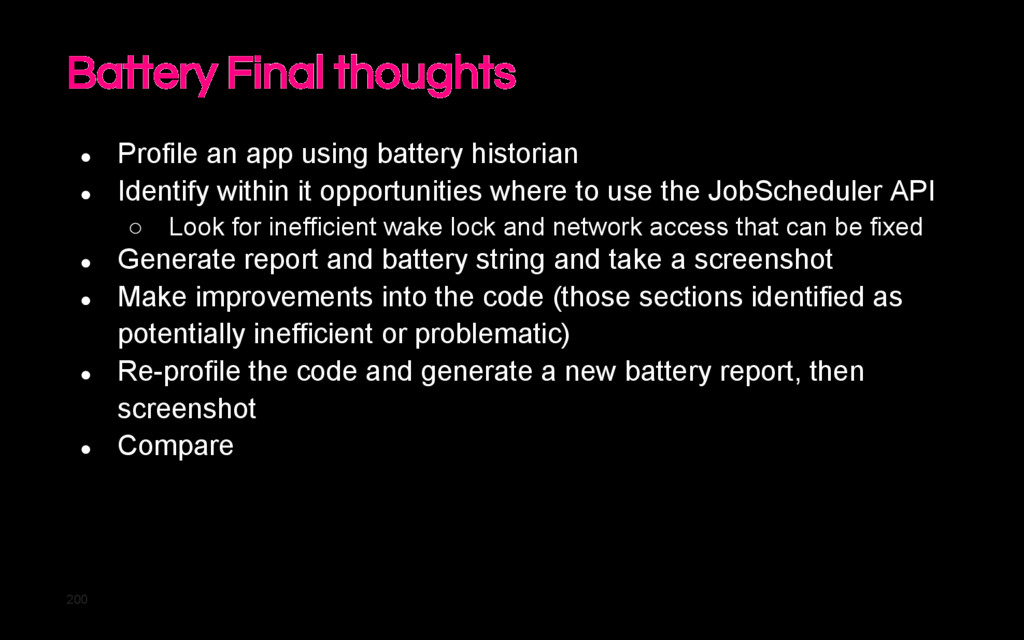
historian • Identify within it opportunities where to use the JobScheduler API ◦ Look for inefficient wake lock and network access that can be fixed • Generate report and battery string and take a screenshot • Make improvements into the code (those sections identified as potentially inefficient or problematic) • Re-profile the code and generate a new battery report, then screenshot • Compare
![Carlos Daniel Munoz I. - Android Dev @cdmunozi [email protected] Co-Founder](https://files.speakerdeck.com/presentations/857fee6a7d1648d6a396e05710b13cf2/slide_1.jpg)