Upgrade to Pro
— share decks privately, control downloads, hide ads and more …
Speaker Deck
Features
Speaker Deck
PRO
Sign in
Sign up for free
Search
Search
Composing data visualizations in Ember
Search
Chris Henn
March 03, 2015
Technology
980
0
Share
Embed
Copy iframe code
Copy JS code
Copy link
Start on current slide
Composing data visualizations in Ember
Chris Henn
March 03, 2015
Other Decks in Technology
See All in Technology
Keeping applications secure by evolving OAuth 2.0 and OpenID Connect
ahus1
PRO
1
150
テスト設計の本質を改めて考えてみる~生成AIを活用する時代だからこそ、作ったテストの説明性を高めよう~
yamasaki696
1
330
20260702_生成AIはどこまで成長するのか_チャットだけじゃない世界
doradora09
PRO
0
100
AIで政治は変わるのか? — 中高生と考えたAI時代の民主主義(東海高校サタデープログラム)
eitarosuda
0
390
知らん間に、回ってる
ming_ayami
0
140
Foxgloveについて 実際にExtensionを開発して公開するまでの話 / About Foxglove: The Story of Developing and Releasing an Extension
ry0_ka
0
160
Amazon EVS で VCF 9.0 / 9.1 のサポート開始まとめ
mtoyoda
0
260
どうして今サーバーサイドKotlinを選択したのか
nealle
0
200
GuardrailからGovernanceへ~AIエージェント運用の次の課題~
sbspsy
1
210
型は壁、Rustでもバグを直すな、表現できなくせよ
nwiizo
12
1.5k
ループエンジニアリングでE2Eテストを実践
noriyukitakei
0
290
Terraform共通モジュールをチーム横断で“変えられる”運用へ ― リリースと適用の分離
kekke_n
0
540
Featured
See All Featured
Automating Front-end Workflow
addyosmani
1370
210k
StorybookのUI Testing Handbookを読んだ
zakiyama
31
6.8k
svc-hook: hooking system calls on ARM64 by binary rewriting
retrage
2
330
Navigating Team Friction
lara
192
16k
Become a Pro
speakerdeck
PRO
31
6k
Building a A Zero-Code AI SEO Workflow
portentint
PRO
0
630
Getting science done with accelerated Python computing platforms
jacobtomlinson
2
250
Measuring Dark Social's Impact On Conversion and Attribution
stephenakadiri
2
230
The Art of Delivering Value - GDevCon NA Keynote
reverentgeek
16
2k
Side Projects
sachag
455
43k
Unlocking the hidden potential of vector embeddings in international SEO
frankvandijk
0
860
4 Signs Your Business is Dying
shpigford
187
22k
Transcript
Composing Data Visualizations in Ember Chris Henn · chnn/composing-graphics
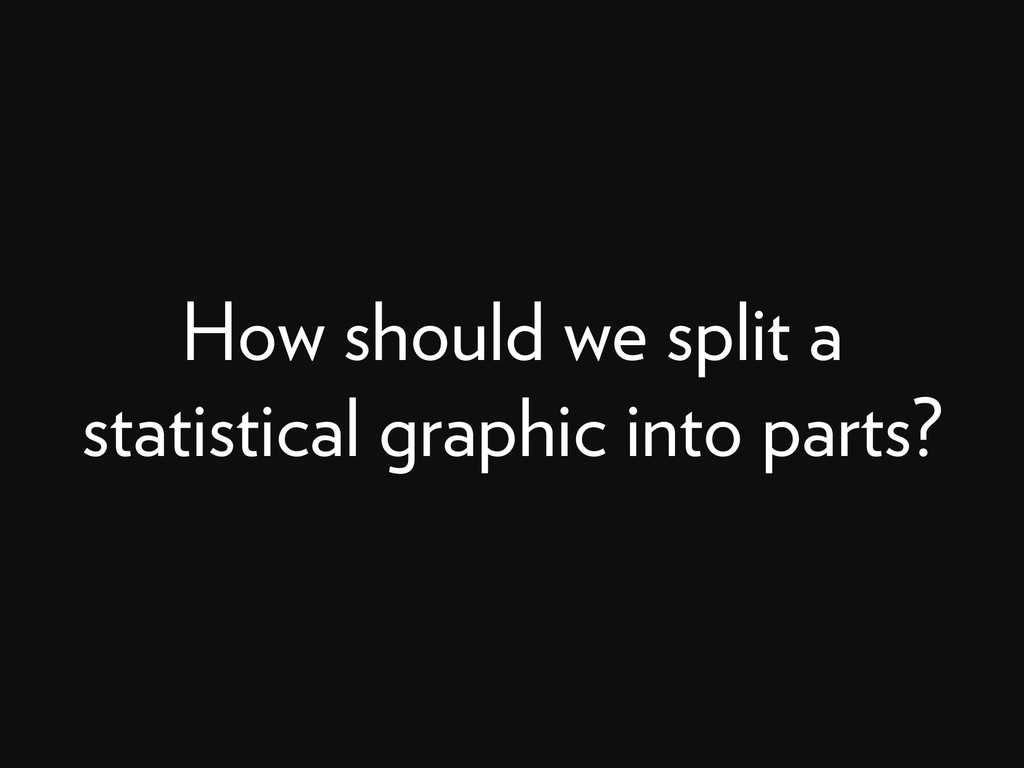
How should we split a statistical graphic into parts?
• Lets us change one feature of the graphic at
a time • Suggests the aspects of a plot that are possible to change • Encourages custom visualizations for every data situation
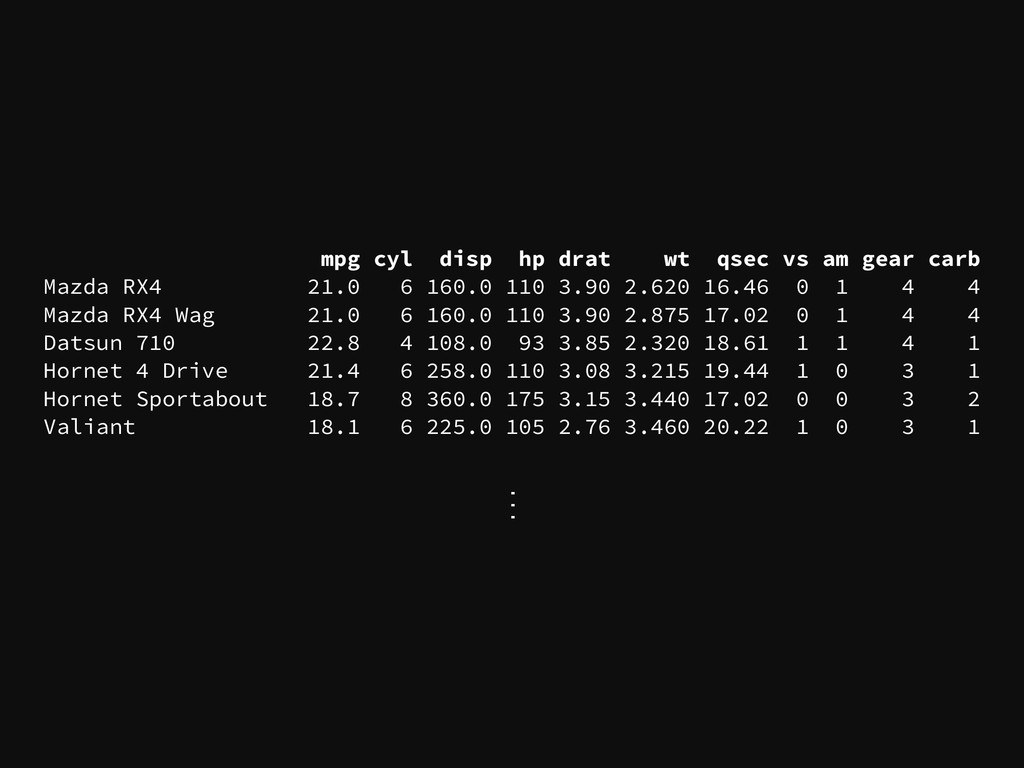
mpg cyl disp hp drat wt qsec vs am gear
carb Mazda RX4 21.0 6 160.0 110 3.90 2.620 16.46 0 1 4 4 Mazda RX4 Wag 21.0 6 160.0 110 3.90 2.875 17.02 0 1 4 4 Datsun 710 22.8 4 108.0 93 3.85 2.320 18.61 1 1 4 1 Hornet 4 Drive 21.4 6 258.0 110 3.08 3.215 19.44 1 0 3 1 Hornet Sportabout 18.7 8 360.0 175 3.15 3.440 17.02 0 0 3 2 Valiant 18.1 6 225.0 105 2.76 3.460 20.22 1 0 3 1 …
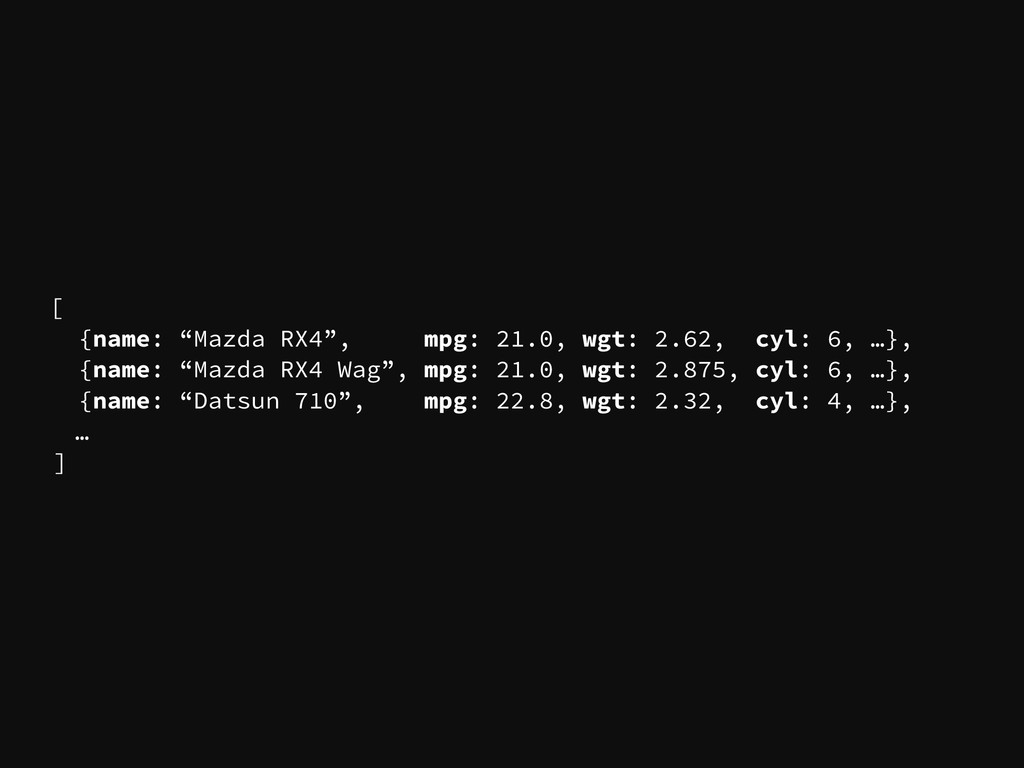
[ {name: “Mazda RX4”, mpg: 21.0, wgt: 2.62, cyl: 6,
…}, {name: “Mazda RX4 Wag”, mpg: 21.0, wgt: 2.875, cyl: 6, …}, {name: “Datsun 710”, mpg: 22.8, wgt: 2.32, cyl: 4, …}, … ]
Demo
Hadley Wickham’s Grammar of Graphics
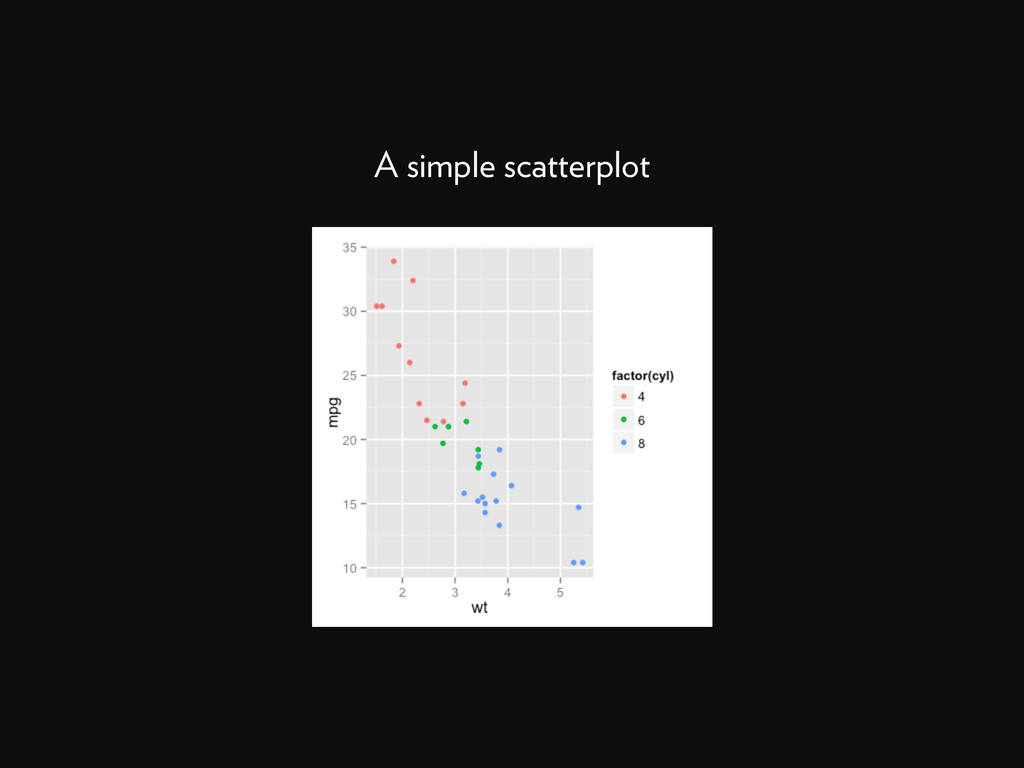
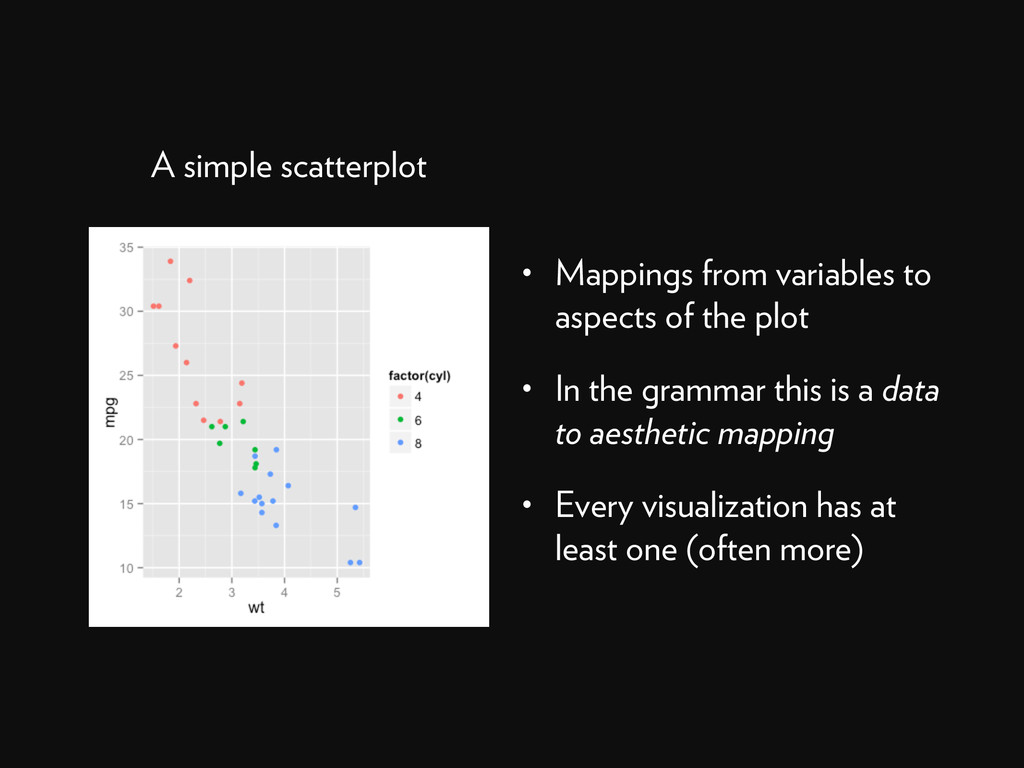
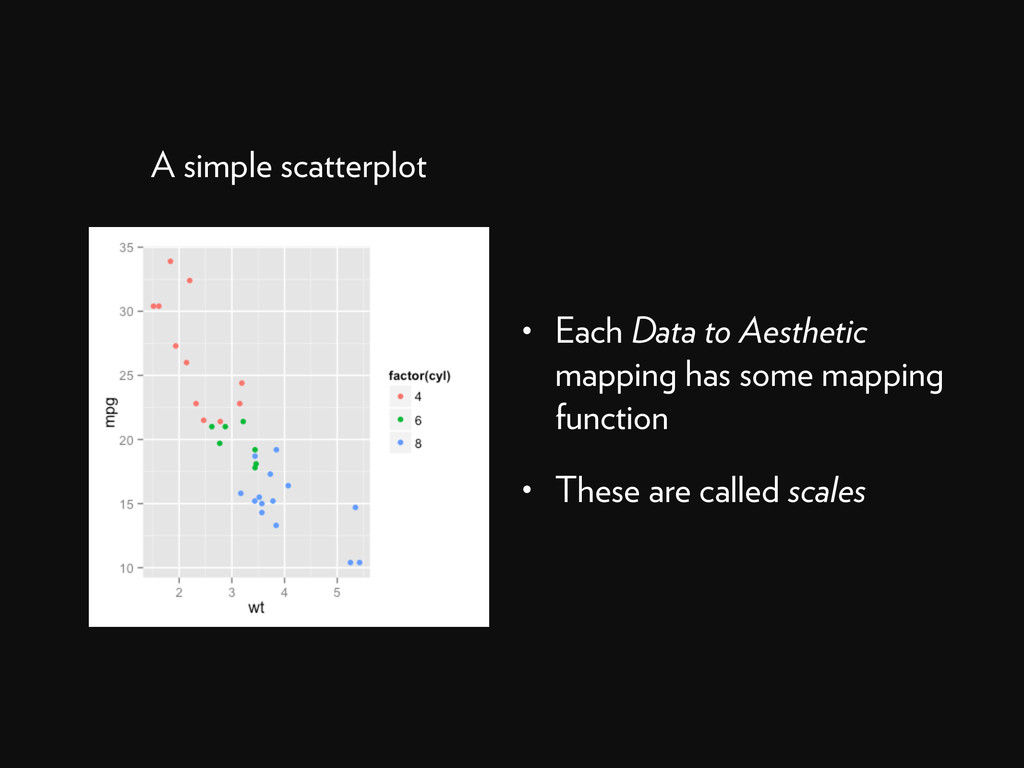
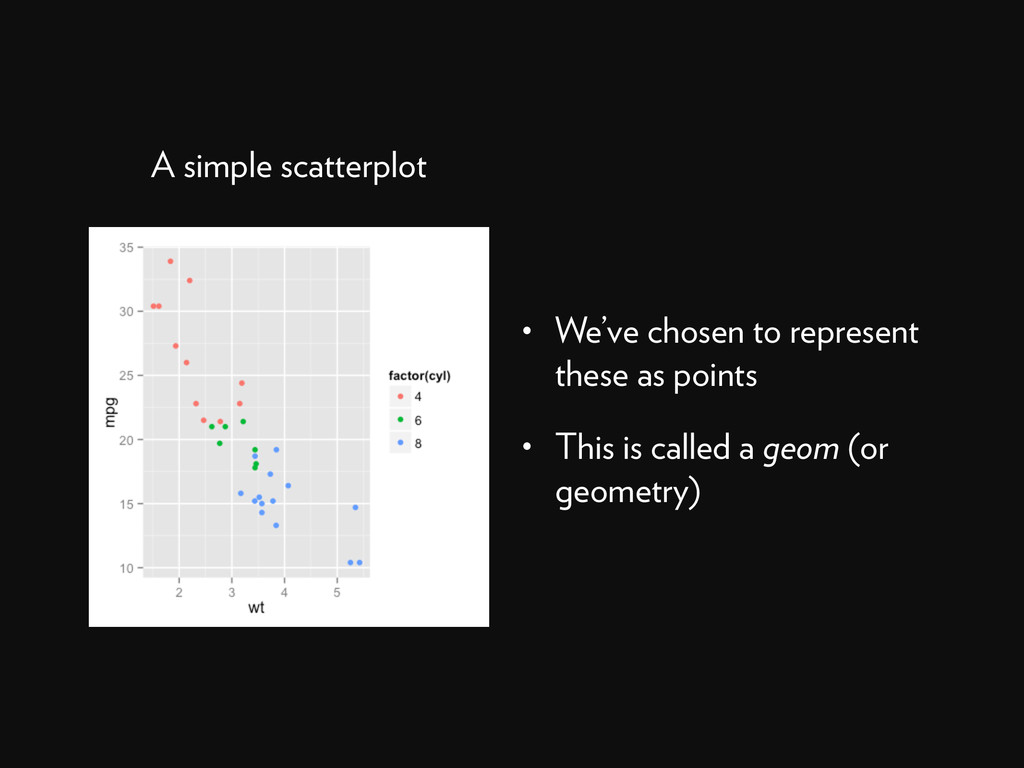
A simple scatterplot
A simple scatterplot • Mappings from variables to aspects of
the plot • In the grammar this is a data to aesthetic mapping • Every visualization has at least one (often more)
A simple scatterplot • Each Data to Aesthetic mapping has
some mapping function • These are called scales
A simple scatterplot • We’ve chosen to represent these as
points • This is called a geom (or geometry)
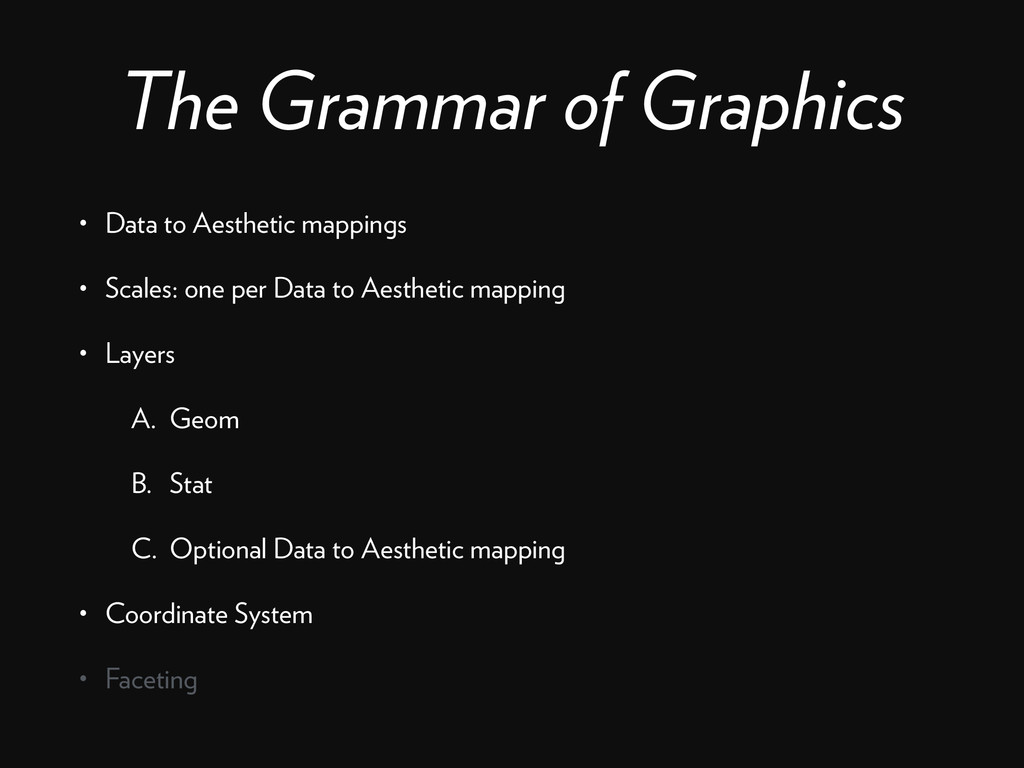
The Grammar of Graphics • Data to Aesthetic mappings •
Scales: one per Data to Aesthetic mapping • Layers A. Geom B. Stat C. Optional Data to Aesthetic mapping • Coordinate System • Faceting
What does this look like using Ember?
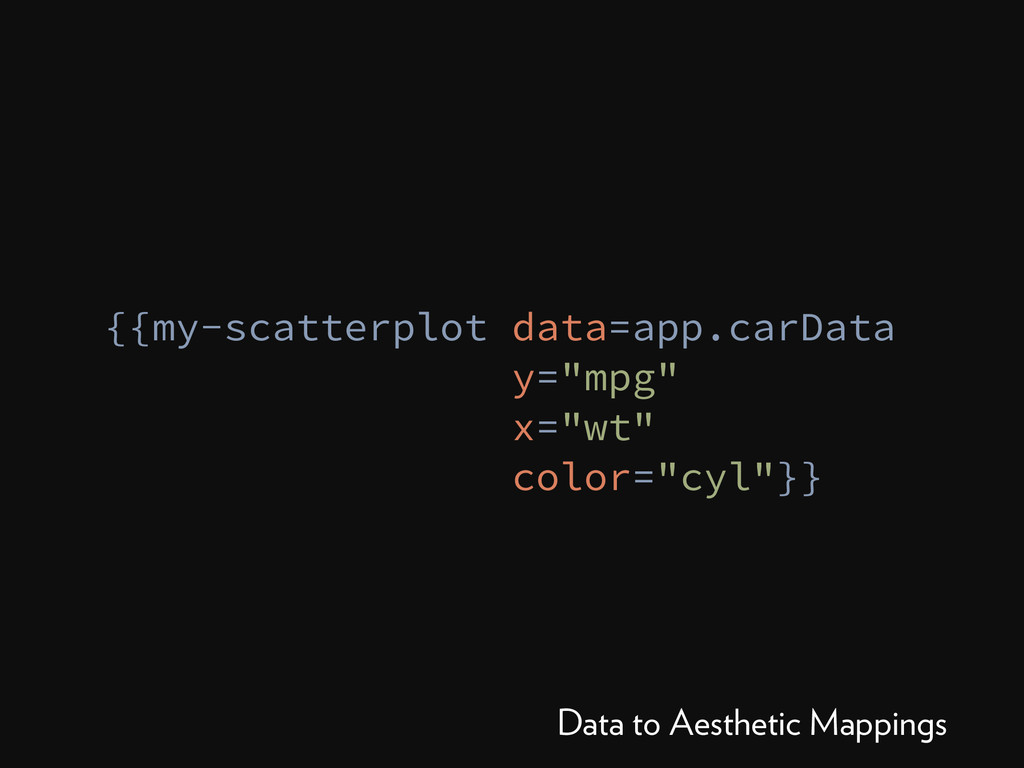
Data to Aesthetic Mappings
{{my-scatterplot data=app.carData y="mpg" x="wt" color="cyl"}} Data to Aesthetic Mappings
Scales
// Some scale constructor var scale = linearScale([0, 10], [0,
300]); scale(5) // => 150 scale.invert(150) // => 5 Scales
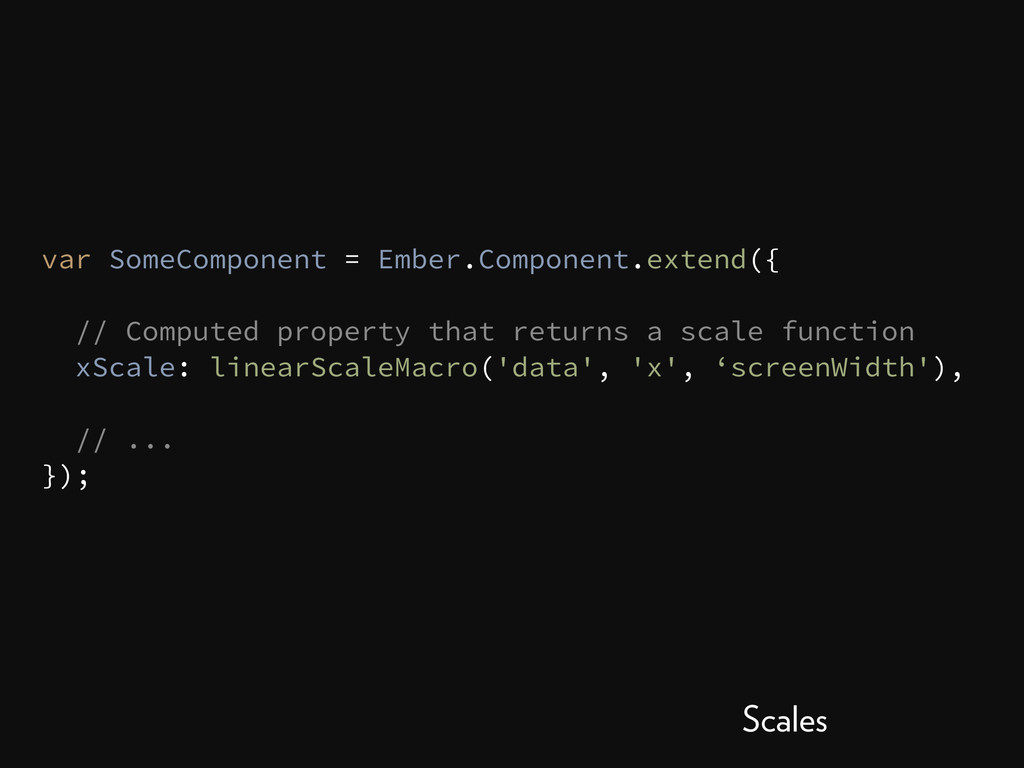
var SomeComponent = Ember.Component.extend({ // Computed property that returns a
scale function xScale: linearScaleMacro('data', 'x', ‘screenWidth'), // ... }); Scales
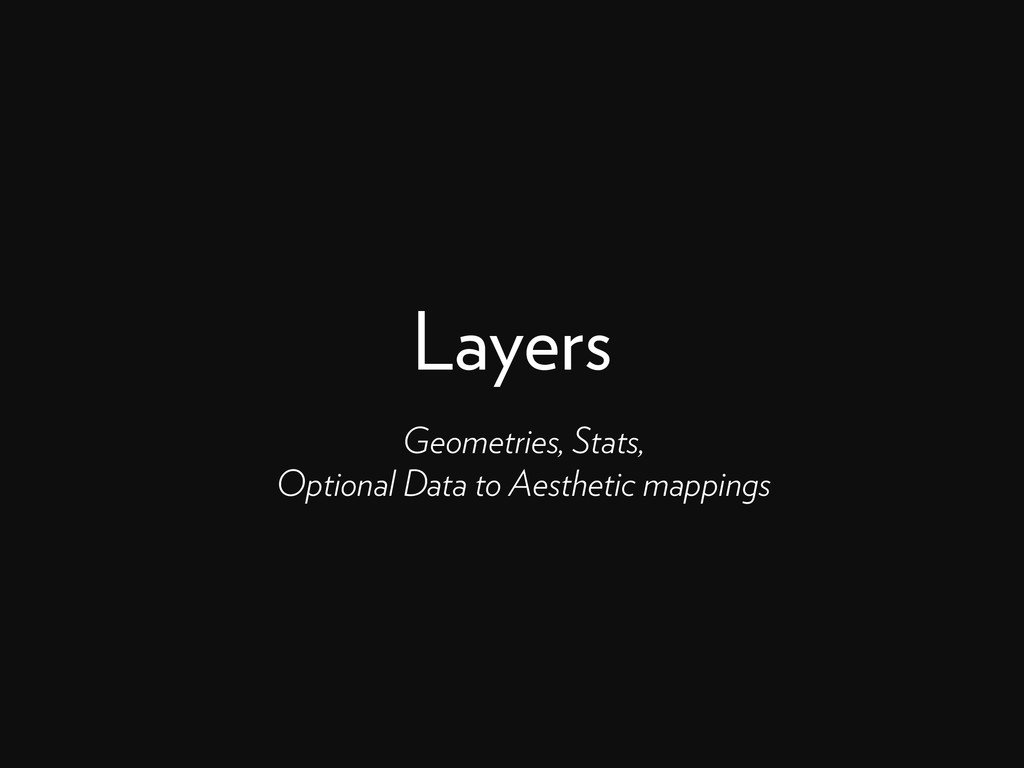
Layers Geometries, Stats, Optional Data to Aesthetic mappings
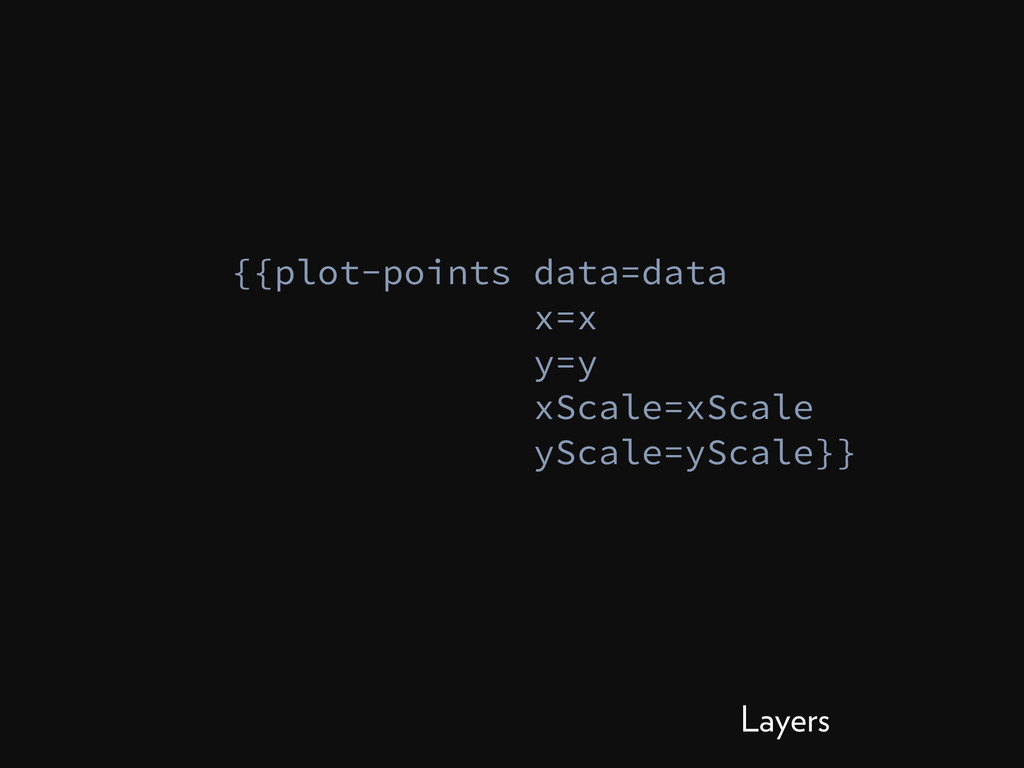
{{plot-points data=data x=x y=y xScale=xScale yScale=yScale}} Layers
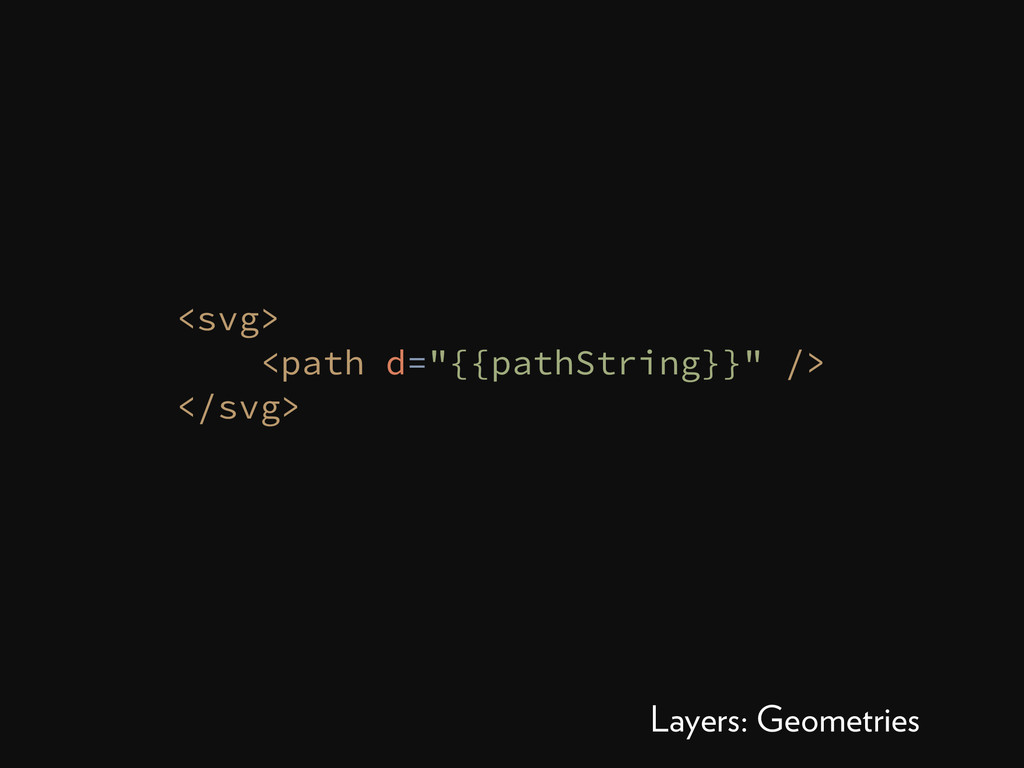
<svg> <path d="{{pathString}}" /> </svg> Layers: Geometries
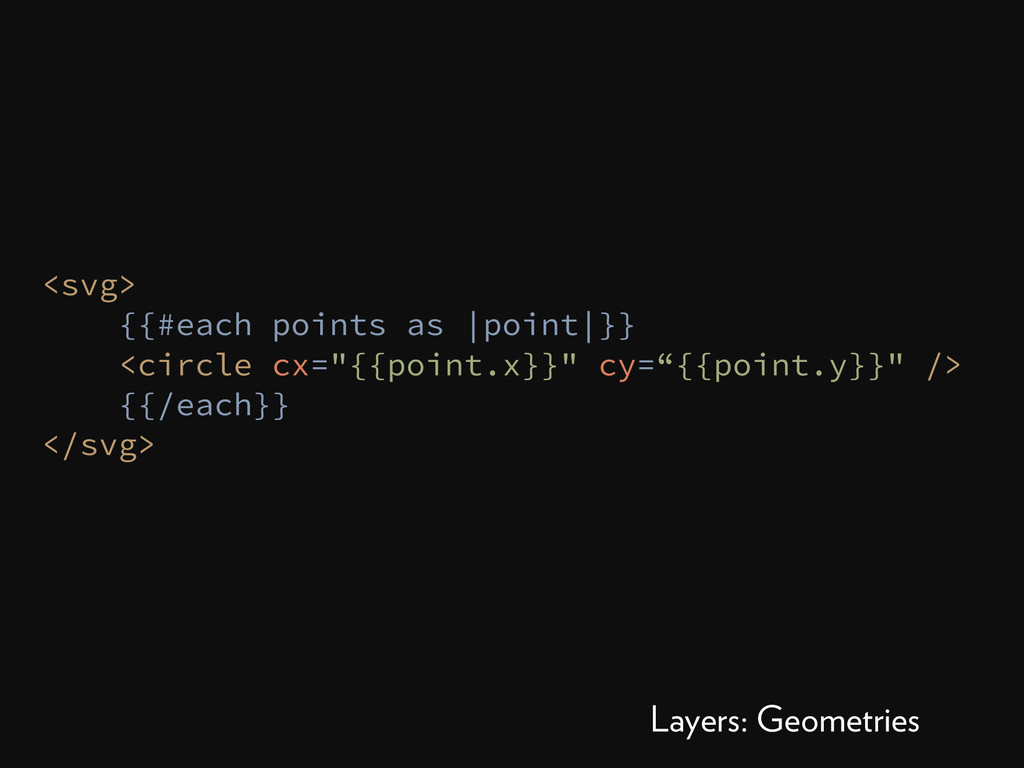
<svg> {{#each points as |point|}} <circle cx="{{point.x}}" cy=“{{point.y}}" /> {{/each}}
</svg> Layers: Geometries
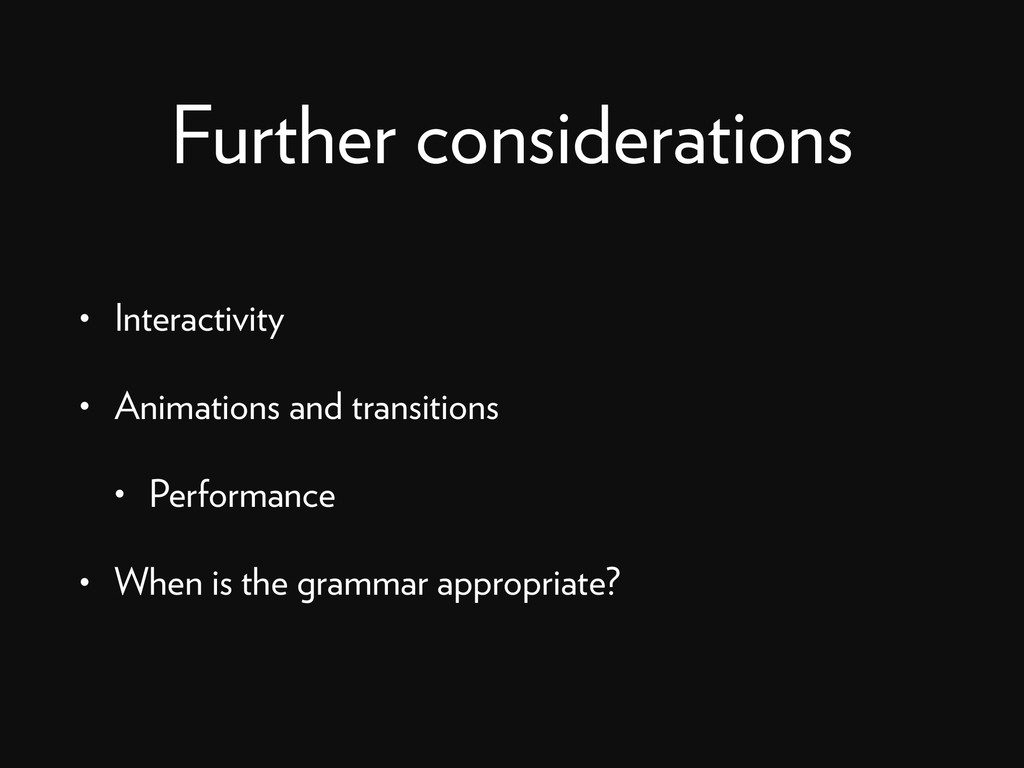
Further considerations • Interactivity • Animations and transitions • Performance
• When is the grammar appropriate?
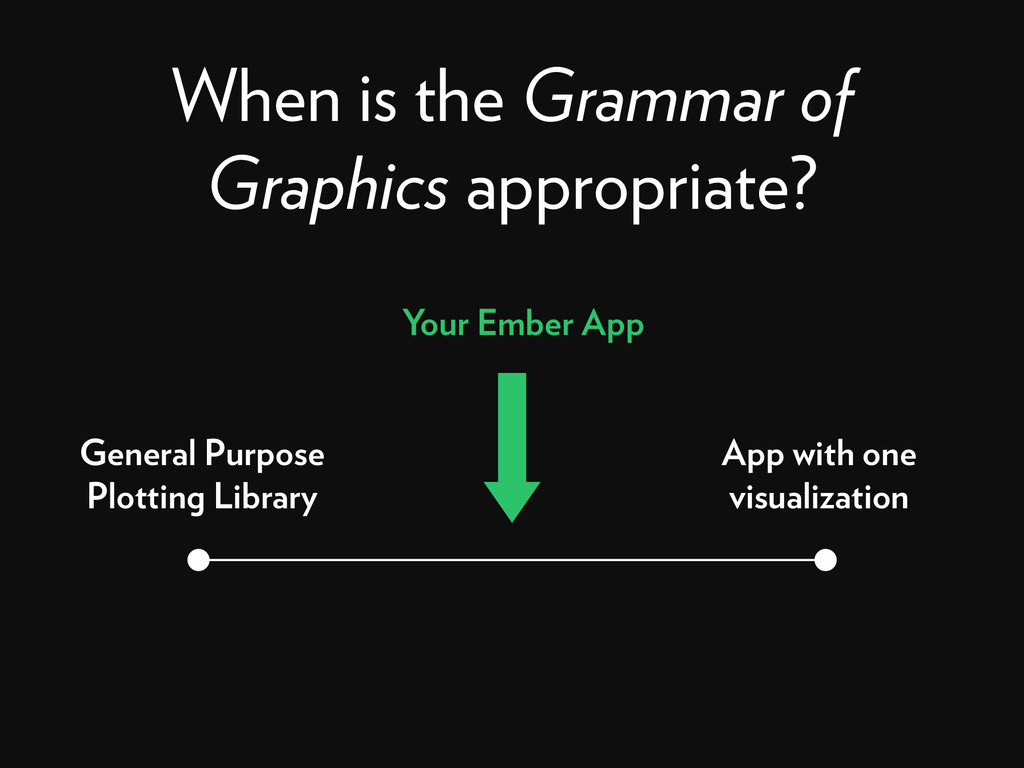
When is the Grammar of Graphics appropriate? General Purpose Plotting
Library App with one visualization Your Ember App
Questions? chrishenn.net twitter: @cwhnn github: @chnn
![// Some scale constructor var scale = linearScale([0, 10], [0,](https://files.speakerdeck.com/presentations/8f3bada23d084c219eb4c44353ccee7f/slide_16.jpg)