Lock in $30 Savings on PRO—Offer Ends Soon! ⏳

Demystifying CPU Profiling in Node.JS

Demystifying CPU Profiling in Node.JS

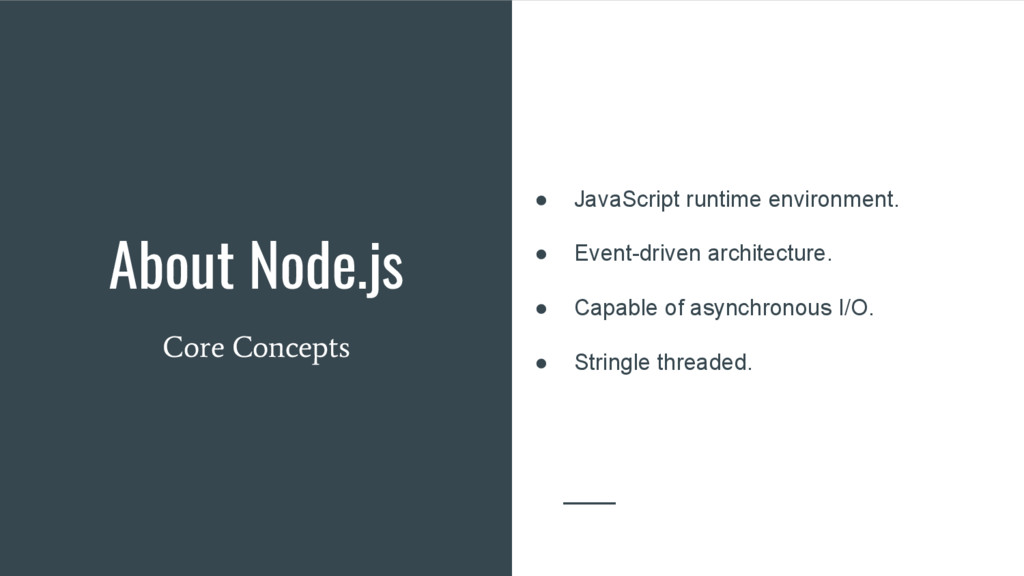
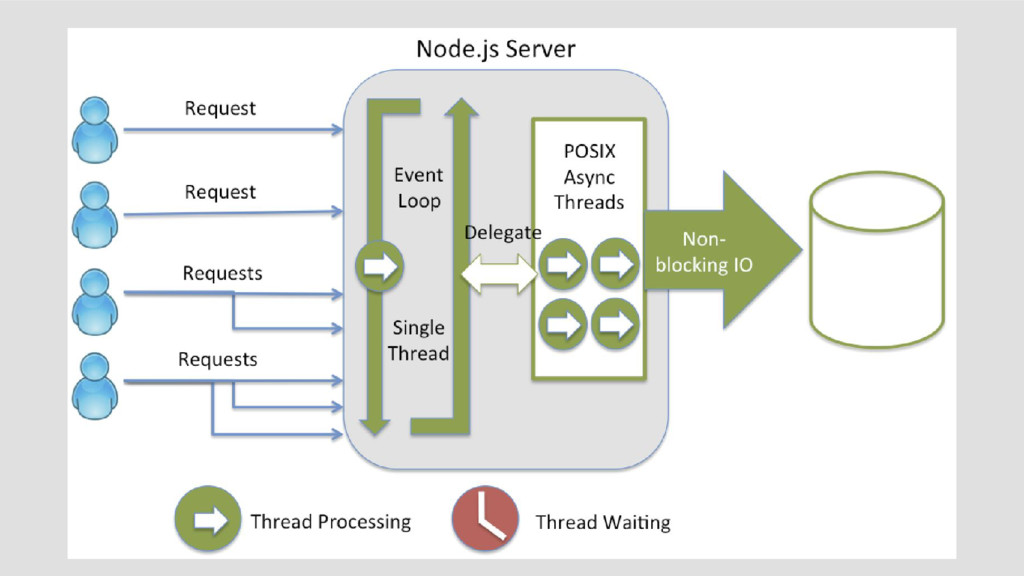
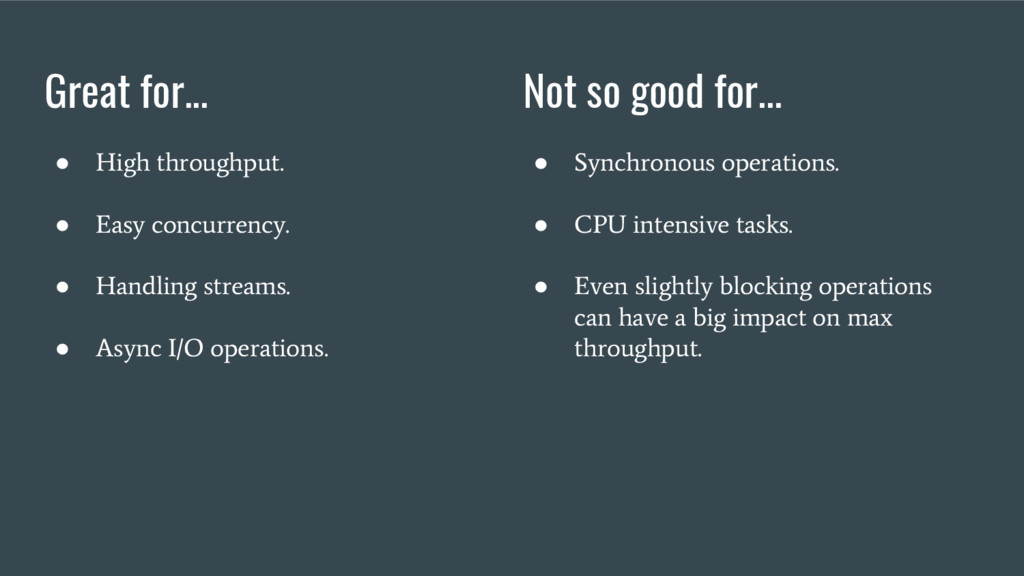
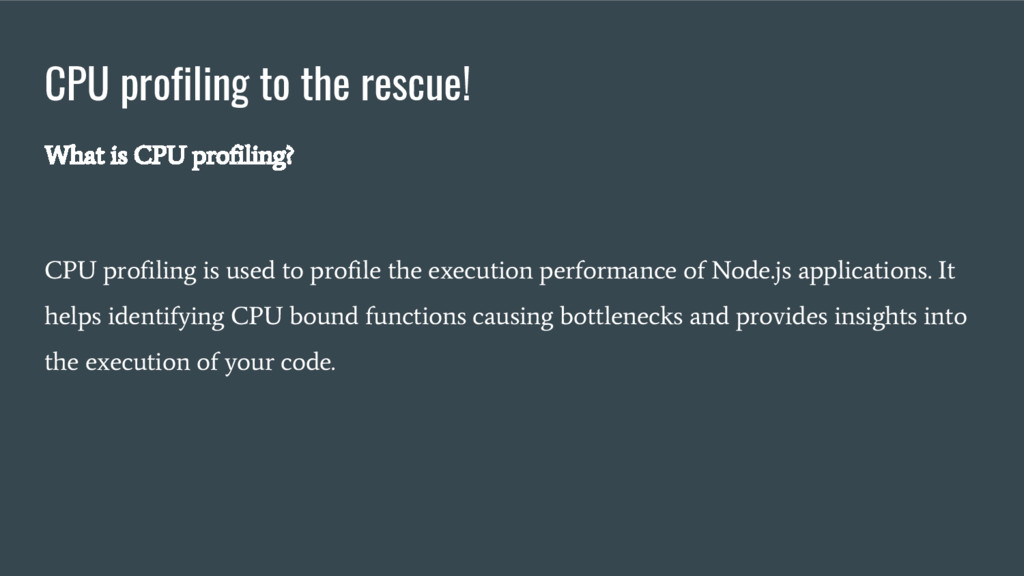
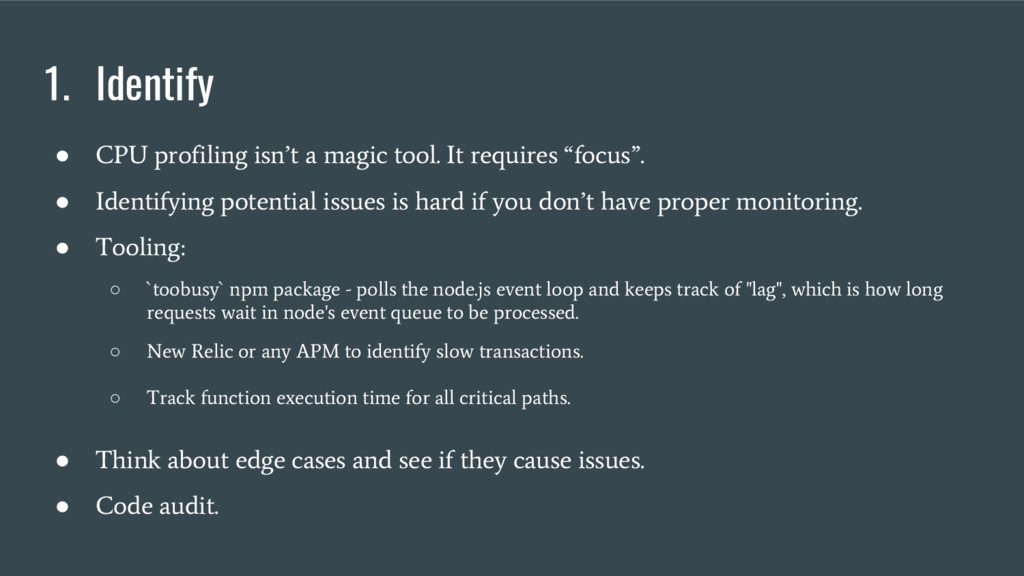
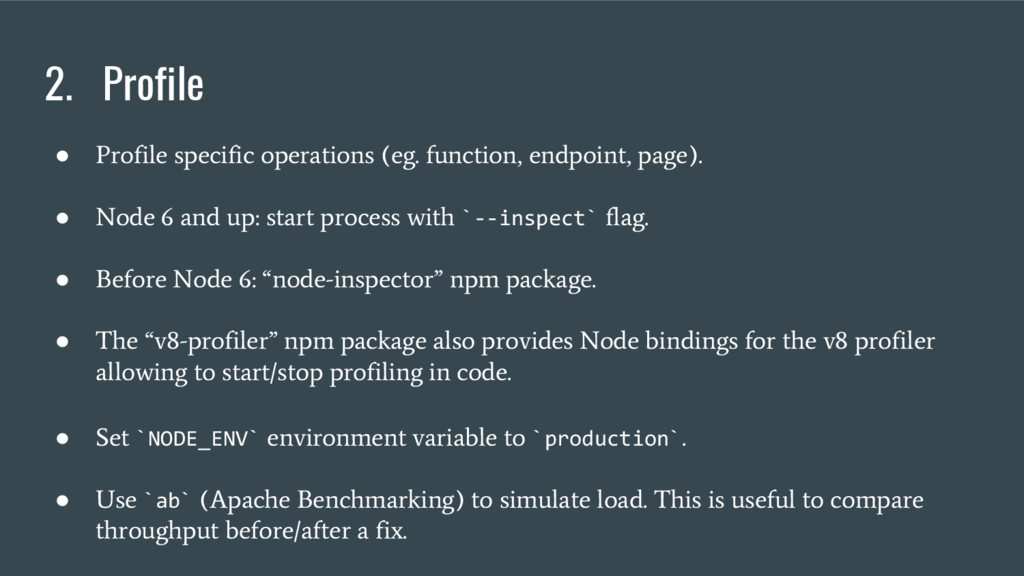
Node's event-driven and single threaded architecture enables easy concurrency and high throughput without much effort but comes at a cost. Synchronous and CPU intensive operations can lead to degraded performance and even completely block the process. CPU profiling allows developers to find blocking functions and deal with them accordingly. In this talk "learn by example" talk, we'll look at some real issues that were identified and fixed thanks to CPU profiling.

Avatar for Christophe Naud-Dulude

Christophe Naud-Dulude

March 14, 2017
Tweet

Other Decks in Technology

Transcript

  1. About Me • I’m Chris. • Backend developer at Busbud.

    • Our stack is Node.js. Everywhere. • We’re hiring. Hi.
  2. About Node.js • JavaScript runtime environment. • Event-driven architecture. •

    Capable of asynchronous I/O. • Stringle threaded. Core Concepts
  3. Great for... • High throughput. • Easy concurrency. • Handling

    streams. • Async I/O operations. Not so good for... • Synchronous operations. • CPU intensive tasks. • Even slightly blocking operations can have a big impact on max throughput.
  4. CPU profiling to the rescue! What is CPU profiling? CPU

    profiling is used to profile the execution performance of Node.js applications. It helps identifying CPU bound functions causing bottlenecks and provides insights into the execution of your code.
  5. CPU profiling to the rescue! Methodology: 1. Identify potential issues

    (slow/blocking code). 2. Profile. 3. Correct and improve. 4. Repeat.
  6. 1. Identify • CPU profiling isn’t a magic tool. It

    requires “focus”. • Identifying potential issues is hard if you don’t have proper monitoring. • Tooling: ◦ `toobusy` npm package - polls the node.js event loop and keeps track of "lag", which is how long requests wait in node's event queue to be processed. ◦ New Relic or any APM to identify slow transactions. ◦ Track function execution time for all critical paths. • Think about edge cases and see if they cause issues. • Code audit.
  7. 2. Profile • Profile specific operations (eg. function, endpoint, page).

    • Node 6 and up: start process with `--inspect` flag. • Before Node 6: “node-inspector” npm package. • The “v8-profiler” npm package also provides Node bindings for the v8 profiler allowing to start/stop profiling in code. • Set `NODE_ENV` environment variable to `production` . • Use `ab` (Apache Benchmarking) to simulate load. This is useful to compare throughput before/after a fix.
  8. 1. Developer mistake + Edge case Simulate production like traffic

    with: • Run this function 200 times on JSON objects. • Most objects are small (~20 lines) with some “details”. • Some objects are big (~30 000 lines) with a lot of “details”.
  9. • Self time: How long it took to complete the

    current invocation of the function, including only the statements in the function itself, not including any functions that it called. • Total time: The time it took to complete the current invocation of this function and any functions that it called. • Aggregated time: Aggregate self/total time for all invocations of the function.
  10. 2. Performance Improvement • Good code that properly uses a

    feature provided by an external library. • No lower/upper bound edge cases. • Not particularly slow but can be improved. • Executes on HTTP request (API) so could impact throughput.
  11. 2. Performance Improvement Before: • Function aggregated total time: 35

    ms • Total time for 100 requests: 10.4 seconds • Request time: ~100 ms • Throughput ~10 req/s After: • Function aggregated total time: 5.6 ms • Total time for 100 requests: 2.8 seconds • Request time: ~27 ms • Throughput: ~35 req/s #millisecondsmatter
  12. 3. Other cases • Outdated libraries ◦ CPU profiles helped

    us identify that setting time zone properties on `moment` objects was really costly. We were using an outdated version of `moment-timezone` and after upgrading to the latest the issues were gone. We would not have found this as quickly without CPU profiling. • JSON stringify/parse ◦ Those operations are costly even on “medium size” objects. When dealing with redis and high throughput, parsing JSON can become a bottleneck. Solution: avoid loading unnecessary objects and rethink your data structures to reduce the size of objects. If that’s not enough look into alternative serialization systems.
  13. Tips + Going Further • Name your functions! Anonymous are

    really a pain to deal with when CPU profiling. • We covered the “Chart” view today. The Chrome DevTools also support the “Heavy (bottom up)” and “Tree (top down)” which provide a different way to explore CPU profiles. • The `setTimeout` trick to increase throughput. If you have few lengthy requests doing many operations over many items resulting in blocking code, put a `setTimeout` in-between operations or after each N items. Node will execute some queued events/callbacks before going back to the blocking function. Wrapping synchronous code promises is another way to achieve thi. • If your code is optimized but is still blocking: move out of web tier to achieve maximum throughput. • This CPU profiling technique works nicely in development but not in production. To profile in production look into “profiling Node with `drace` and `node-stackvis` ”.
  14. Key Takeaways • Monitor. A lot. It’s really hard to

    identify potential improvements in large projects without good monitoring. • Different type of problems that can be solved with CPU profiling: ◦ Edge cases. Code works fine and is fast in most cases but upper bound edge cases can be radically slower and reduce throughput for your whole application. ◦ Performance improvement. Everything works, code is well done and edge cases aren’t a problem but there’s a better way to solve the problem. ◦ Library misuse. Outdated, not understanding what a function really does. • Always keep blocking code in mind when developing in Node. Concurrency and high throughput come easy with Node as long as you code in accordance with the core concepts.