Upgrade to Pro — share decks privately, control downloads, hide ads and more …

CodeFest 2018. Eric Proegler (Medidata Solutions) — Interpreting Performance Test Results

CodeFest 2018. Eric Proegler (Medidata Solutions) — Interpreting Performance Test Results

Посмотрите выступление Eric: https://2018.codefest.ru/lecture/1289/

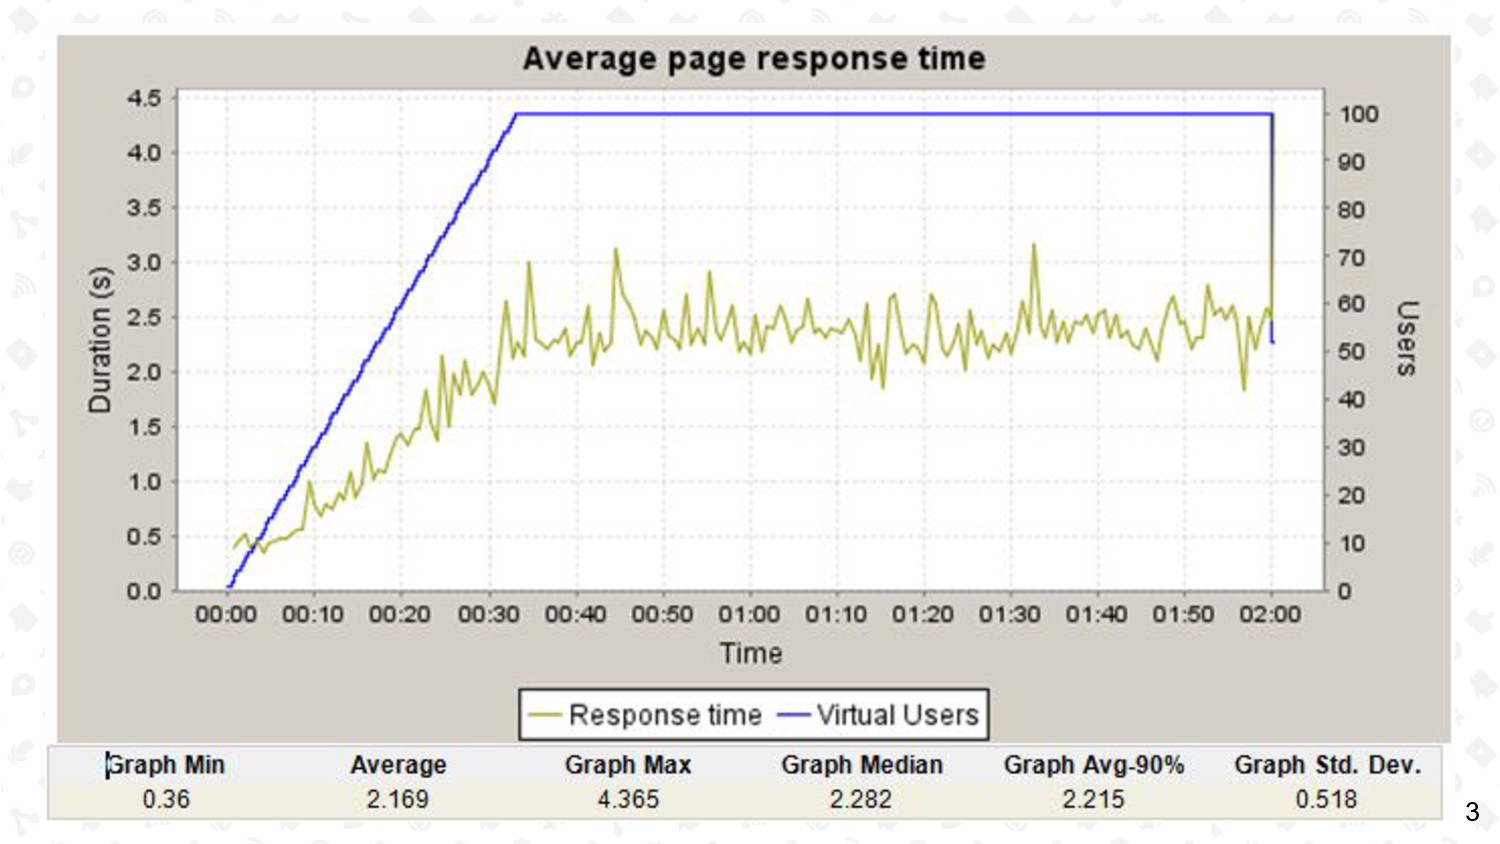
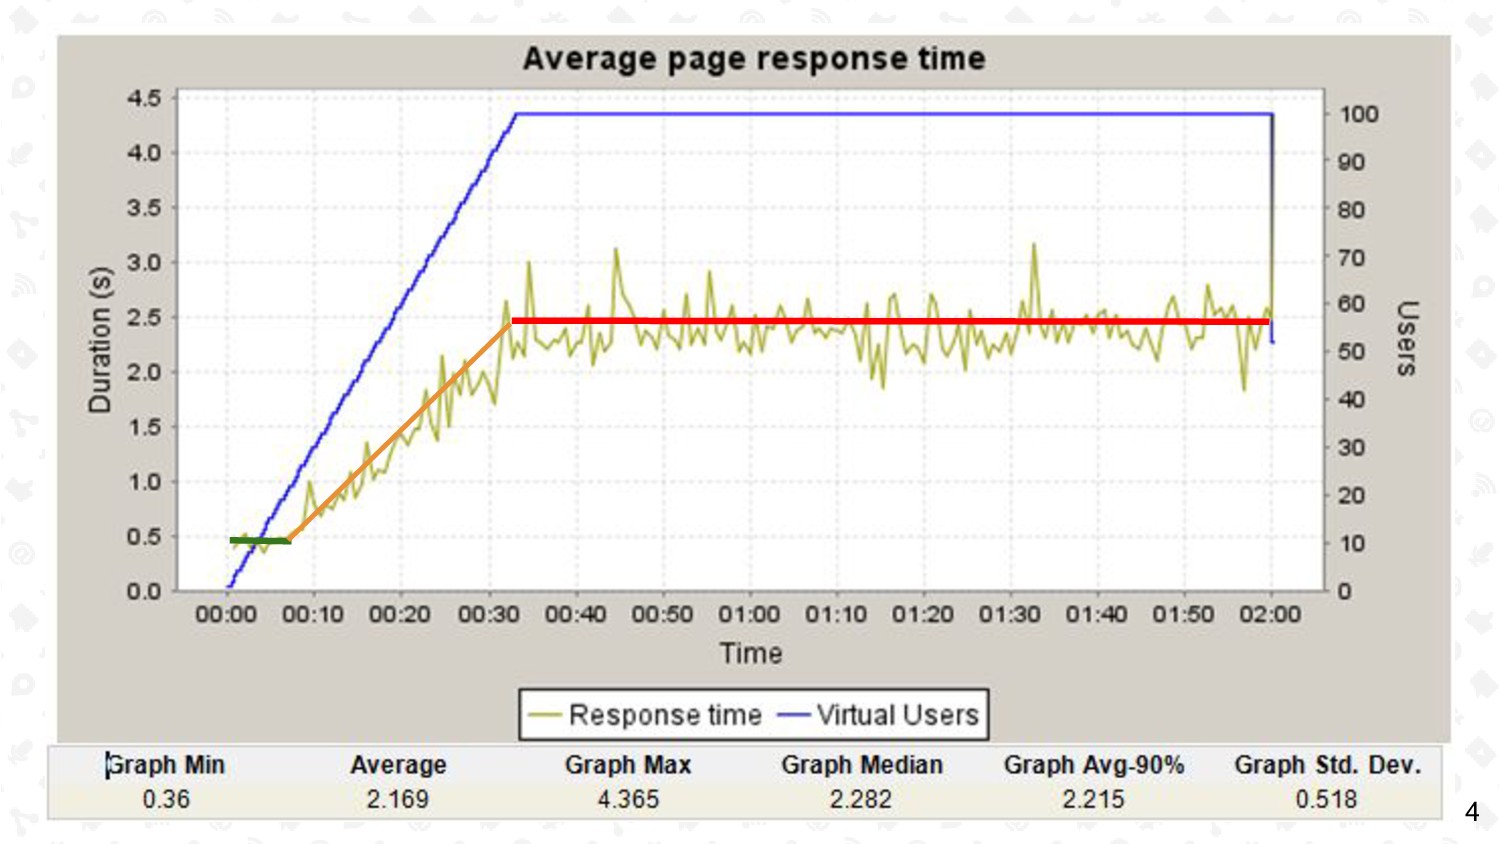
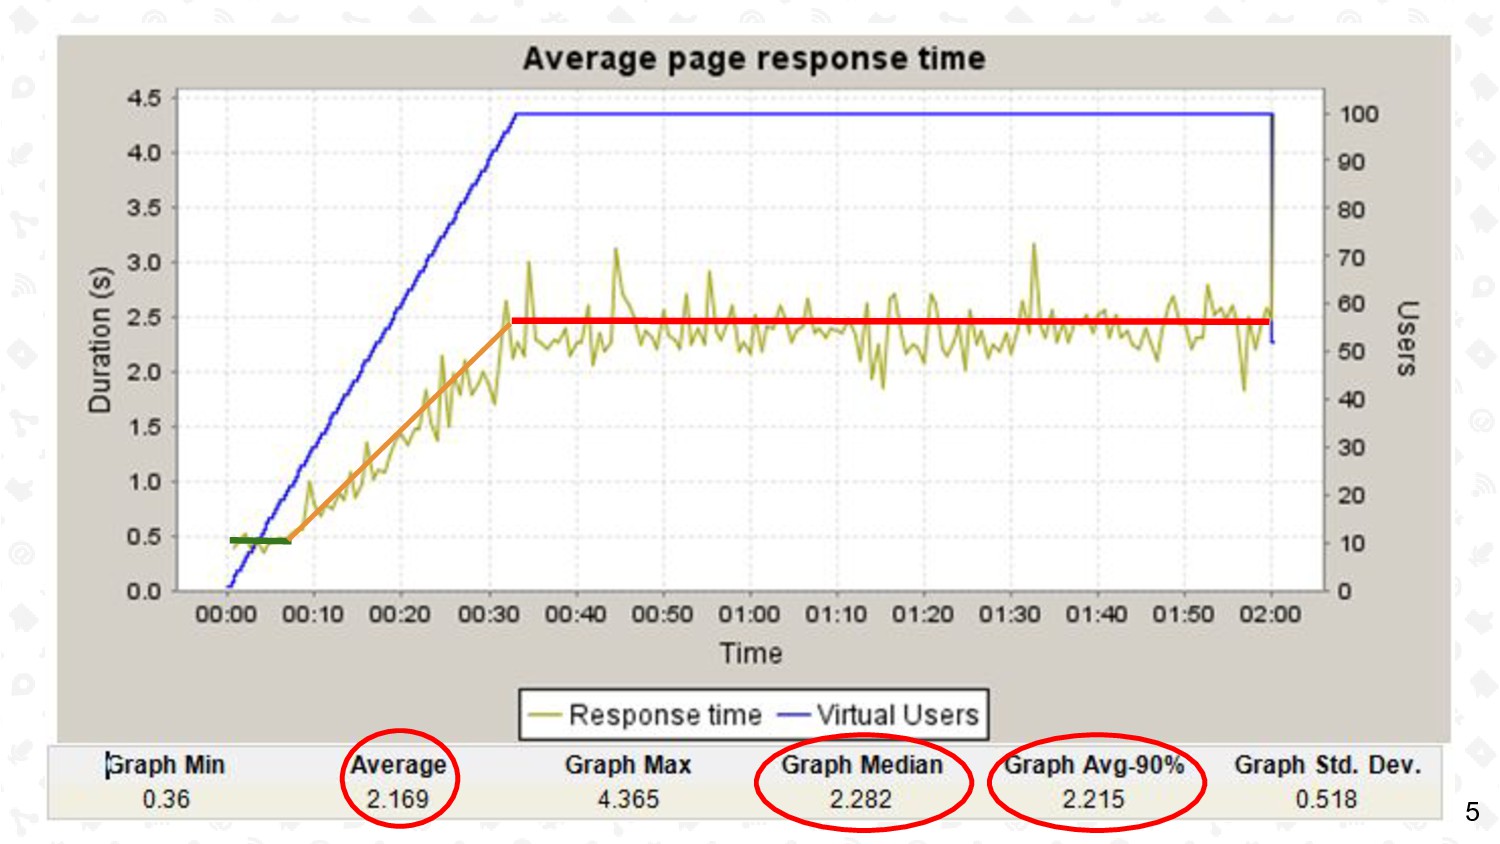
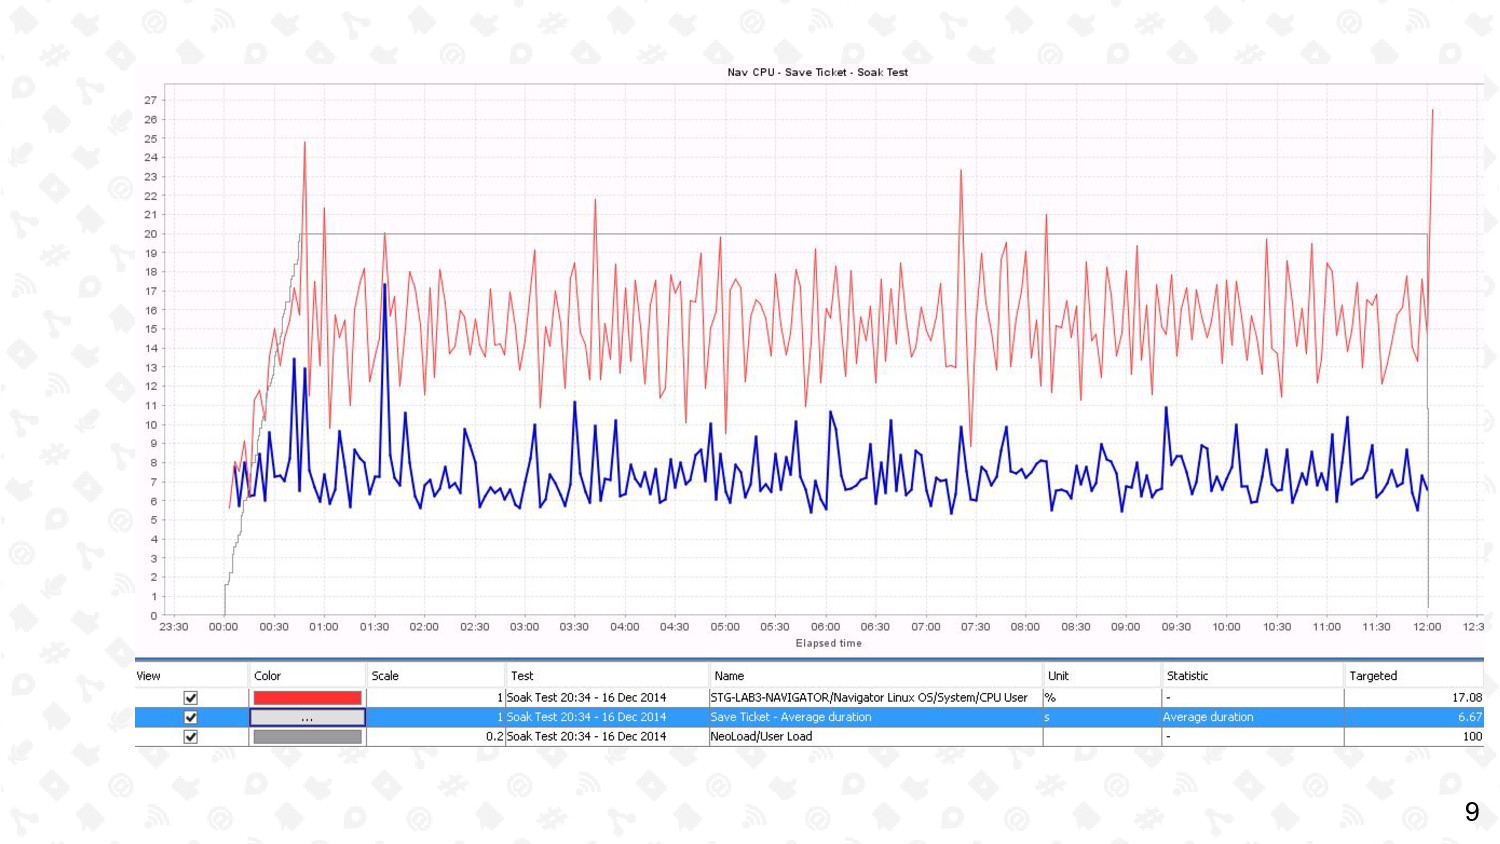
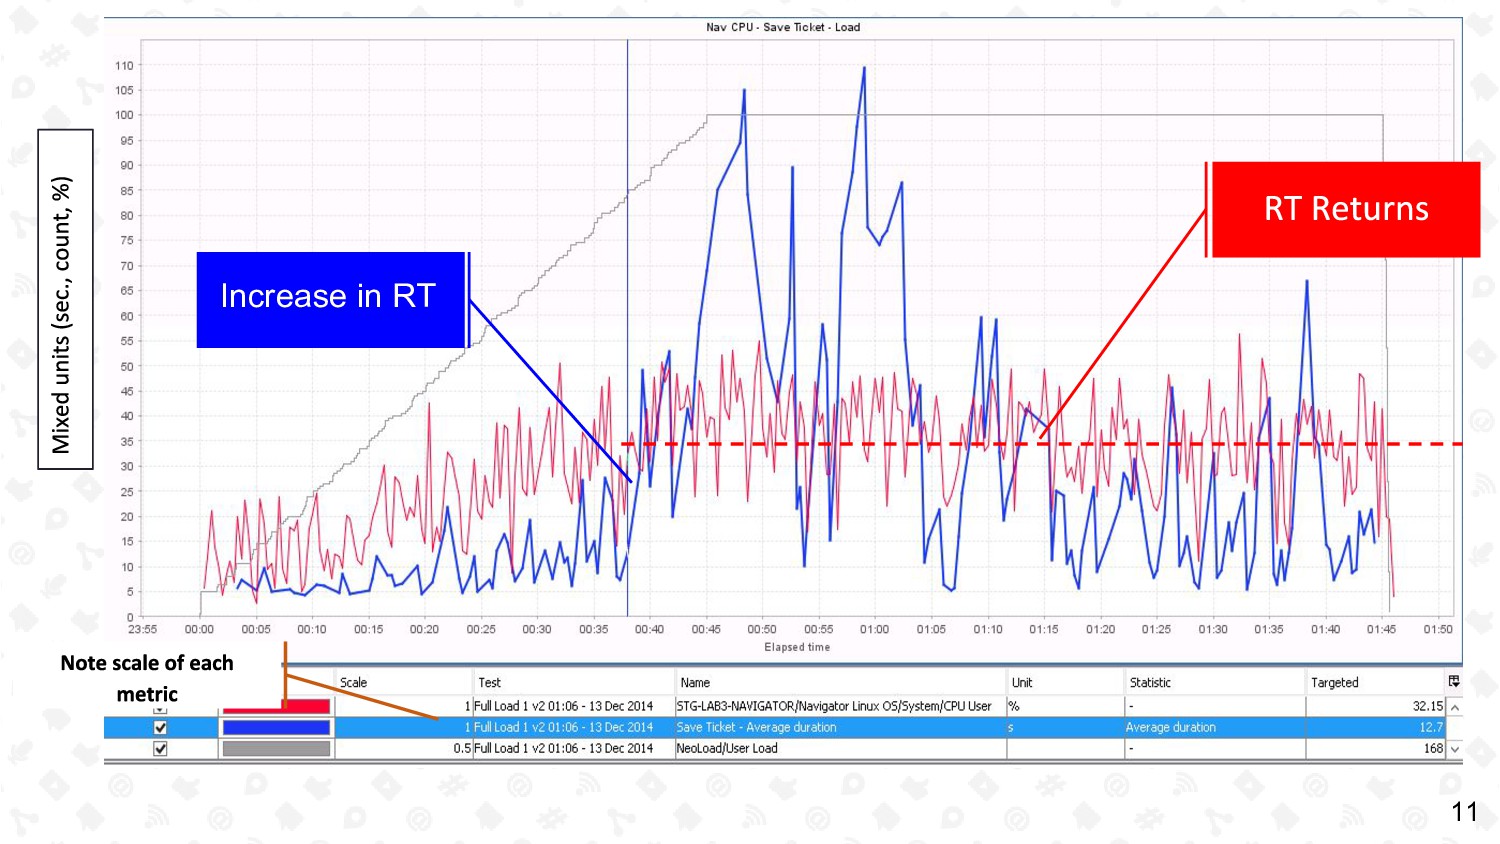
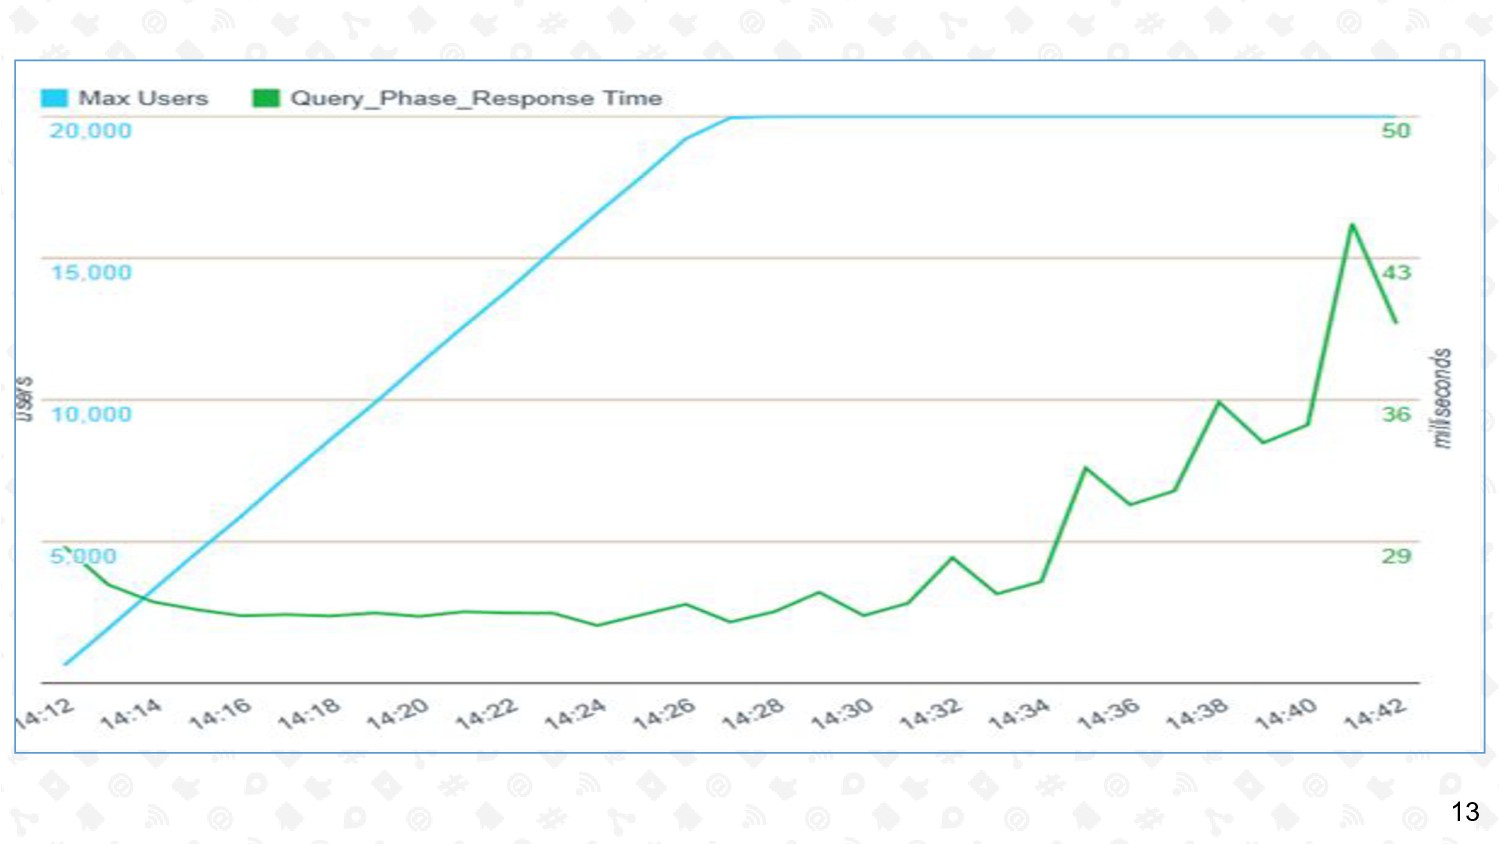
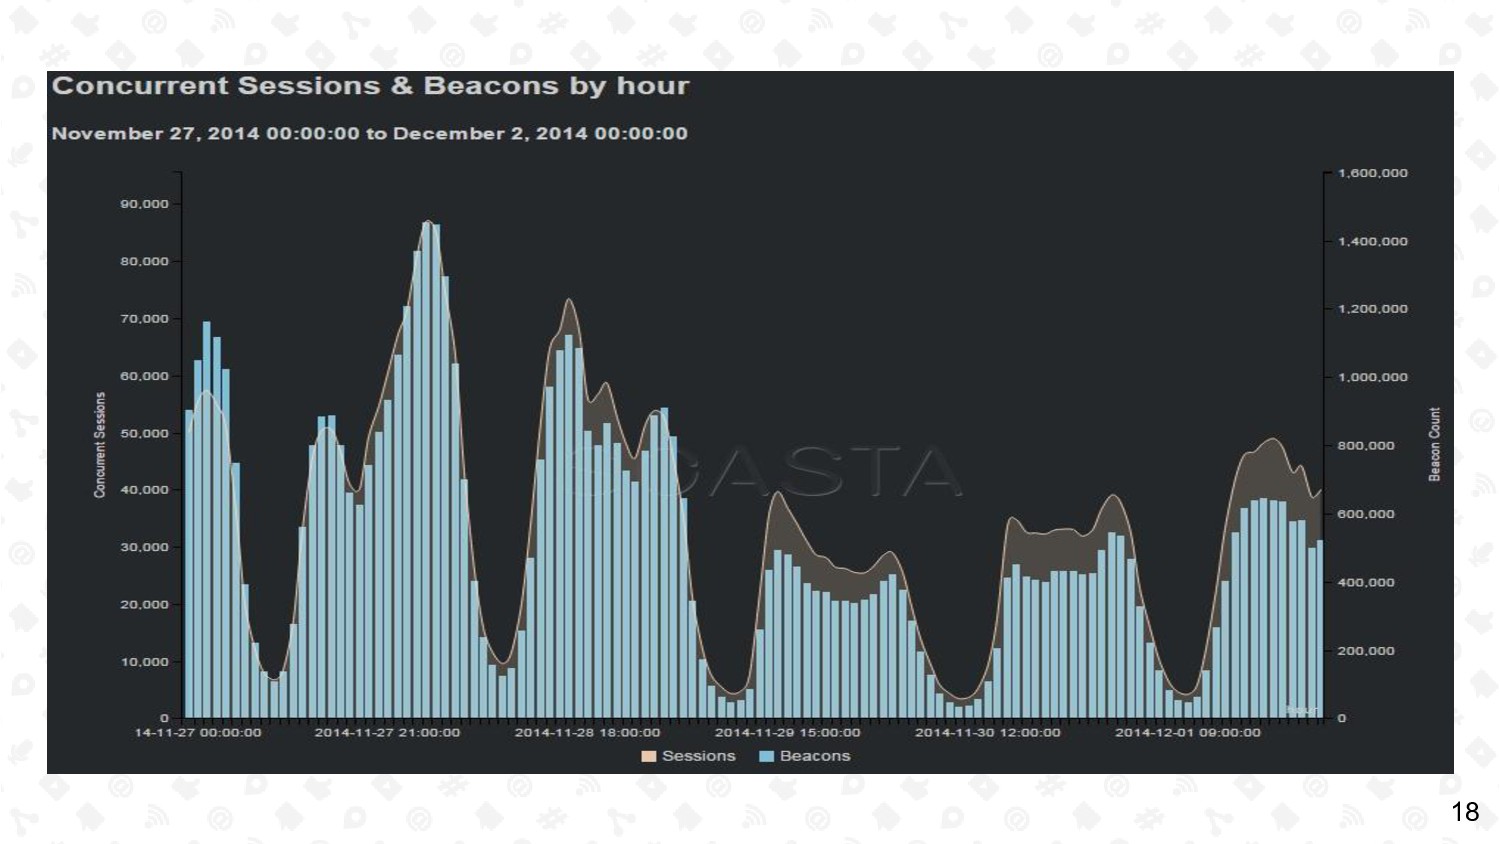
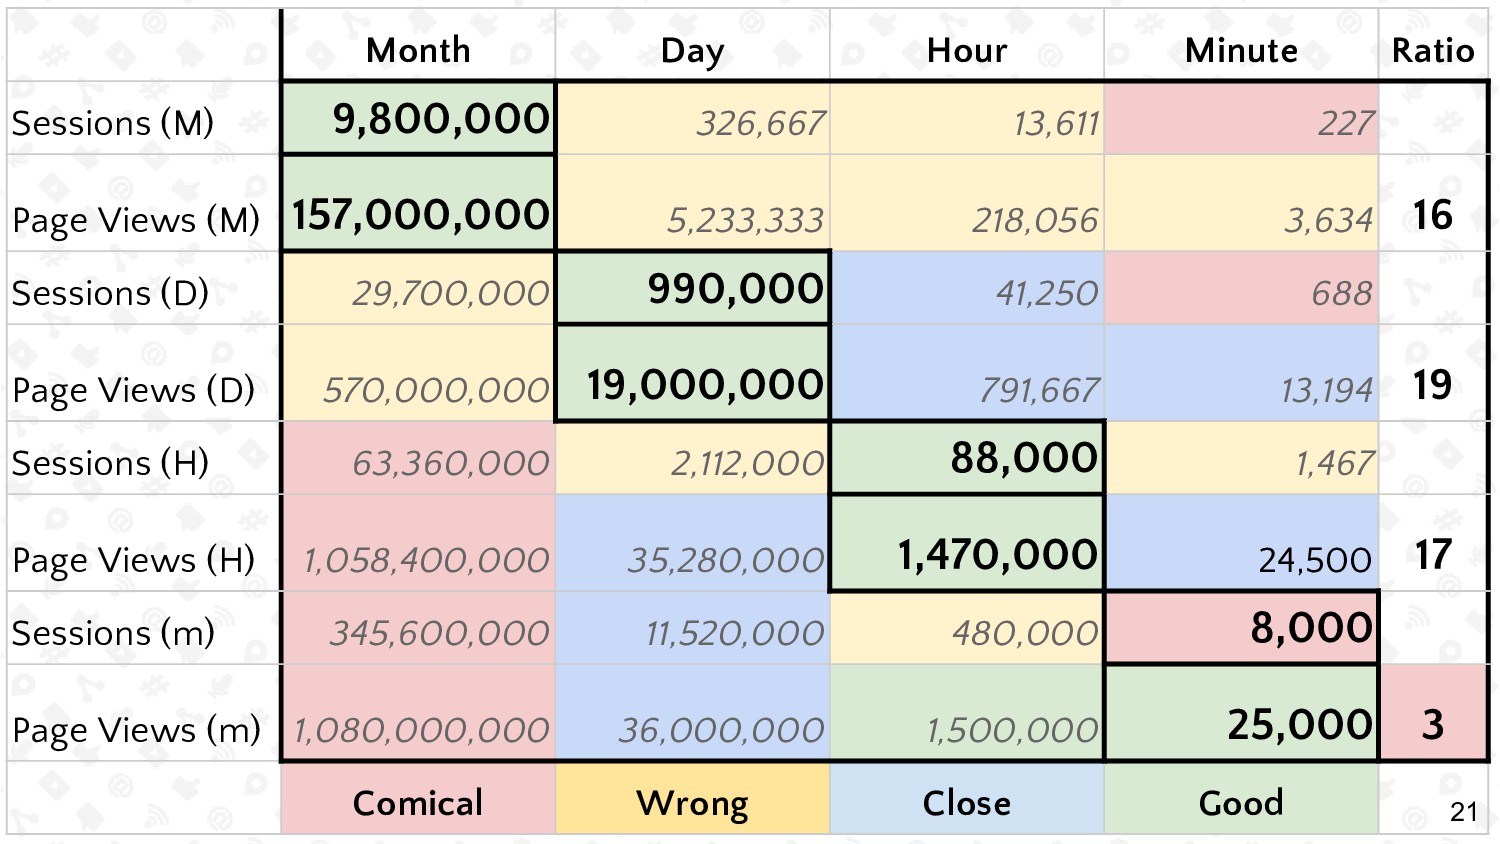
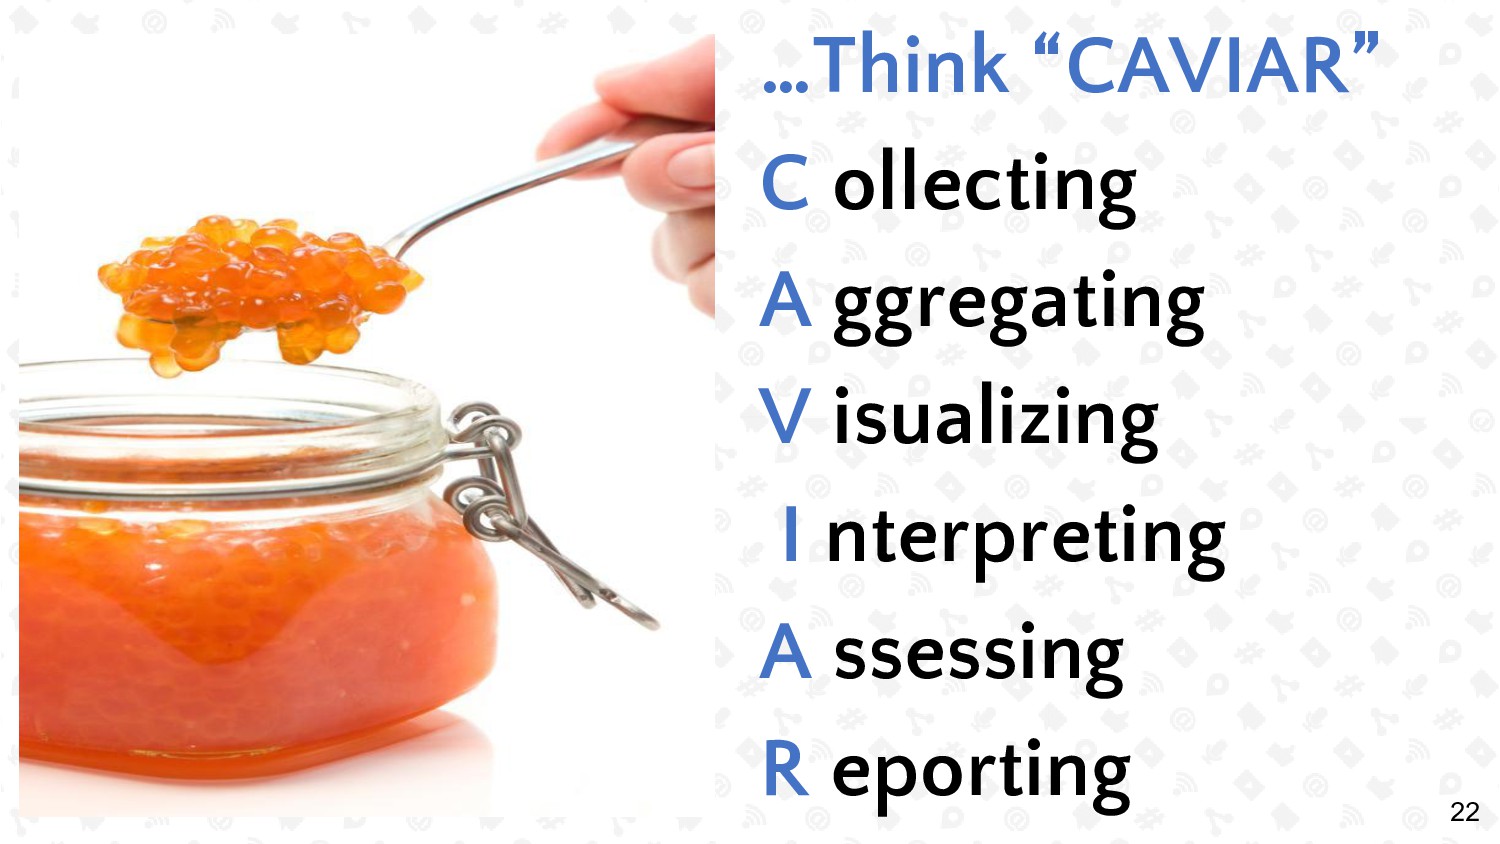
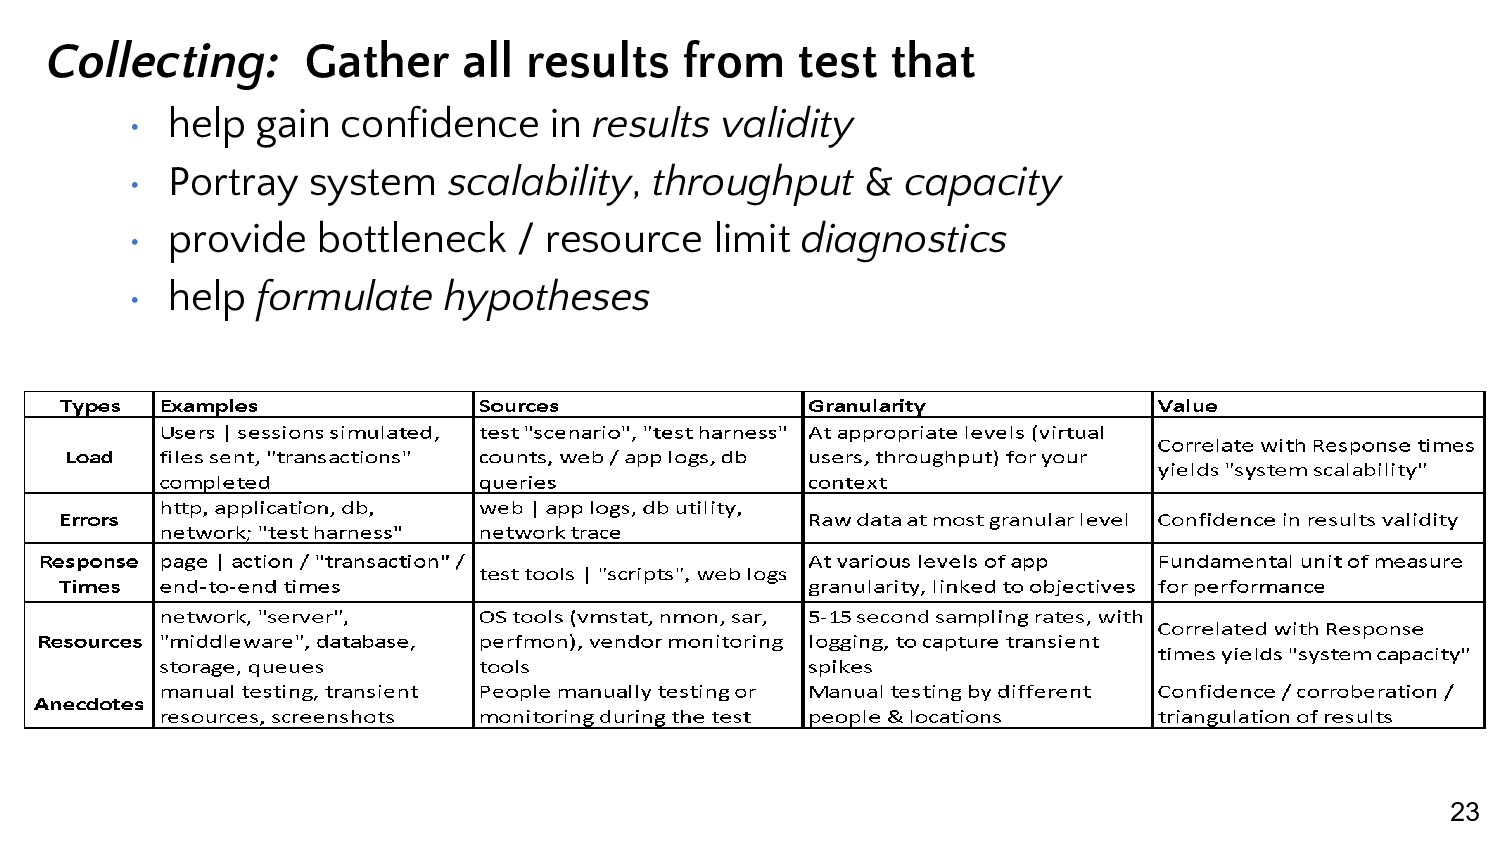
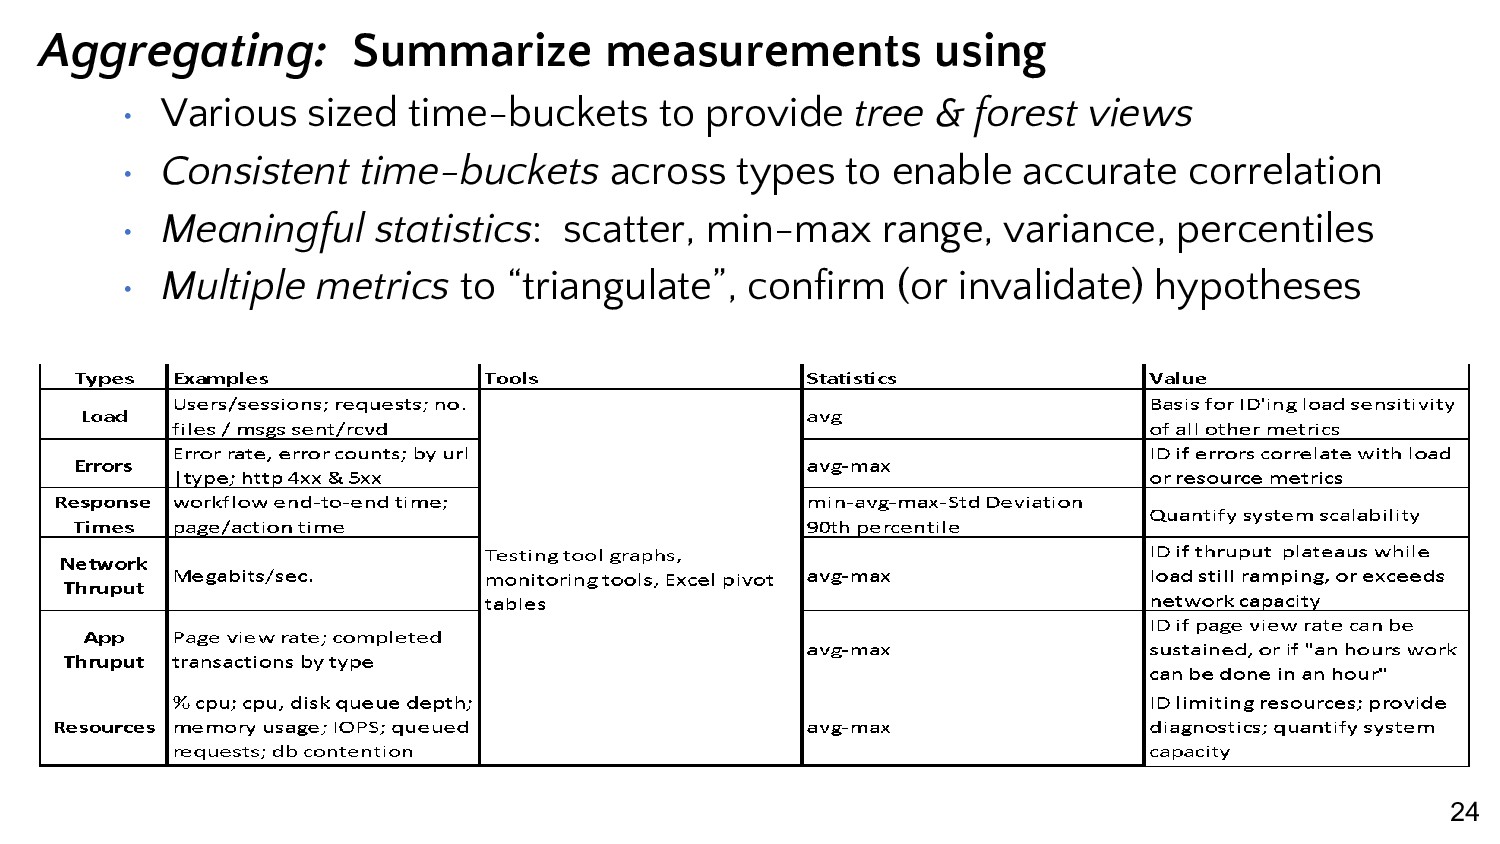
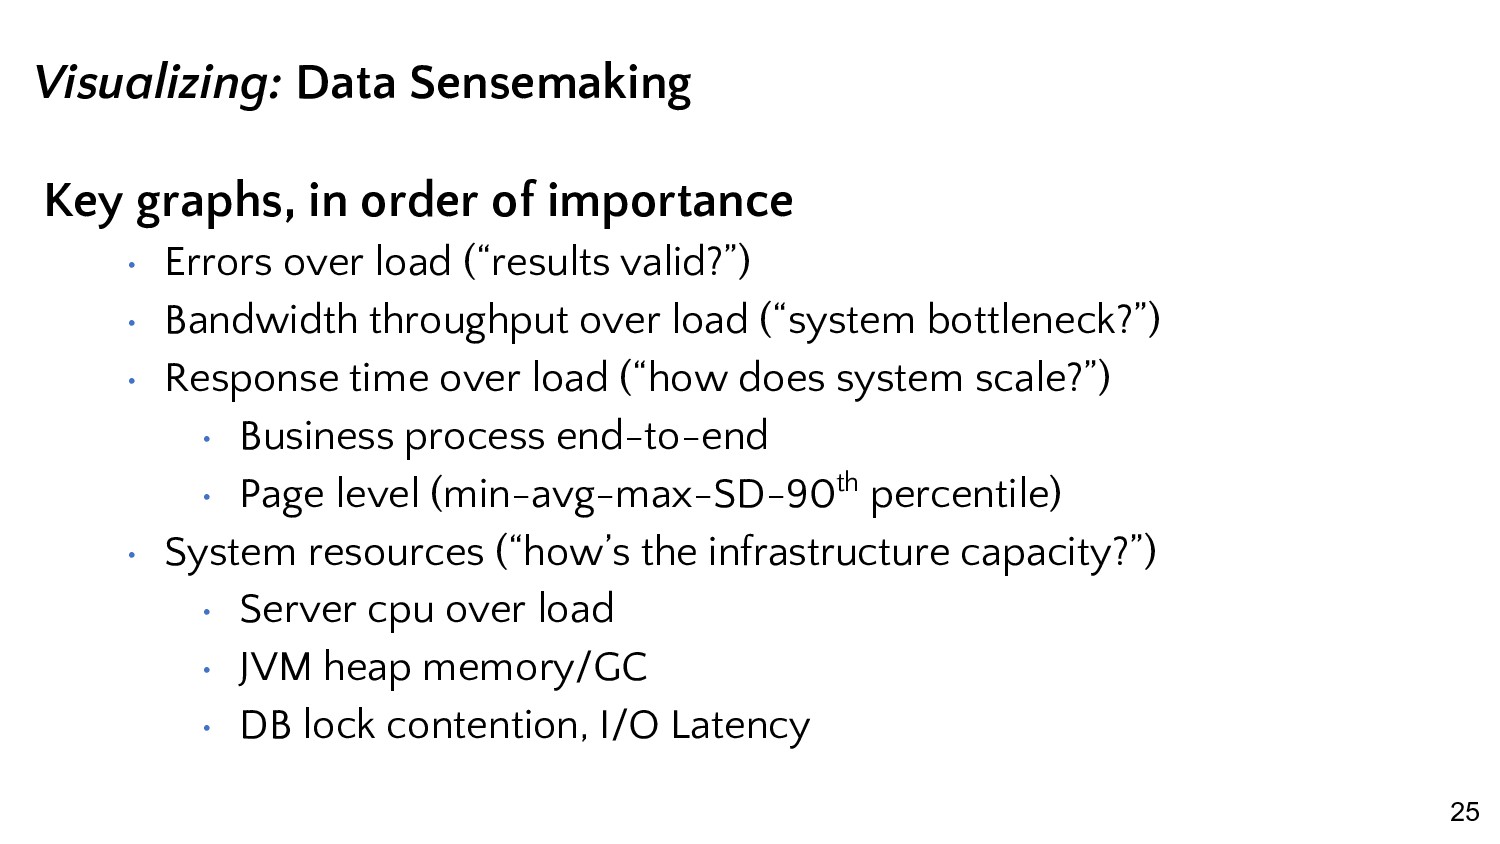
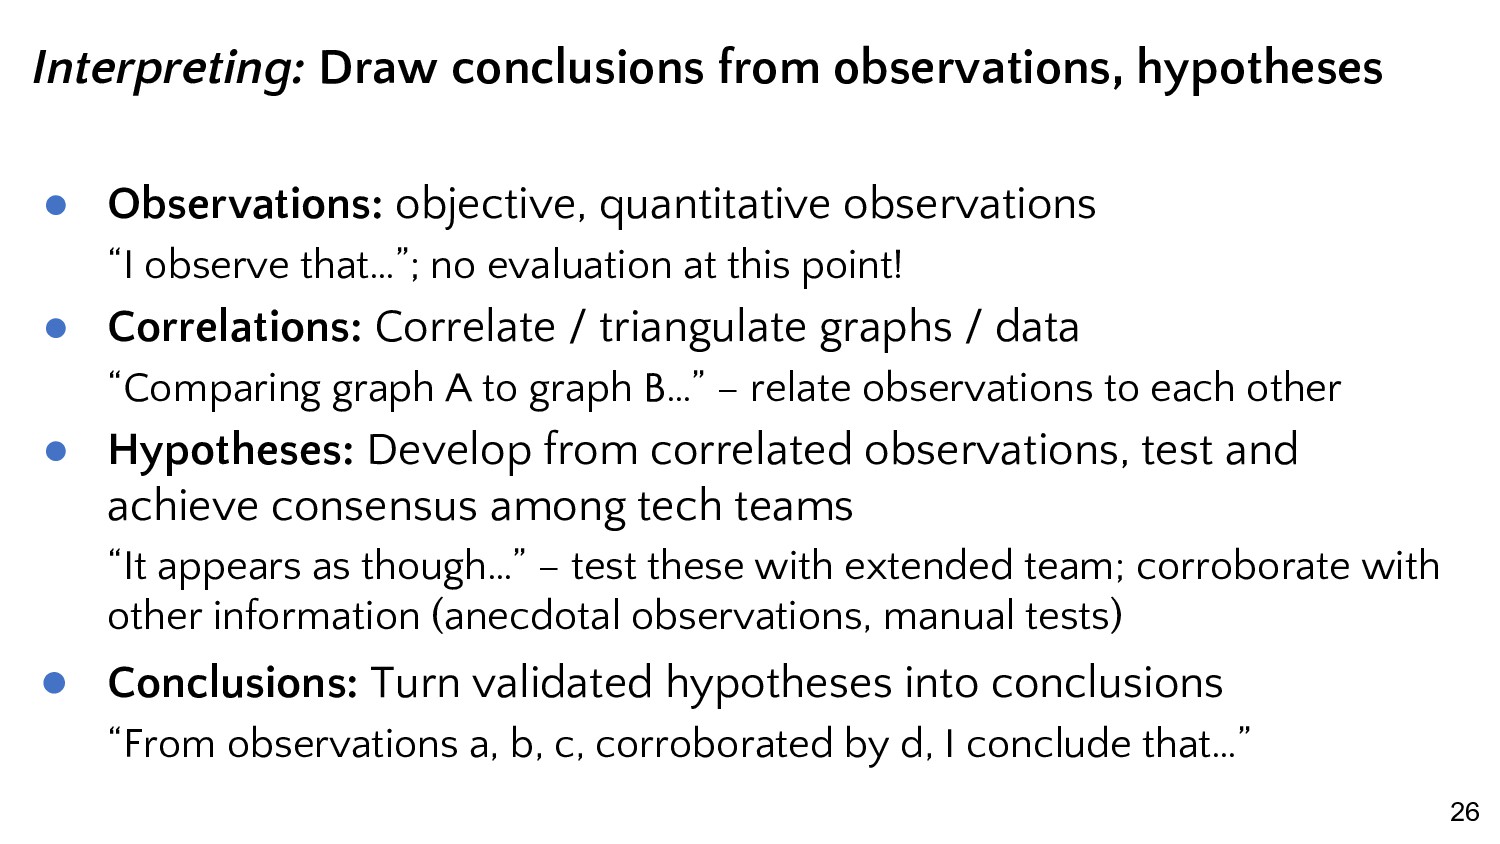
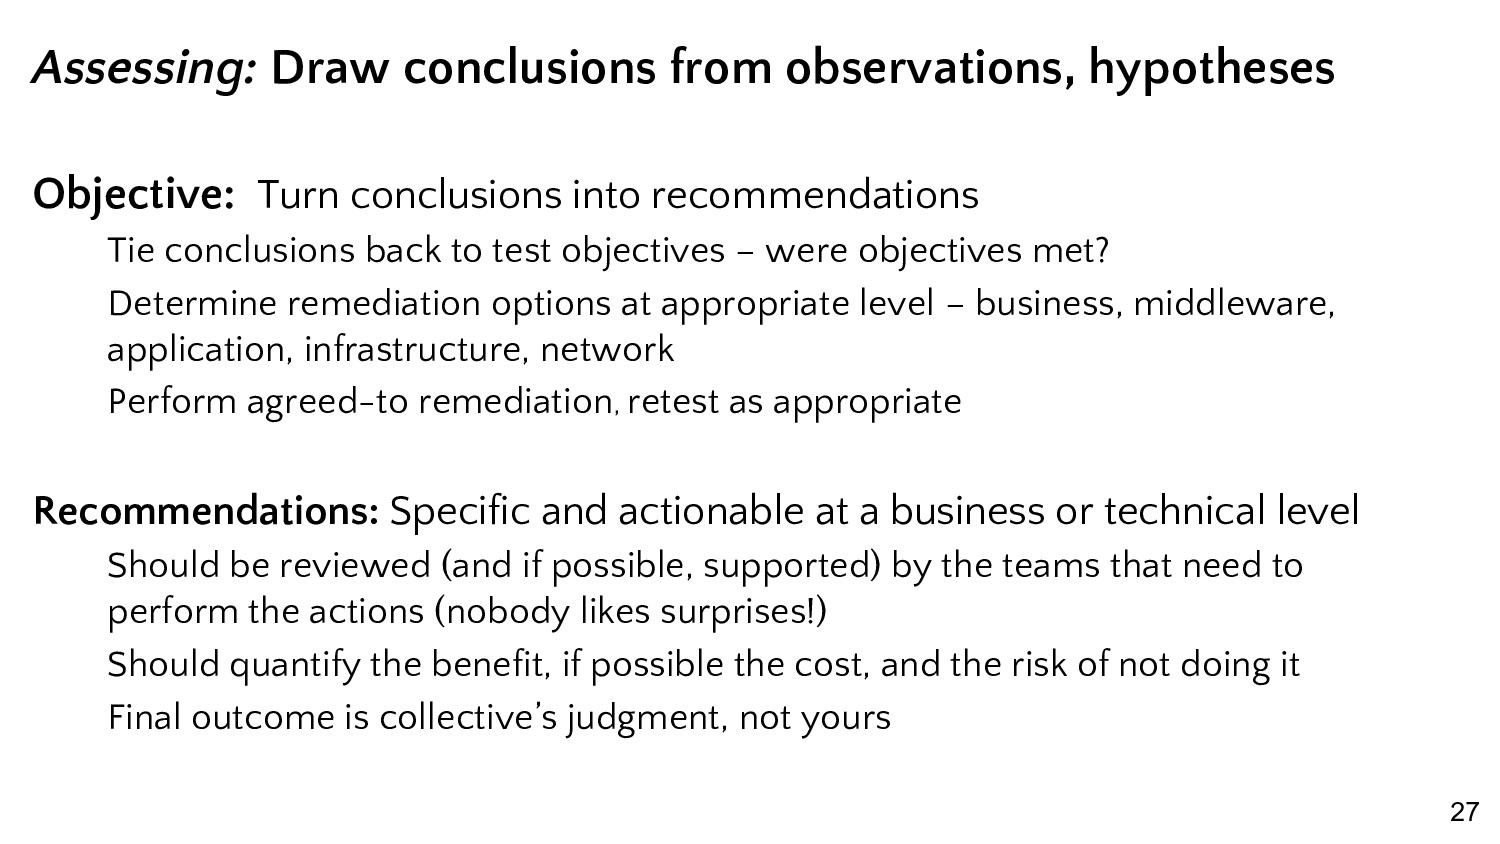
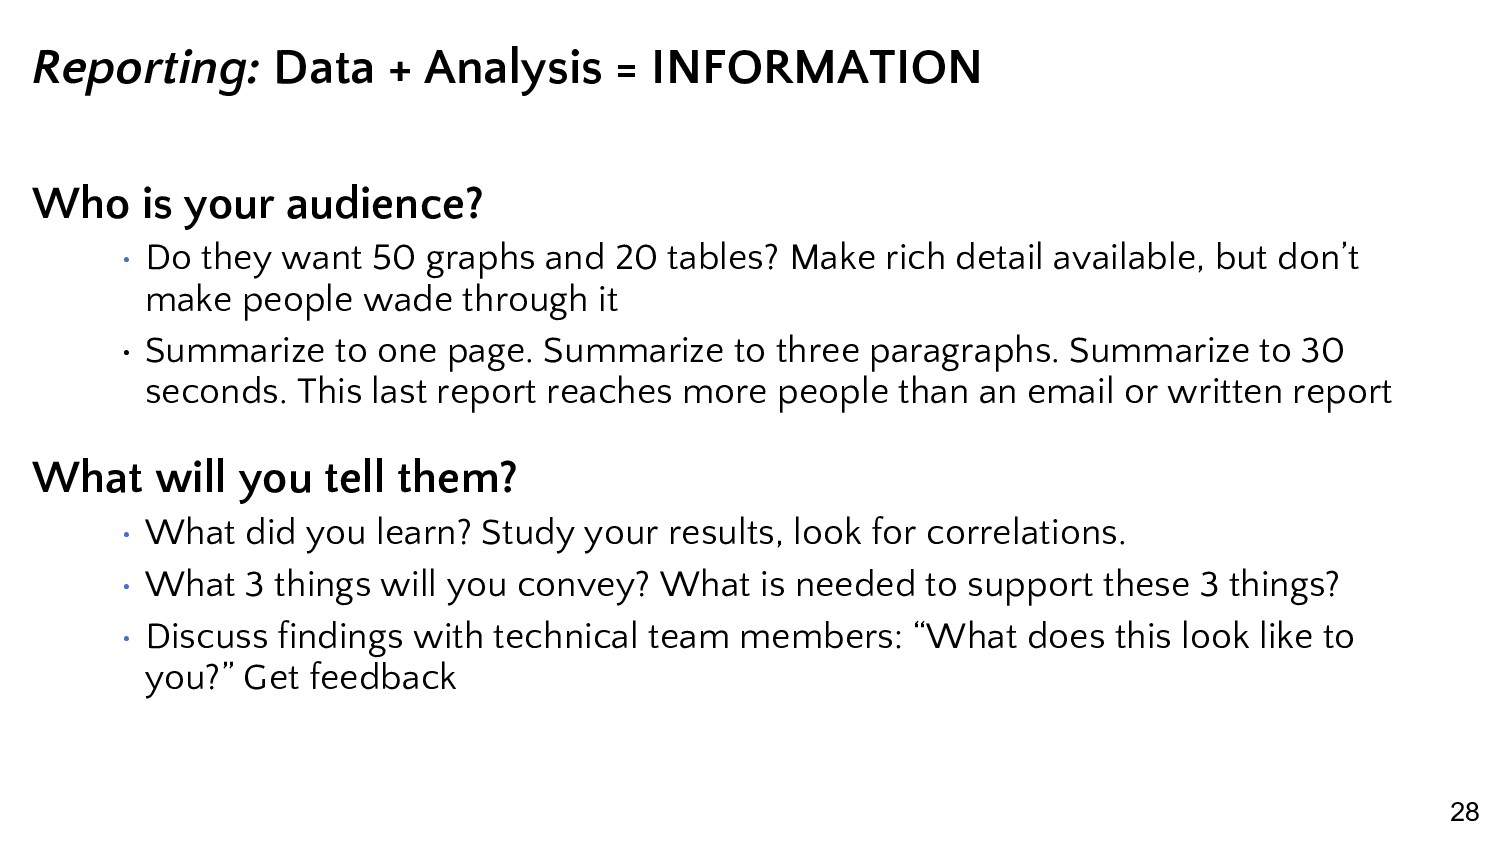
You’ve worked hard to define, develop and execute a performance test on an application to determine its behavior under load. What’s next? The answer is definitely not to generate and send a canned report from your testing tool, or to scoop up averages. Results interpretation and reporting is where a performance tester earns their stripes. We’ll look at some results from actual projects and together puzzle out the essential message in each. This will be an interactive session where a graph is displayed, a little context is provided, and you are asked “what do you see here?” We will form hypotheses, draw tentative conclusions, determine what further information we need to confirm them, and identify key target graphs that give us the best insight on system performance and bottlenecks. We’ll try to codify the analytic steps we went through in the first session, and consider a CAVIAR approach for collecting and evaluating test results: Collecting, Aggregating, Visualizing, Interpreting, Analyzing, And Reporting. Session Takeaways: Training in interpreting results: Data + Analysis = Information. Examples of telling performance test graphs. Advice on Reporting: compel action with your information.

CodeFest

April 05, 2018
Tweet

More Decks by CodeFest

Other Decks in Programming

Transcript

  1. 2 Eric Proegler • Former Perf Consultant, Perf Tool Product

    Manager • 22 Years in Software, 18 in Testing • VP and Treasurer, AST • Lead Organizer, WOPR • Podcast Host, PerfBytes • @ericproegler on Twitter
  2. 3

  3. 4

  4. 5

  5. 6 Summary • 0.5 sec is baseline response time •

    2.4 sec is almost five times as long (2x heuristic) • Linear Increase with Load means exhausted resource • Stability under load means no crashing or obvious decay • Beware Average/Median data sources
  6. 7

  7. 8 Summary • Load Test to 2,000 Users, ramp over

    34 mins, 70 min test • Node 1 CPU @100% @1500 users. Node 2 CPU @0% • Bad Load Balancing - very common in test environments • Overloaded CPU on one node - two nodes likely enough ◦ Beware aggregation ◦ Incorrect information about capacity ◦ Bad Response time info ◦ Errors?
  8. 9

  9. 10 Summary • Load Test to 100 Users ramp over

    45 mins, 12 hr soak test • Response time for most expensive transaction tracked - variable but consistent • Web Server CPU also steady • Lack of degradation suggests system is stable/not leaky
  10. 12 Summary • Load Test to 200 Users ramp over

    45 mins, 1:45 test • Response time for most expensive transaction again - increase seems to track load, but returns • Web Server CPU steady throughout, ~2x of Soak Test • 3rd party calls behind transaction causing variability
  11. 13

  12. 14 Summary • Load Test to 20,000 Users ramp over

    15 mins, 30 min test • Response time ~30 ms, inflection @20 mins • Message Queue backup was cause
  13. 15

  14. 16

  15. 17

  16. 18

  17. 19

  18. 20 Session Stats, Summarized • 9.8M Sessions/157M Pageviews peak month

    • 990K Sessions/19M Pageviews peak day • 88K Sessions/1.47M Pageviews peak hour • 8k Sessions/25K Pageviews peak minute
  19. 21 Month Day Hour Minute Ratio Sessions (M) 9,800,000 326,667

    13,611 227 Page Views (M) 157,000,000 5,233,333 218,056 3,634 16 Sessions (D) 29,700,000 990,000 41,250 688 Page Views (D) 570,000,000 19,000,000 791,667 13,194 19 Sessions (H) 63,360,000 2,112,000 88,000 1,467 Page Views (H) 1,058,400,000 35,280,000 1,470,000 24,500 17 Sessions (m) 345,600,000 11,520,000 480,000 8,000 Page Views (m) 1,080,000,000 36,000,000 1,500,000 25,000 3 Comical Wrong Close Good
  20. 23 Collecting: Gather all results from test that • help

    gain confidence in results validity • Portray system scalability, throughput & capacity • provide bottleneck / resource limit diagnostics • help formulate hypotheses
  21. 24 Aggregating: Summarize measurements using • Various sized time-buckets to

    provide tree & forest views • Consistent time-buckets across types to enable accurate correlation • Meaningful statistics: scatter, min-max range, variance, percentiles • Multiple metrics to “triangulate”, confirm (or invalidate) hypotheses
  22. 25 Visualizing: Data Sensemaking Key graphs, in order of importance

    • Errors over load (“results valid?”) • Bandwidth throughput over load (“system bottleneck?”) • Response time over load (“how does system scale?”) • Business process end-to-end • Page level (min-avg-max-SD-90th percentile) • System resources (“how’s the infrastructure capacity?”) • Server cpu over load • JVM heap memory/GC • DB lock contention, I/O Latency
  23. 26 Interpreting: Draw conclusions from observations, hypotheses • Observations: objective,

    quantitative observations “I observe that…”; no evaluation at this point! • Correlations: Correlate / triangulate graphs / data “Comparing graph A to graph B…” – relate observations to each other • Hypotheses: Develop from correlated observations, test and achieve consensus among tech teams “It appears as though…” – test these with extended team; corroborate with other information (anecdotal observations, manual tests) • Conclusions: Turn validated hypotheses into conclusions “From observations a, b, c, corroborated by d, I conclude that…”
  24. 27 Assessing: Draw conclusions from observations, hypotheses Objective: Turn conclusions

    into recommendations Tie conclusions back to test objectives – were objectives met? Determine remediation options at appropriate level – business, middleware, application, infrastructure, network Perform agreed-to remediation, retest as appropriate Recommendations: Specific and actionable at a business or technical level Should be reviewed (and if possible, supported) by the teams that need to perform the actions (nobody likes surprises!) Should quantify the benefit, if possible the cost, and the risk of not doing it Final outcome is collective’s judgment, not yours
  25. 28 Reporting: Data + Analysis = INFORMATION Who is your

    audience? • Do they want 50 graphs and 20 tables? Make rich detail available, but don’t make people wade through it • Summarize to one page. Summarize to three paragraphs. Summarize to 30 seconds. This last report reaches more people than an email or written report What will you tell them? • What did you learn? Study your results, look for correlations. • What 3 things will you convey? What is needed to support these 3 things? • Discuss findings with technical team members: “What does this look like to you?” Get feedback