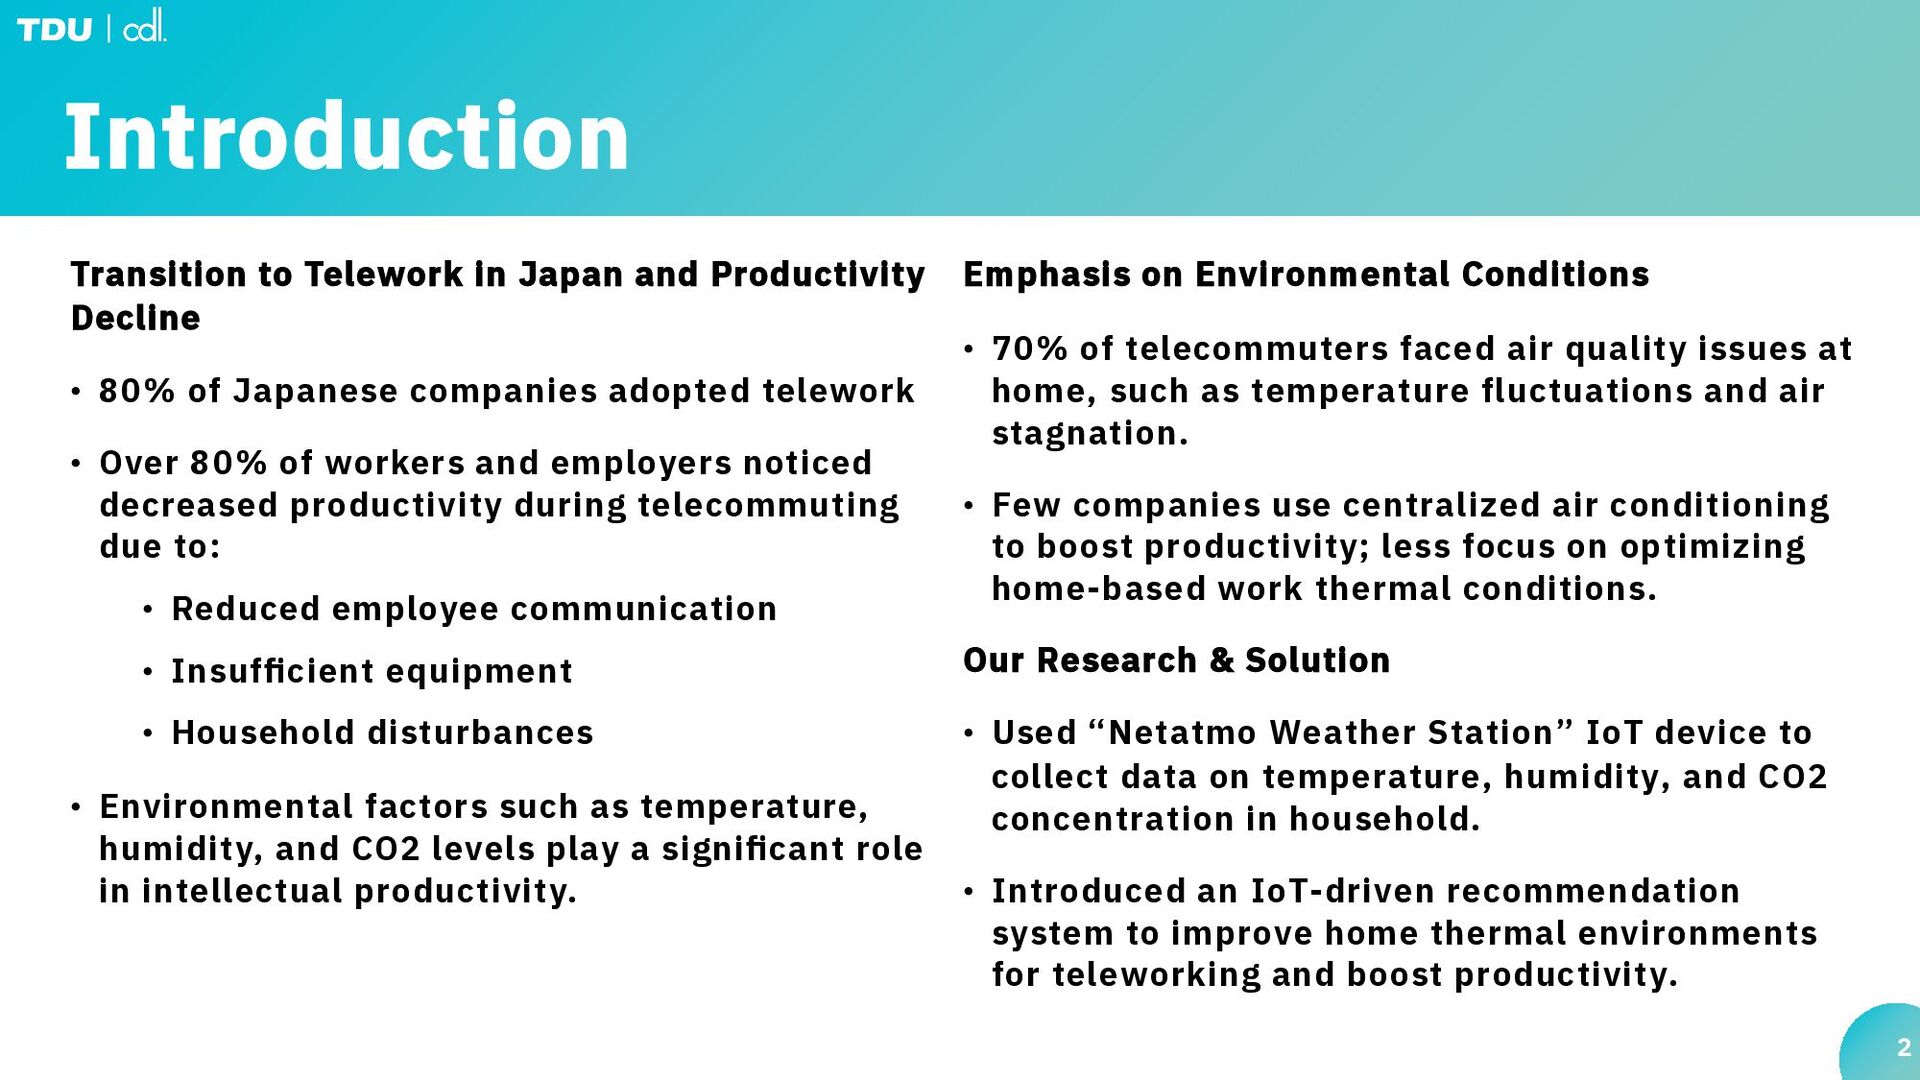
80% of Japanese companies adopted telework • Over 80% of workers and employers noticed decreased productivity during telecommuting due to: • Reduced employee communication • Insufficient equipment • Household disturbances • Environmental factors such as temperature, humidity, and CO2 levels play a significant role in intellectual productivity. 2 Emphasis on Environmental Conditions • 70% of telecommuters faced air quality issues at home, such as temperature fluctuations and air stagnation. • Few companies use centralized air conditioning to boost productivity; less focus on optimizing home-based work thermal conditions. Our Research & Solution • Used “Netatmo Weather Station” IoT device to collect data on temperature, humidity, and CO2 concentration in household. • Introduced an IoT-driven recommendation system to improve home thermal environments for teleworking and boost productivity.
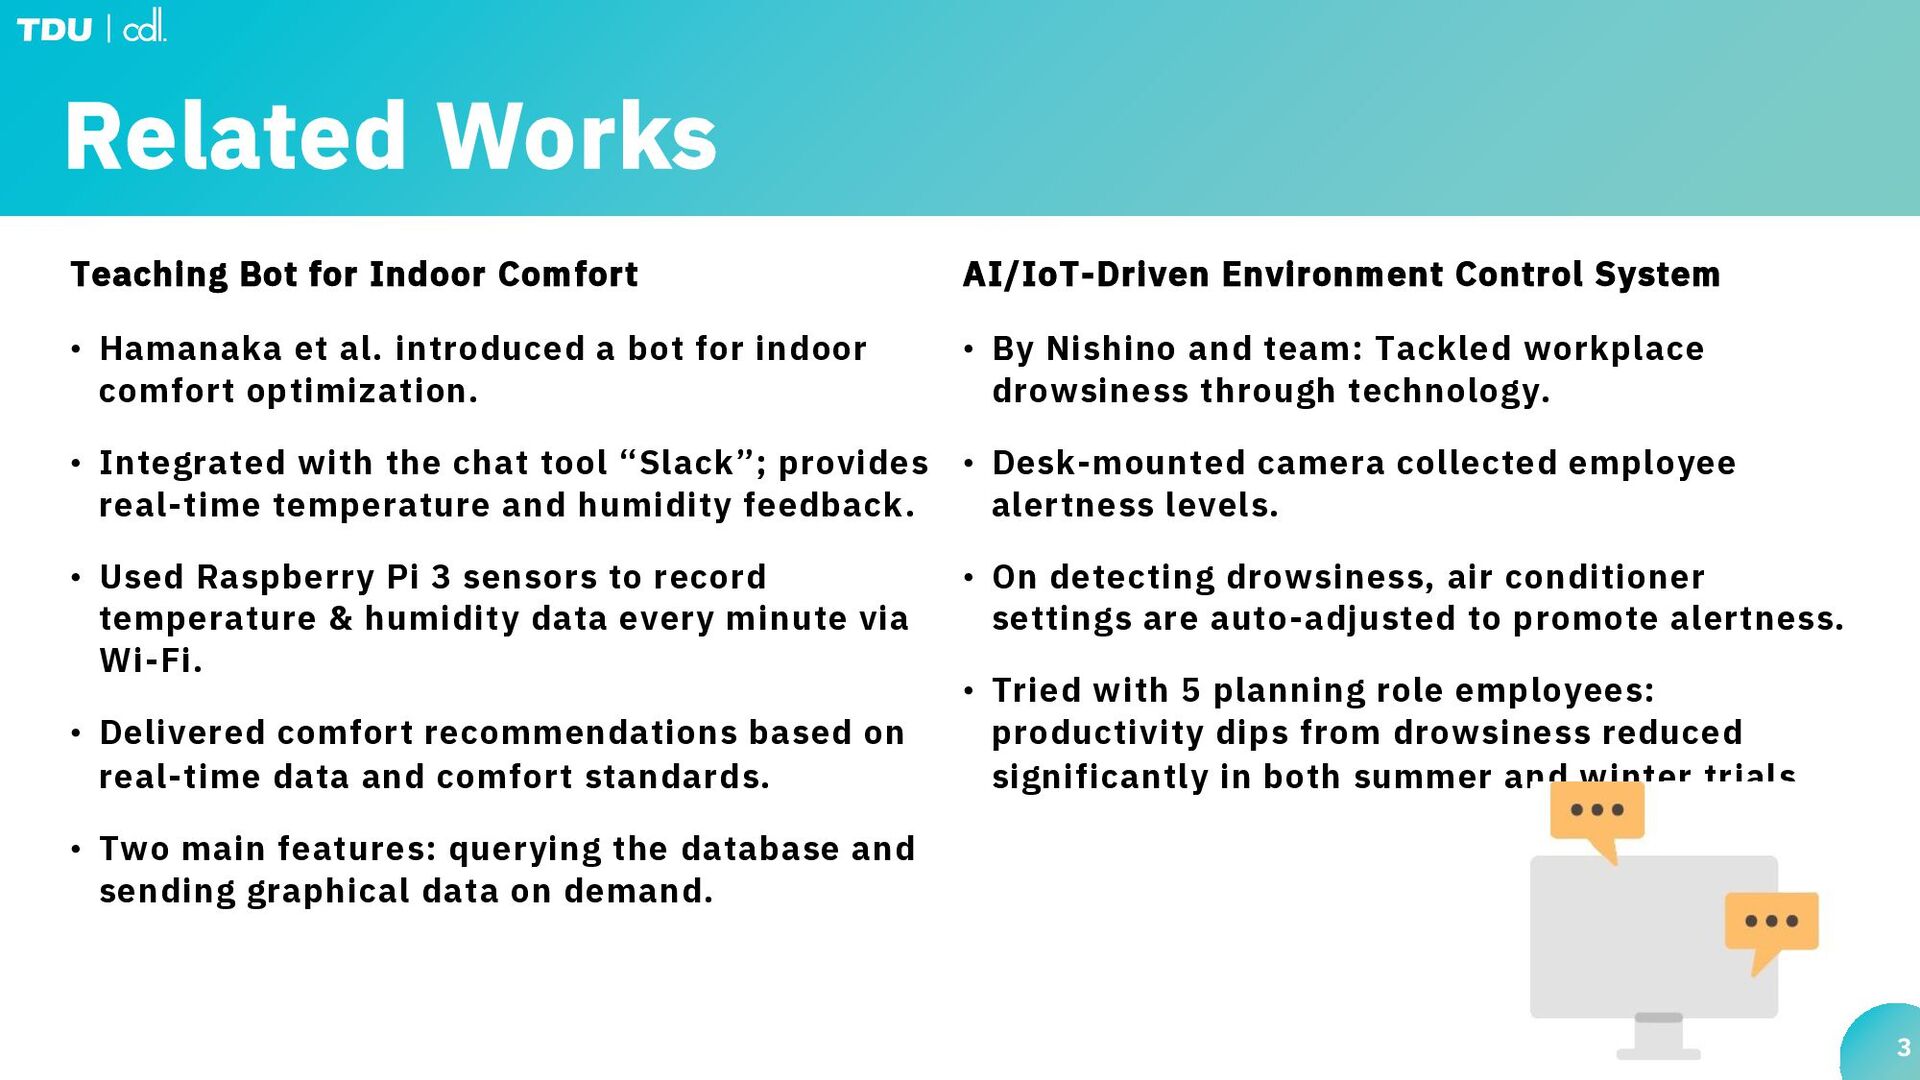
al. introduced a bot for indoor comfort optimization. • Integrated with the chat tool “Slack”; provides real-time temperature and humidity feedback. • Used Raspberry Pi 3 sensors to record temperature & humidity data every minute via Wi-Fi. • Delivered comfort recommendations based on real-time data and comfort standards. • Two main features: querying the database and sending graphical data on demand. 3 AI/IoT-Driven Environment Control System • By Nishino and team: Tackled workplace drowsiness through technology. • Desk-mounted camera collected employee alertness levels. • On detecting drowsiness, air conditioner settings are auto-adjusted to promote alertness. • Tried with 5 planning role employees: productivity dips from drowsiness reduced significantly in both summer and winter trials.
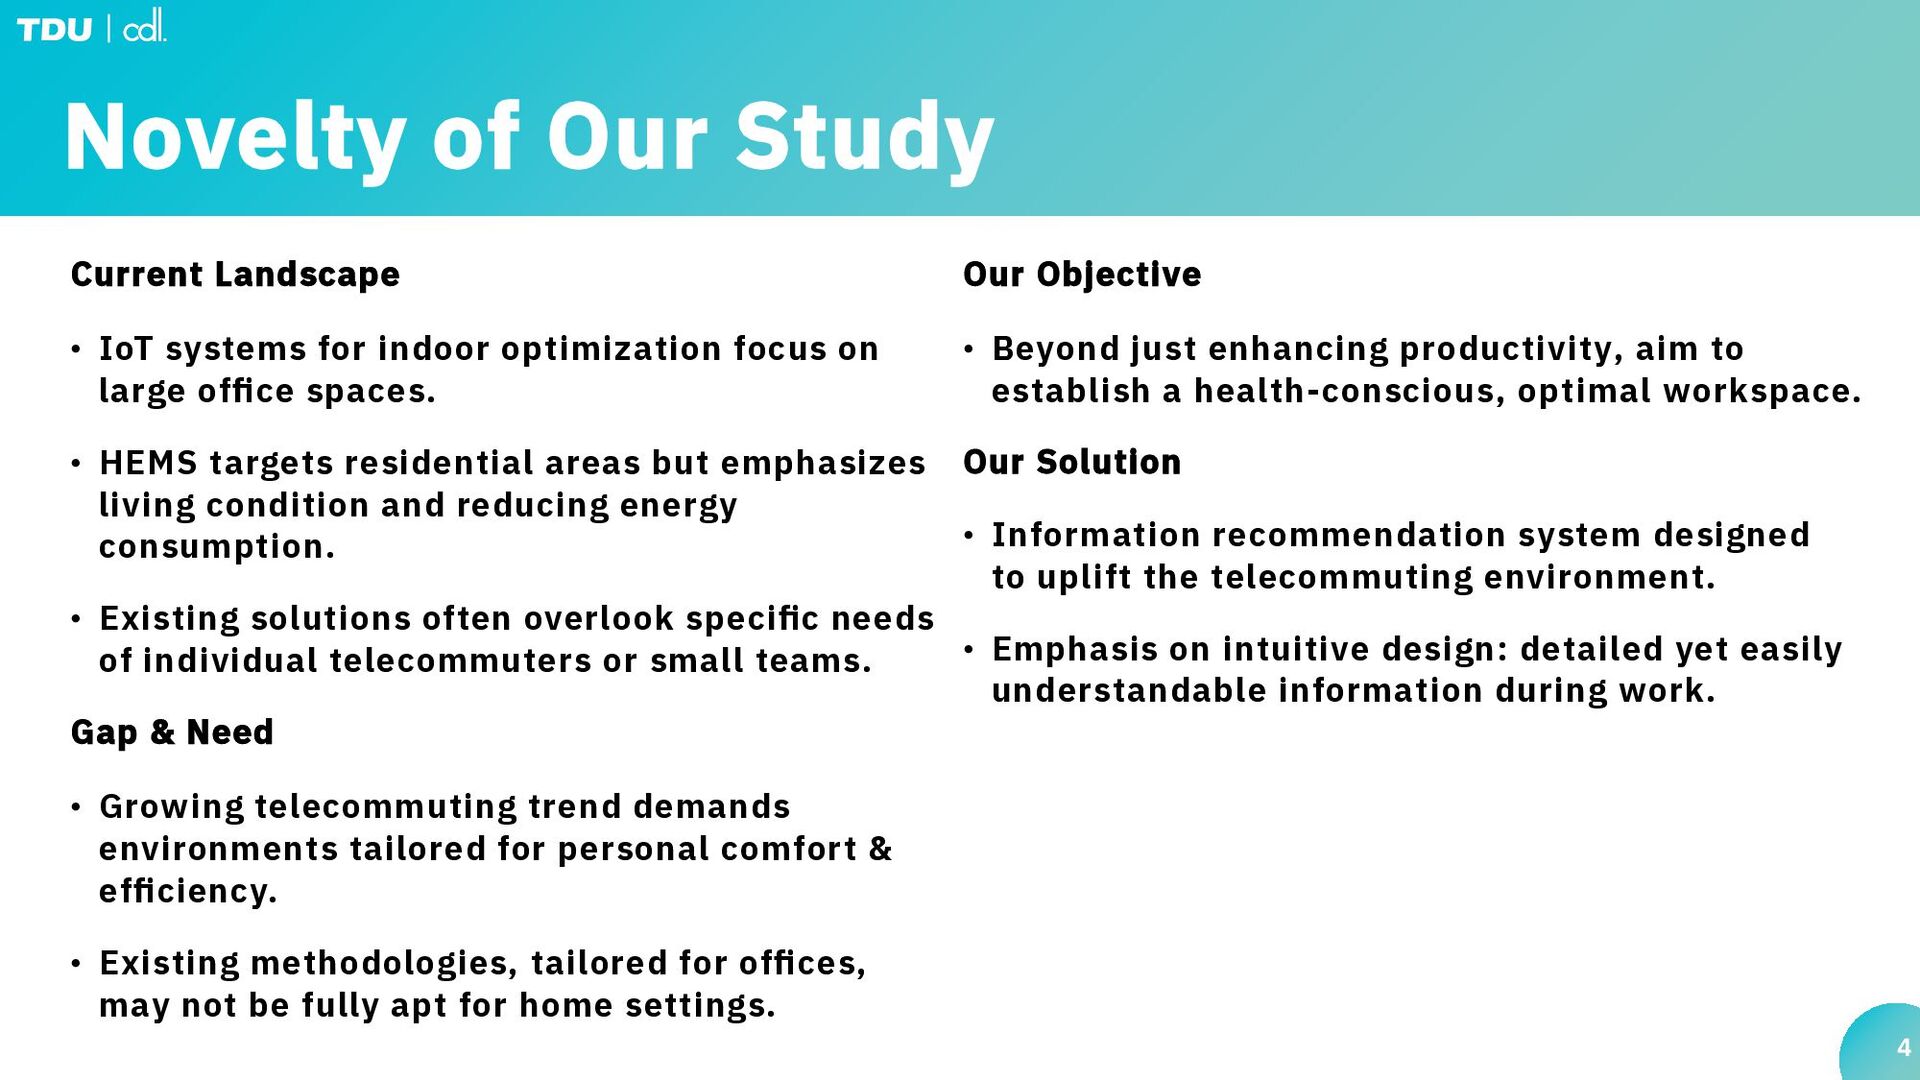
indoor optimization focus on large office spaces. • HEMS targets residential areas but emphasizes living condition and reducing energy consumption. • Existing solutions often overlook specific needs of individual telecommuters or small teams. Gap & Need • Growing telecommuting trend demands environments tailored for personal comfort & efficiency. • Existing methodologies, tailored for offices, may not be fully apt for home settings. 4 Our Objective • Beyond just enhancing productivity, aim to establish a health-conscious, optimal workspace. Our Solution • Information recommendation system designed to uplift the telecommuting environment. • Emphasis on intuitive design: detailed yet easily understandable information during work.
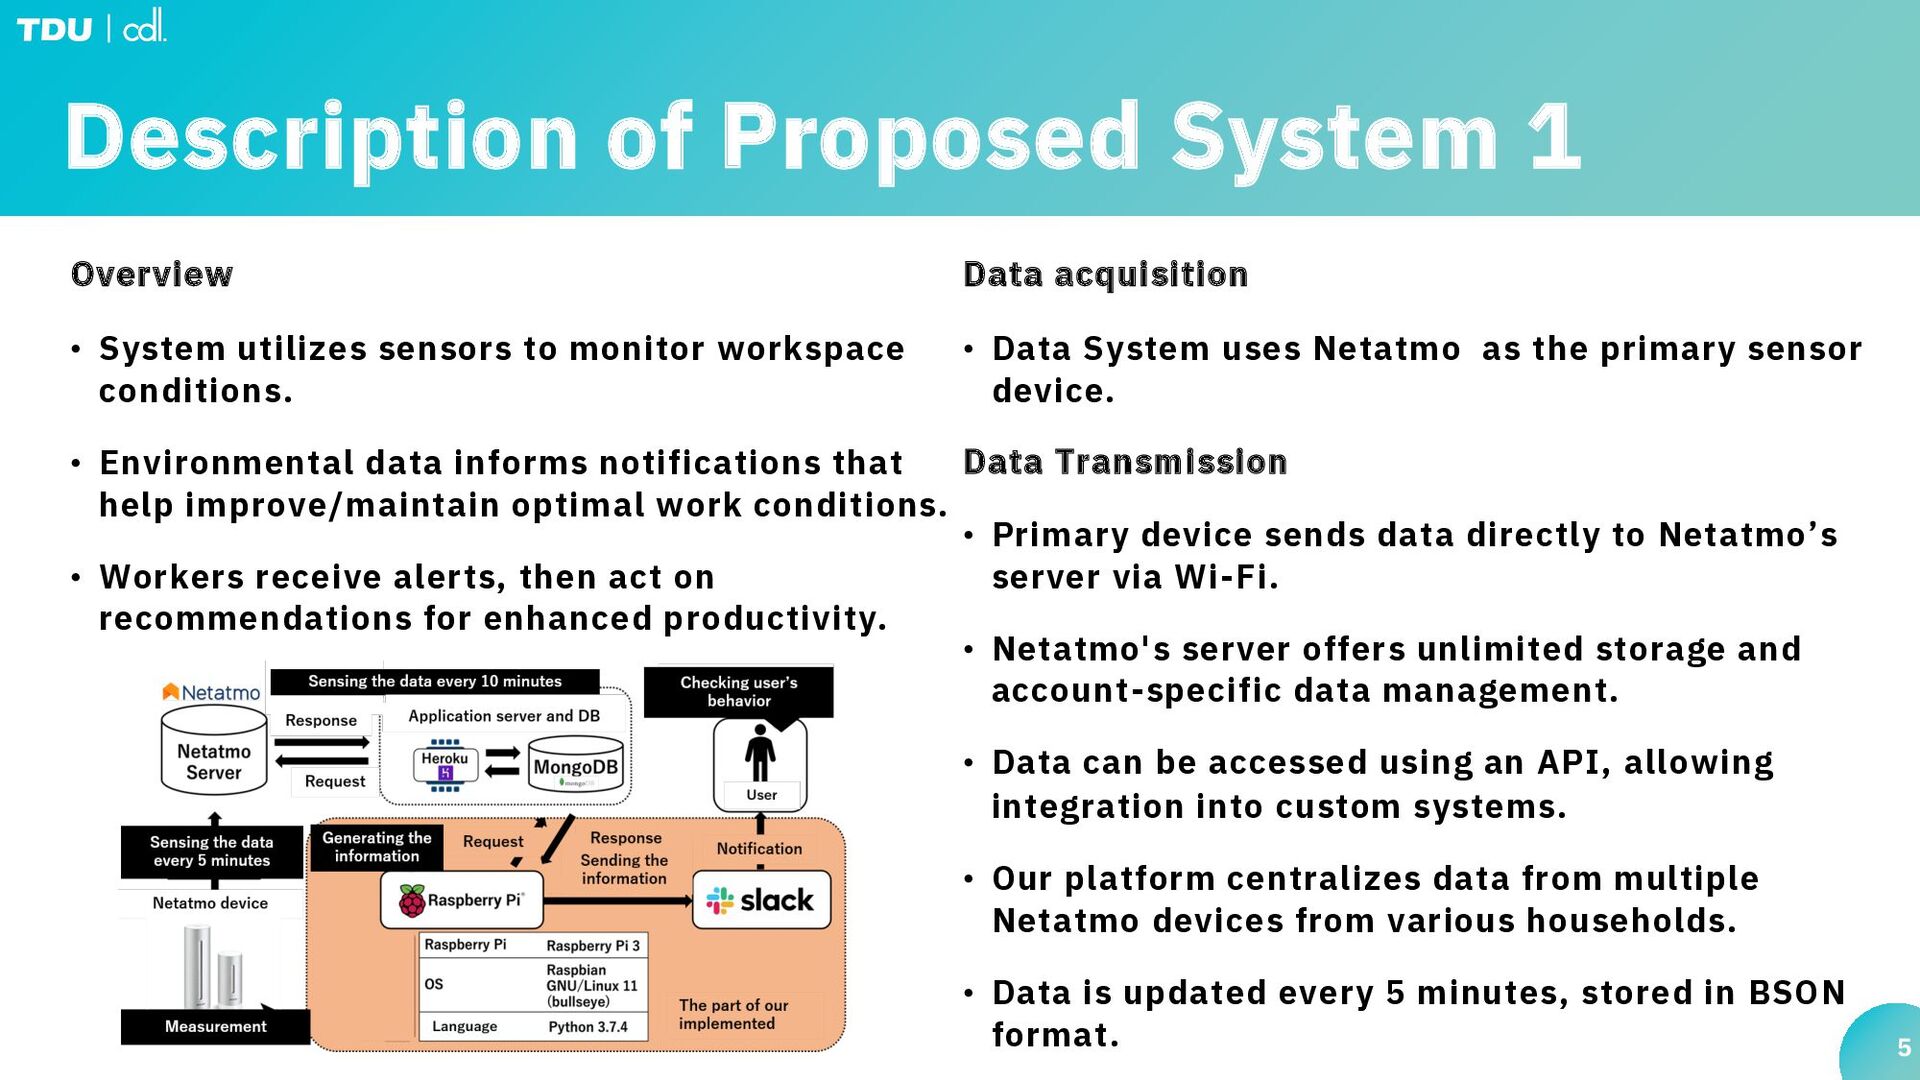
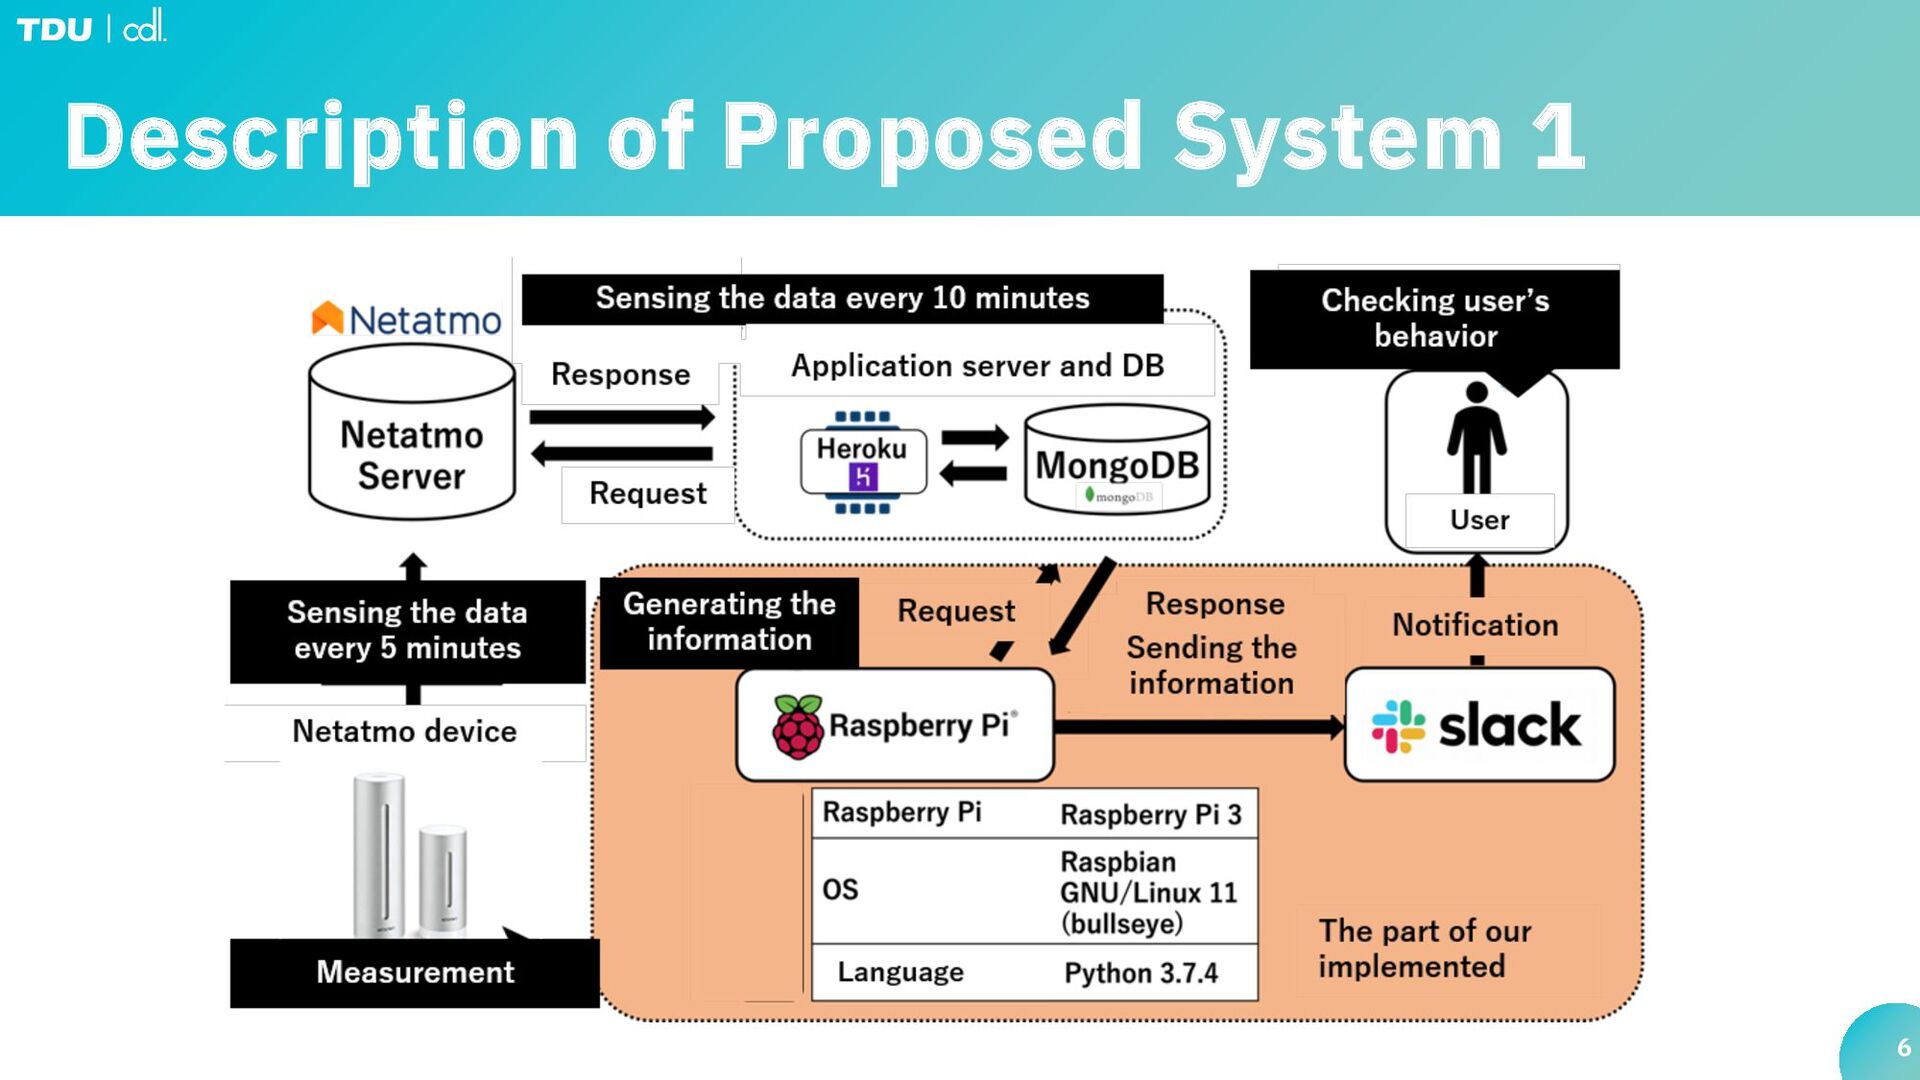
to monitor workspace conditions. • Environmental data informs notifications that help improve/maintain optimal work conditions. • Workers receive alerts, then act on recommendations for enhanced productivity. 5 Data acquisition • Data System uses Netatmo as the primary sensor device. Data Transmission • Primary device sends data directly to Netatmoʼs server via Wi-Fi. • Netatmo's server offers unlimited storage and account-specific data management. • Data can be accessed using an API, allowing integration into custom systems. • Our platform centralizes data from multiple Netatmo devices from various households. • Data is updated every 5 minutes, stored in BSON format.
types of information 1) Current Indoor Environment Status: • It provides the immediate values of different indoor environmental factors along with feedback to maintain or enhance them. 2) Daily Environmental Trends: • Using graphs, the system visually represents the fluctuation in indoor environmental factors throughout the day. Accompanied by these visuals are comments to ensure the environment stays optimal. 7 3) Historical Analysis: • It gives a rundown of the previous dayʼs and last weekʼs suitability rate of the indoor environment, its average, and suggestions based on this data. 4) Guided Articles: The system also offers columns or articles on how to maintain or enhance the indoor environment. • To determine the ideal work environment and establish benchmarks, our system references the building environmental hygiene control standards. As per the standards, the following are the desirable conditions for a workspace
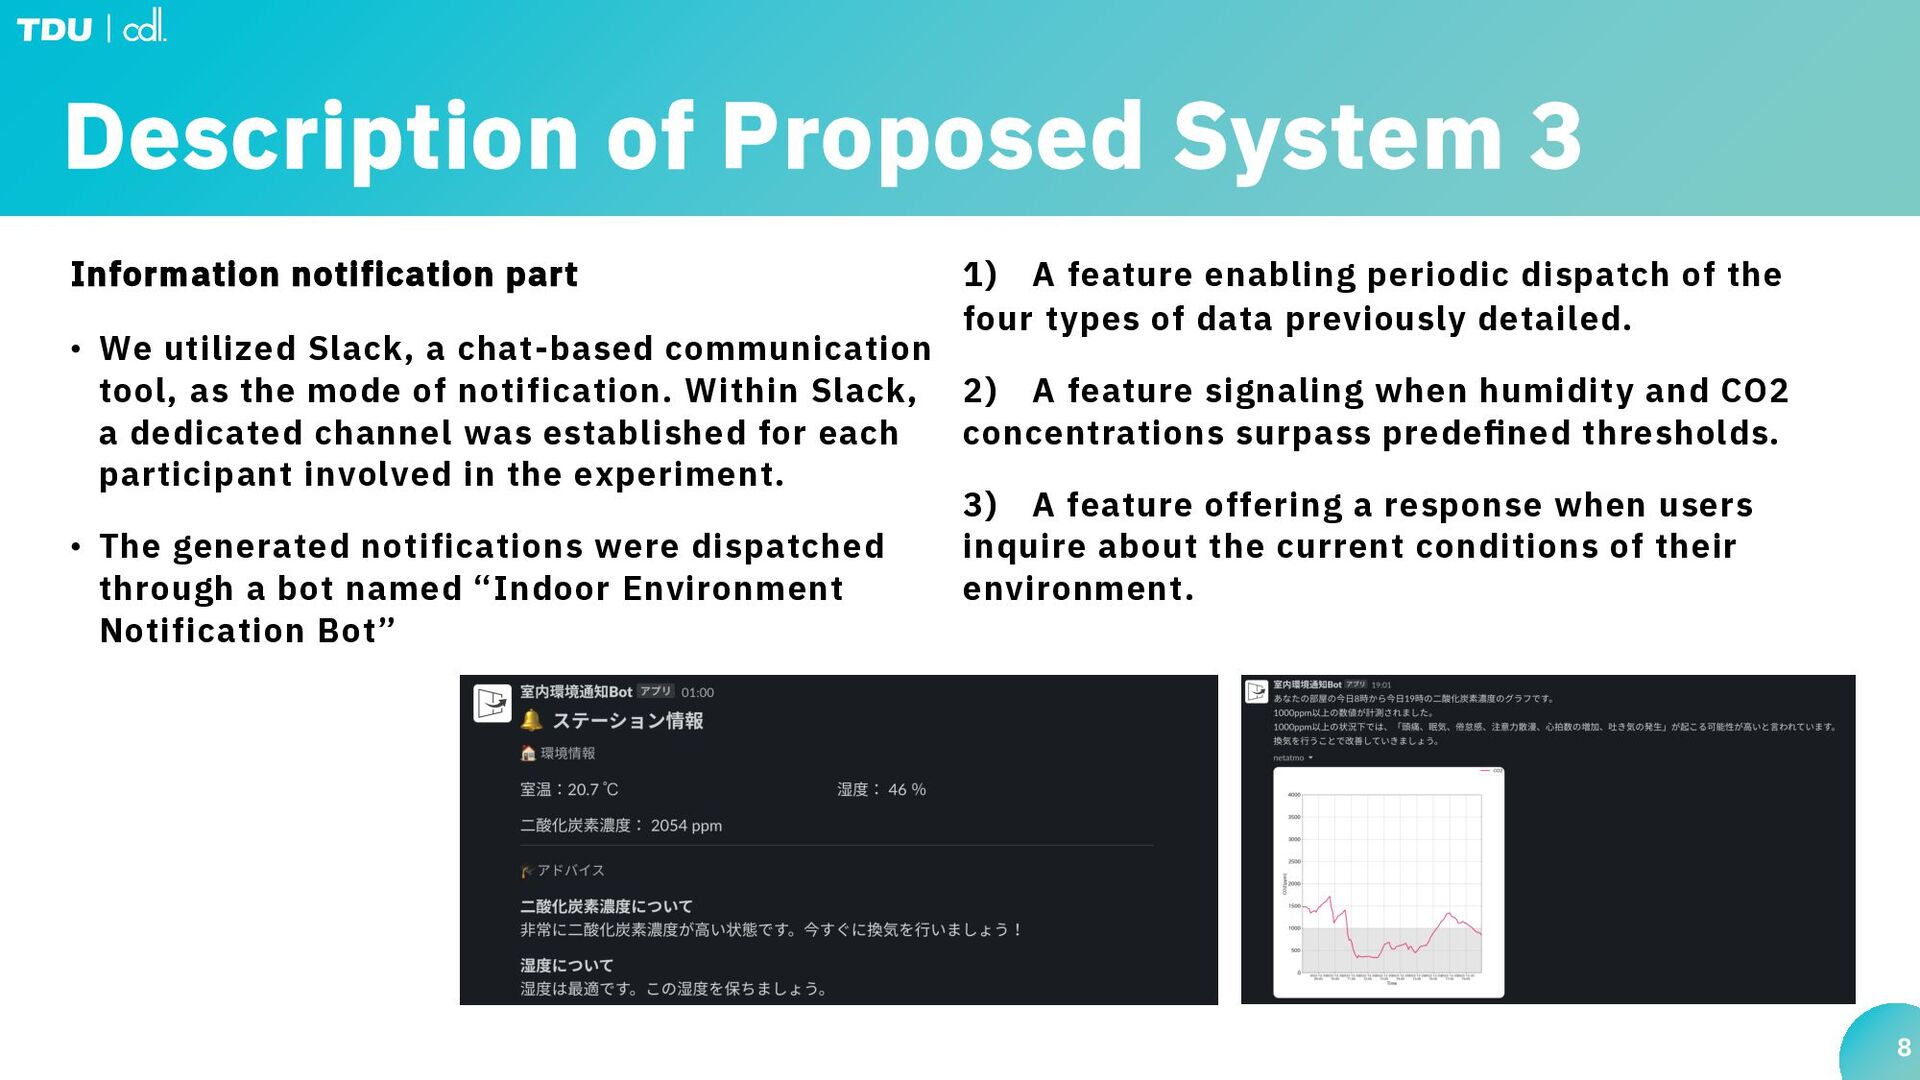
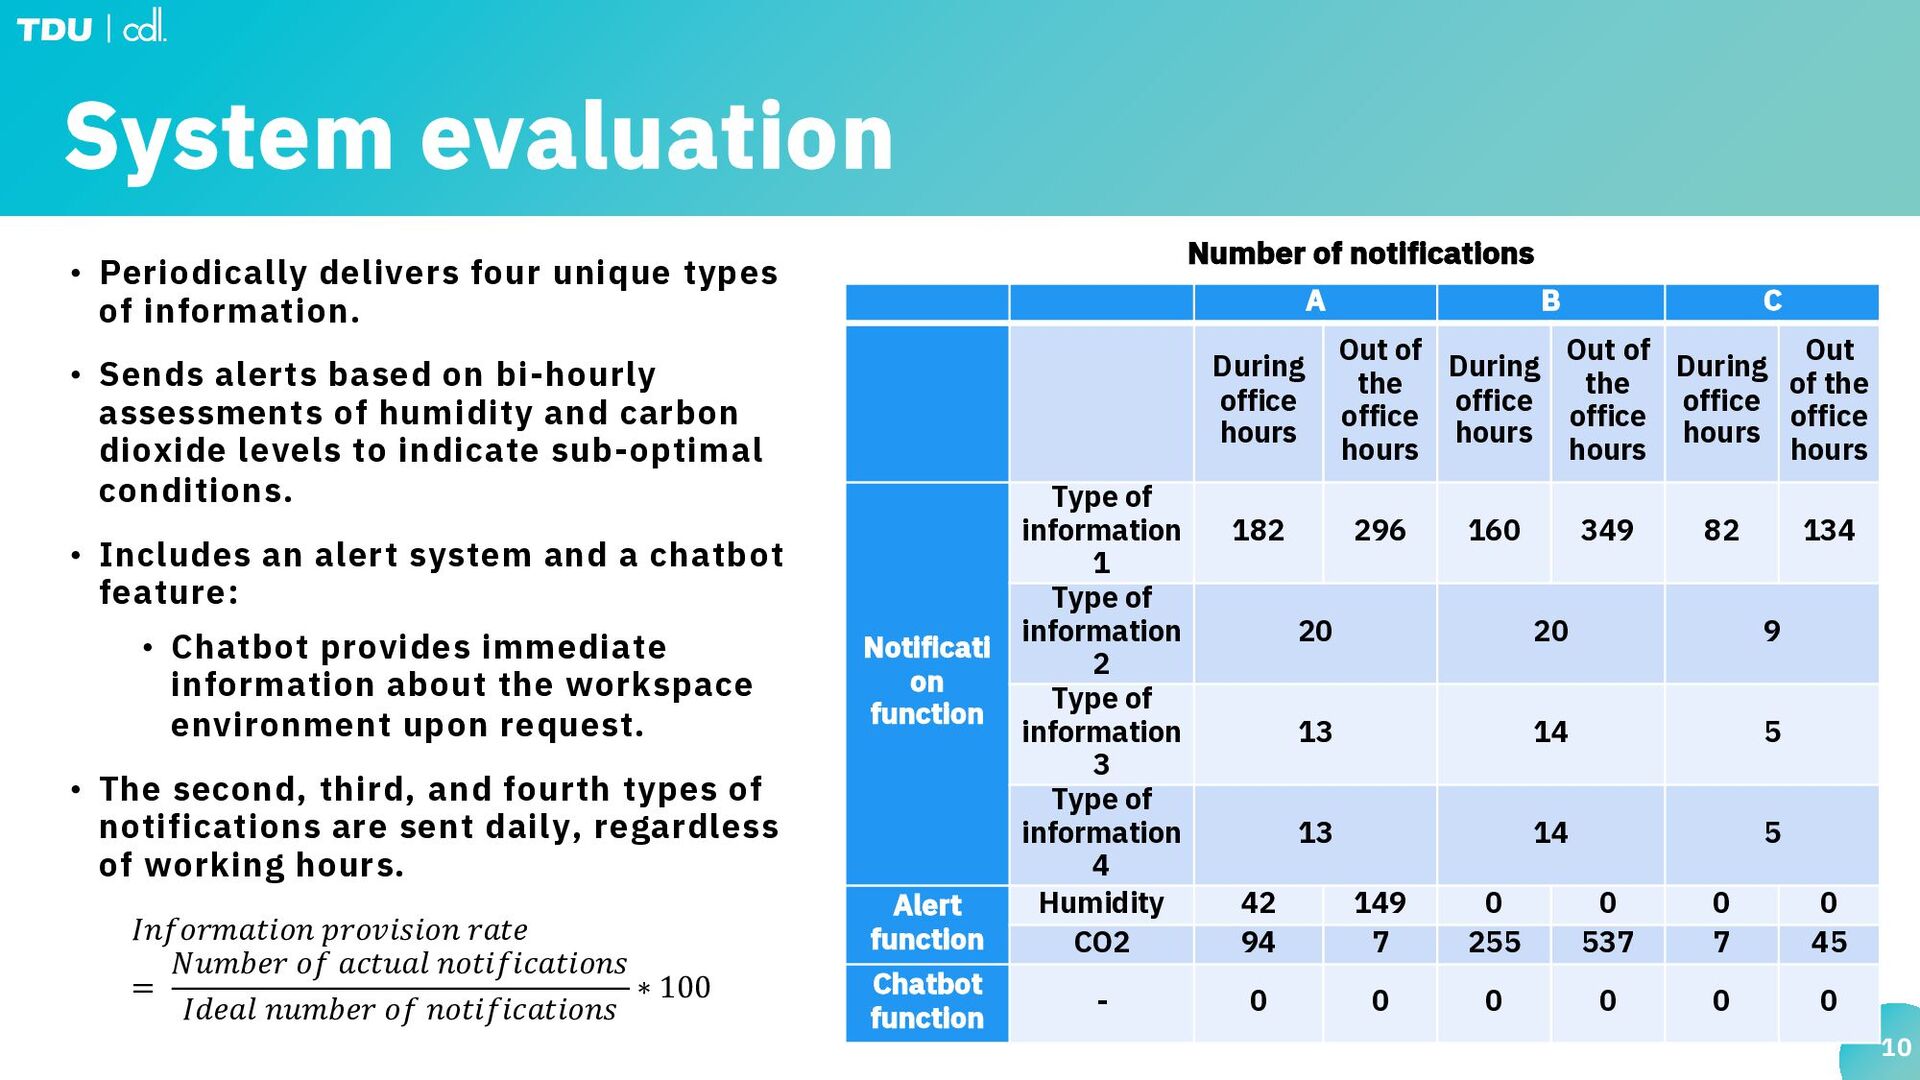
utilized Slack, a chat-based communication tool, as the mode of notification. Within Slack, a dedicated channel was established for each participant involved in the experiment. • The generated notifications were dispatched through a bot named “Indoor Environment Notification Bot” 8 1) A feature enabling periodic dispatch of the four types of data previously detailed. 2) A feature signaling when humidity and CO2 concentrations surpass predefined thresholds. 3) A feature offering a response when users inquire about the current conditions of their environment.
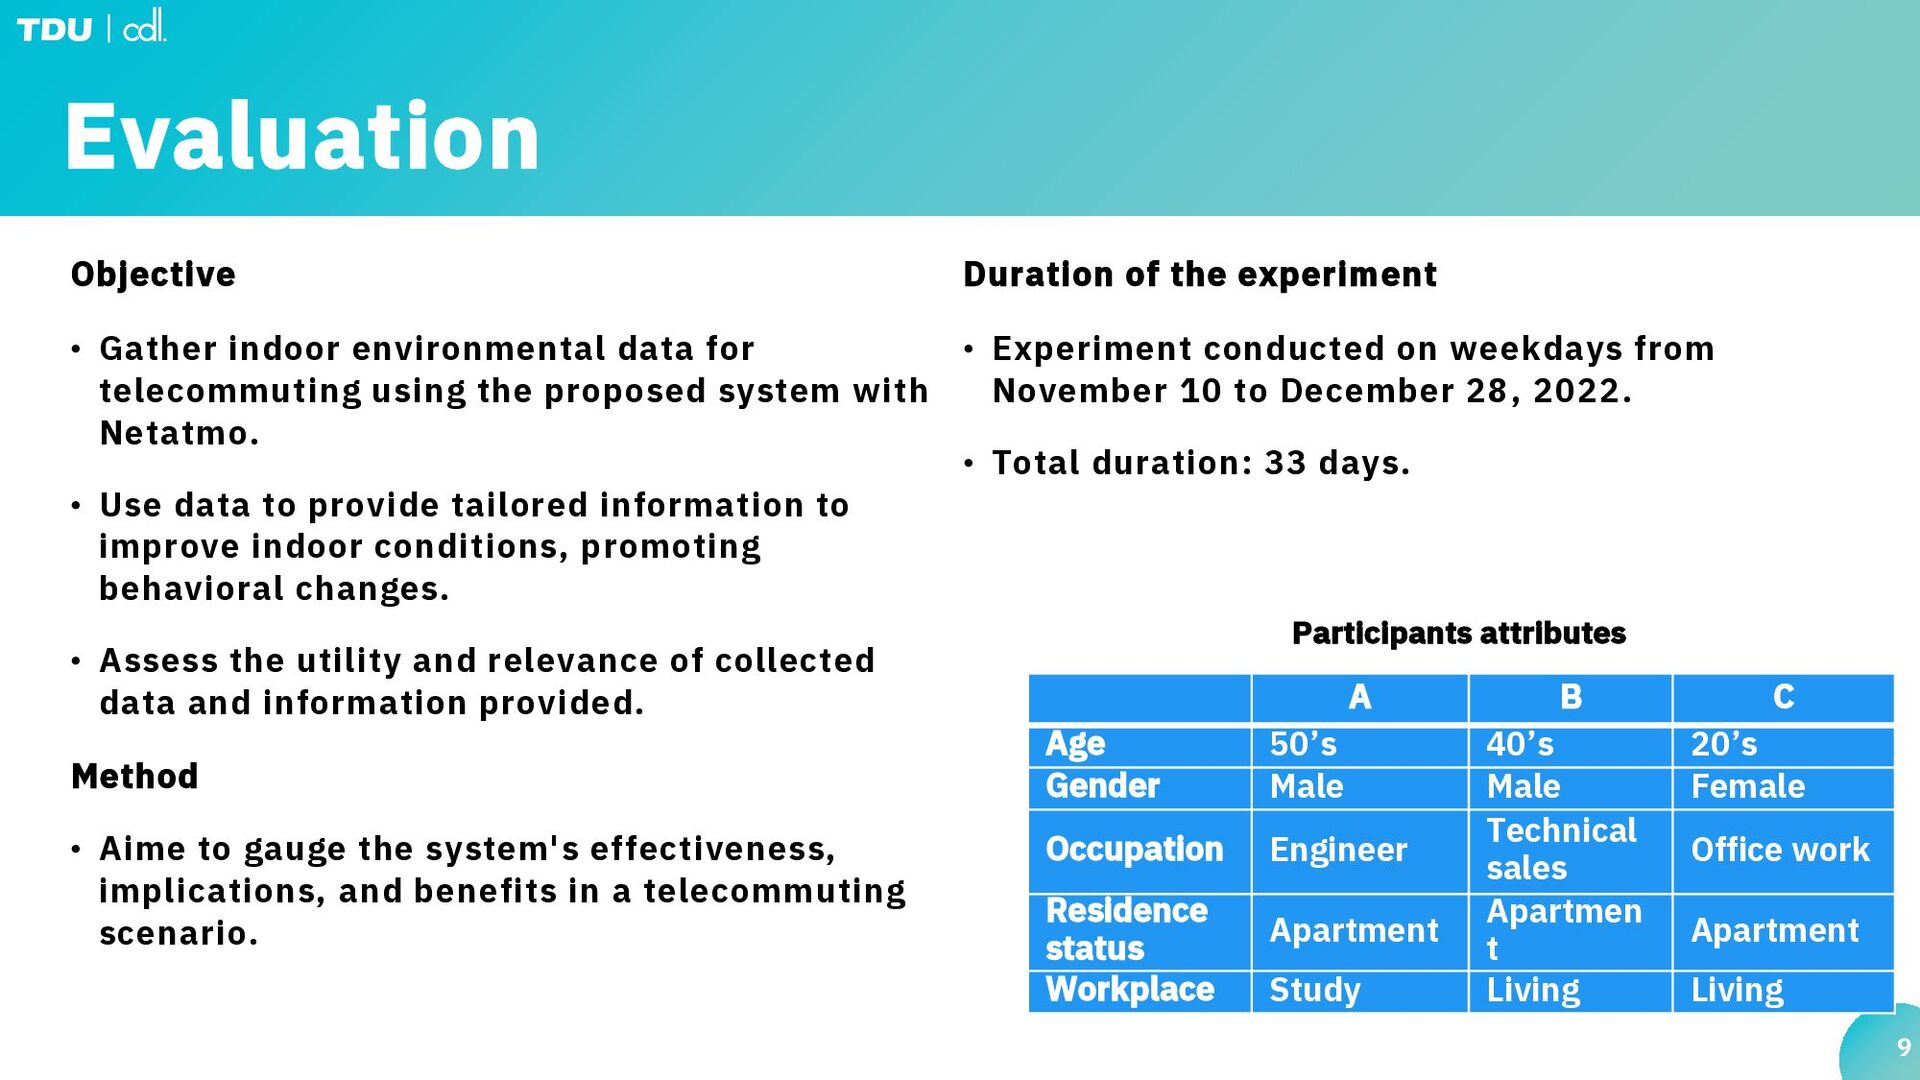
the proposed system with Netatmo. • Use data to provide tailored information to improve indoor conditions, promoting behavioral changes. • Assess the utility and relevance of collected data and information provided. Method • Aime to gauge the system's effectiveness, implications, and benefits in a telecommuting scenario. 9 A B C Age 50ʼs 40ʼs 20ʼs Gender Male Male Female Occupation Engineer Technical sales Office work Residence status Apartment Apartmen t Apartment Workplace Study Living Living Duration of the experiment • Experiment conducted on weekdays from November 10 to December 28, 2022. • Total duration: 33 days. Participants attributes
• Sends alerts based on bi-hourly assessments of humidity and carbon dioxide levels to indicate sub-optimal conditions. • Includes an alert system and a chatbot feature: • Chatbot provides immediate information about the workspace environment upon request. • The second, third, and fourth types of notifications are sent daily, regardless of working hours. 10 A B C During office hours Out of the office hours During office hours Out of the office hours During office hours Out of the office hours Notificati on function Type of information 1 182 296 160 349 82 134 Type of information 2 20 20 9 Type of information 3 13 14 5 Type of information 4 13 14 5 Alert function Humidity 42 149 0 0 0 0 CO2 94 7 255 537 7 45 Chatbot function - 0 0 0 0 0 0 Number of notifications 𝐼𝑛𝑓𝑜𝑟𝑚𝑎𝑡𝑖𝑜𝑛 𝑝𝑟𝑜𝑣𝑖𝑠𝑖𝑜𝑛 𝑟𝑎𝑡𝑒 = 𝑁𝑢𝑚𝑏𝑒𝑟 𝑜𝑓 𝑎𝑐𝑡𝑢𝑎𝑙 𝑛𝑜𝑡𝑖𝑓𝑖𝑐𝑎𝑡𝑖𝑜𝑛𝑠 𝐼𝑑𝑒𝑎𝑙 𝑛𝑢𝑚𝑏𝑒𝑟 𝑜𝑓 𝑛𝑜𝑡𝑖𝑓𝑖𝑐𝑎𝑡𝑖𝑜𝑛𝑠 ∗ 100
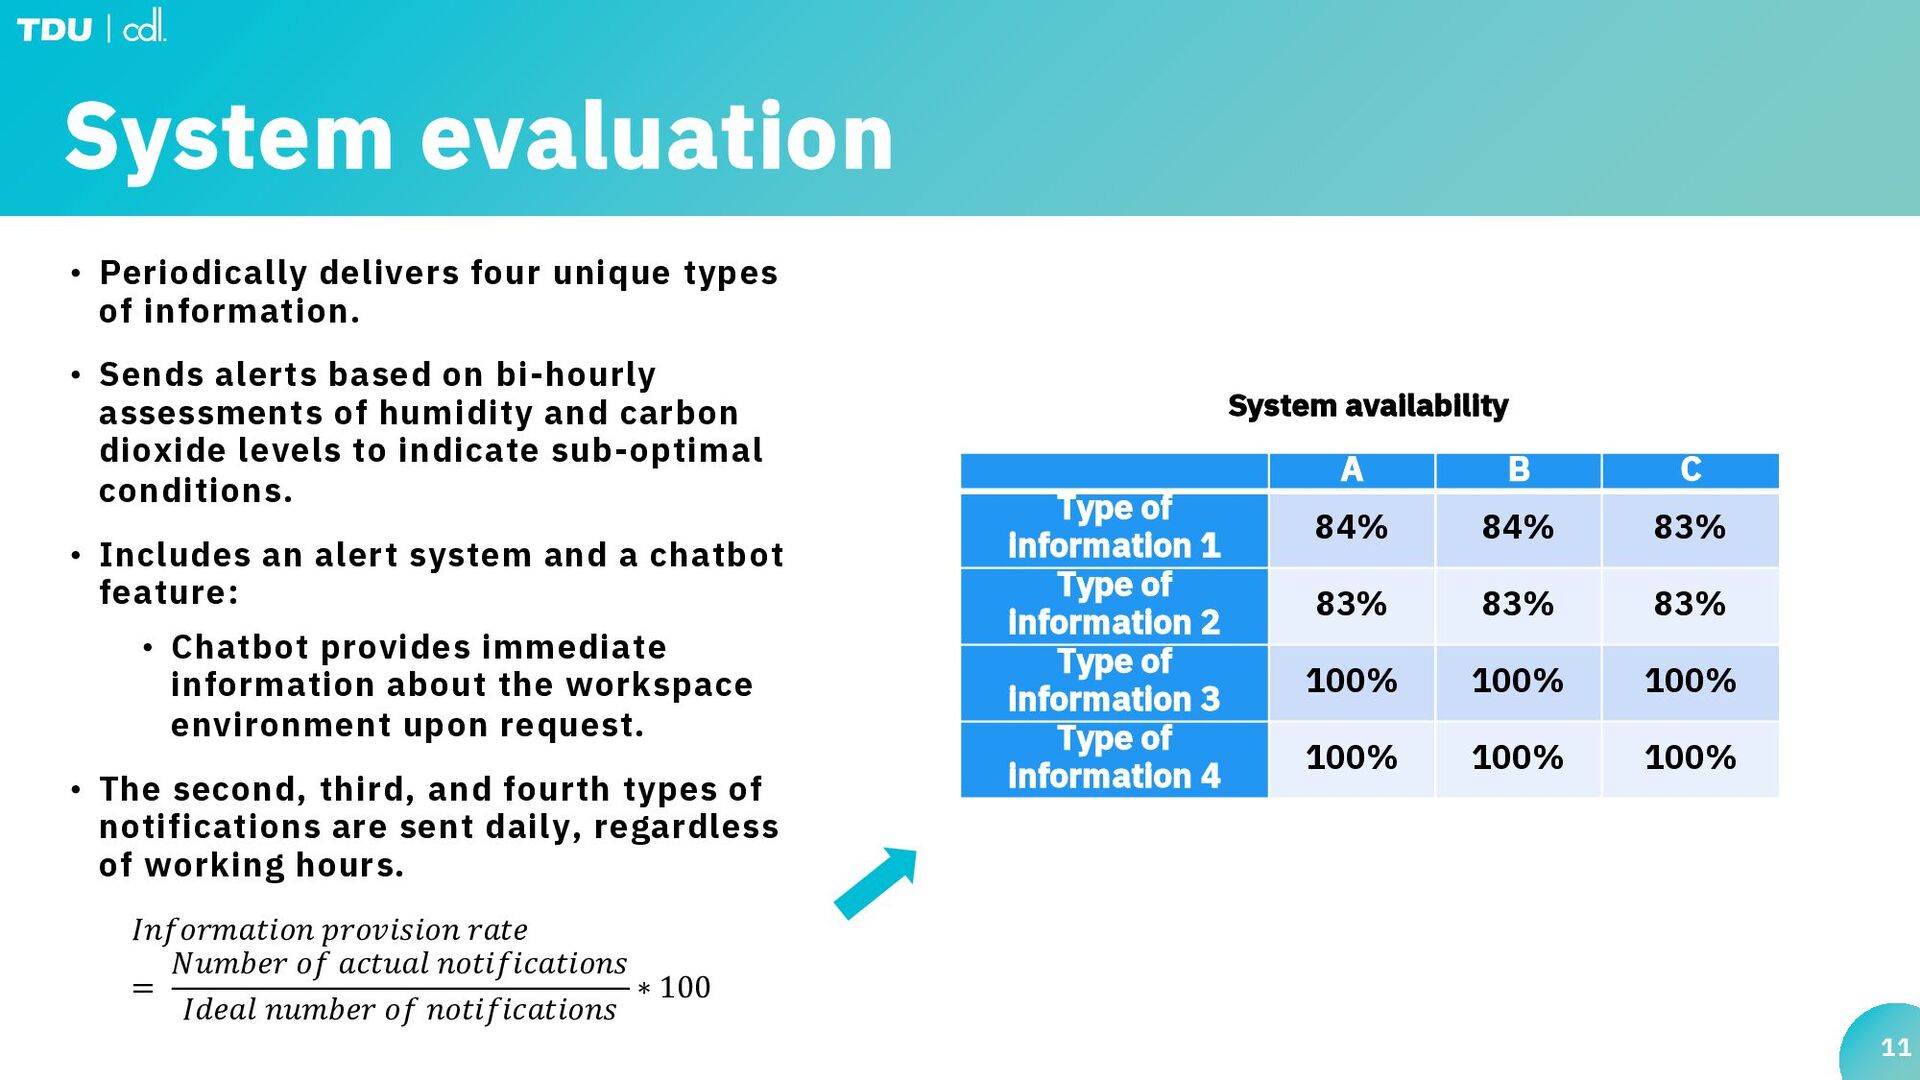
• Sends alerts based on bi-hourly assessments of humidity and carbon dioxide levels to indicate sub-optimal conditions. • Includes an alert system and a chatbot feature: • Chatbot provides immediate information about the workspace environment upon request. • The second, third, and fourth types of notifications are sent daily, regardless of working hours. 11 System availability 𝐼𝑛𝑓𝑜𝑟𝑚𝑎𝑡𝑖𝑜𝑛 𝑝𝑟𝑜𝑣𝑖𝑠𝑖𝑜𝑛 𝑟𝑎𝑡𝑒 = 𝑁𝑢𝑚𝑏𝑒𝑟 𝑜𝑓 𝑎𝑐𝑡𝑢𝑎𝑙 𝑛𝑜𝑡𝑖𝑓𝑖𝑐𝑎𝑡𝑖𝑜𝑛𝑠 𝐼𝑑𝑒𝑎𝑙 𝑛𝑢𝑚𝑏𝑒𝑟 𝑜𝑓 𝑛𝑜𝑡𝑖𝑓𝑖𝑐𝑎𝑡𝑖𝑜𝑛𝑠 ∗ 100 A B C Type of information 1 84% 84% 83% Type of information 2 83% 83% 83% Type of information 3 100% 100% 100% Type of information 4 100% 100% 100%
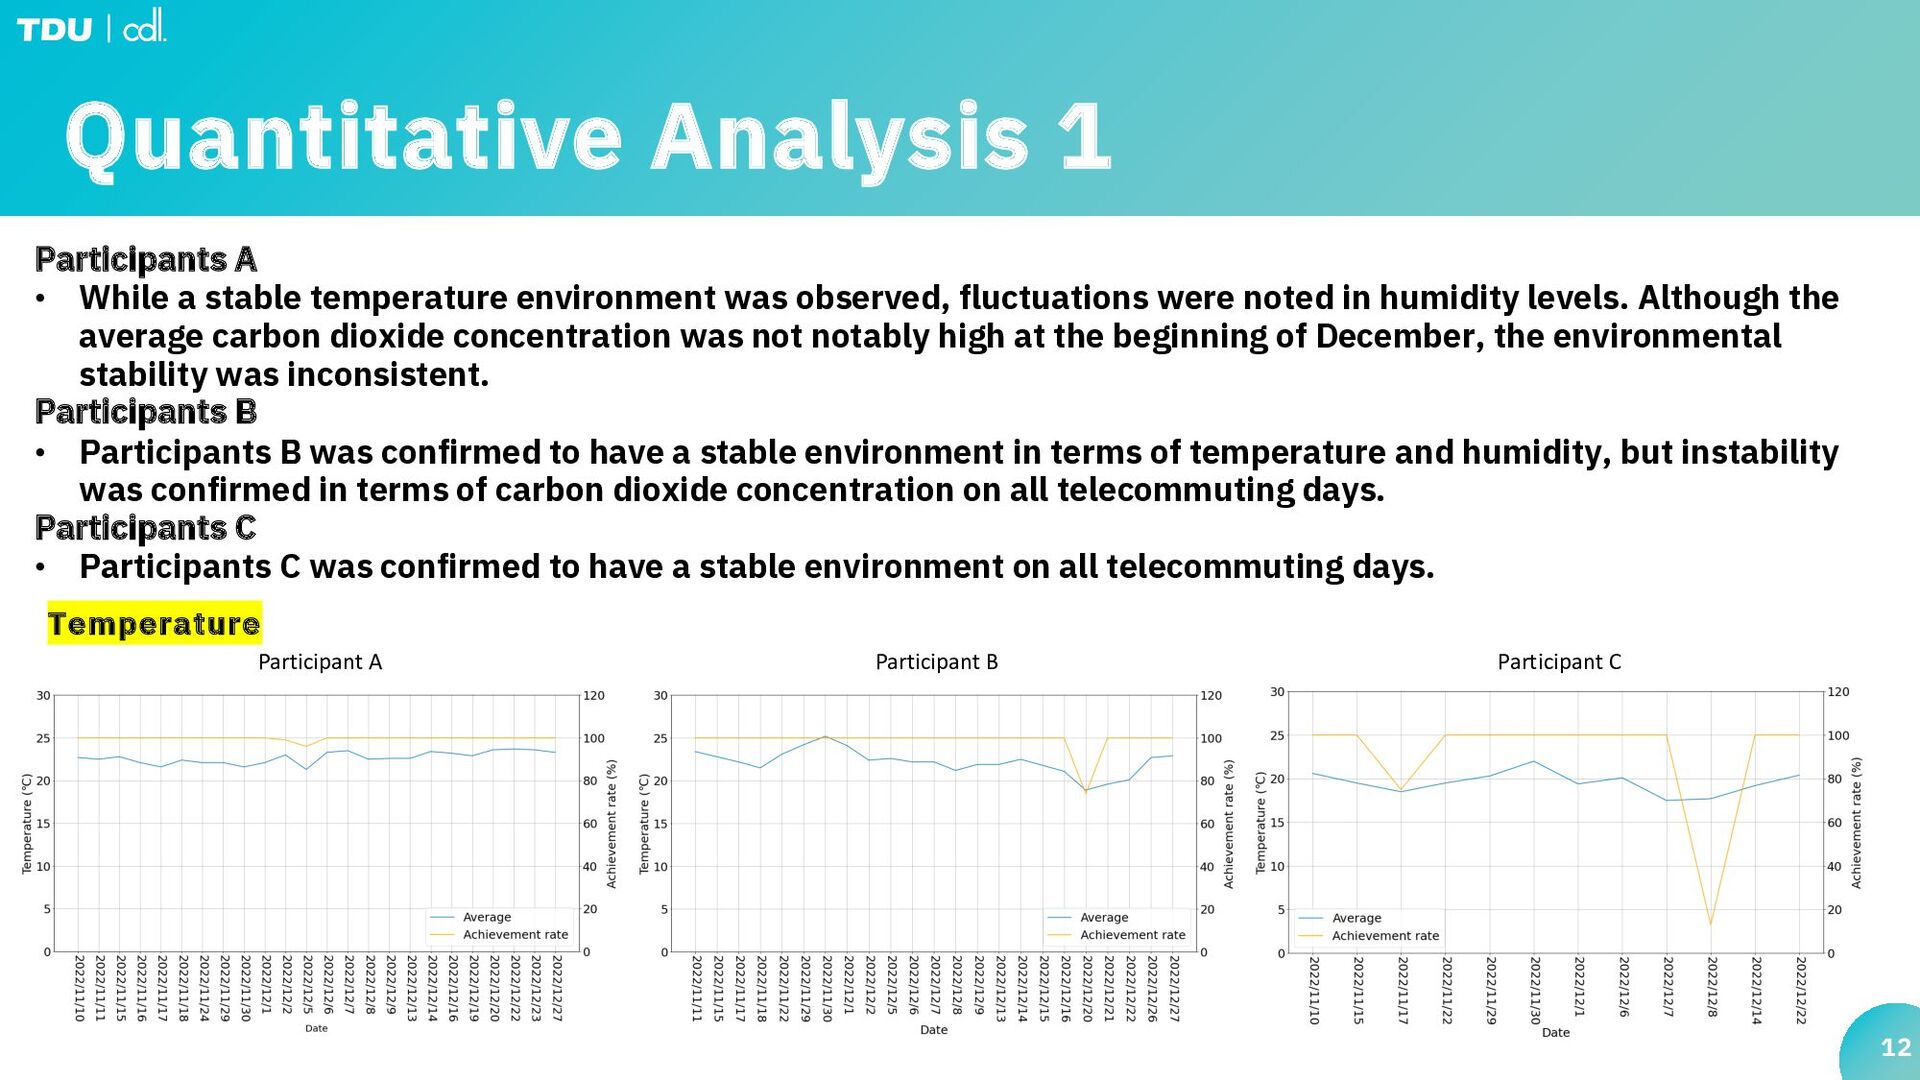
temperature environment was observed, fluctuations were noted in humidity levels. Although the average carbon dioxide concentration was not notably high at the beginning of December, the environmental stability was inconsistent. Participants B • Participants B was confirmed to have a stable environment in terms of temperature and humidity, but instability was confirmed in terms of carbon dioxide concentration on all telecommuting days. Participants C • Participants C was confirmed to have a stable environment on all telecommuting days. Temperature Participant A Participant B Participant C
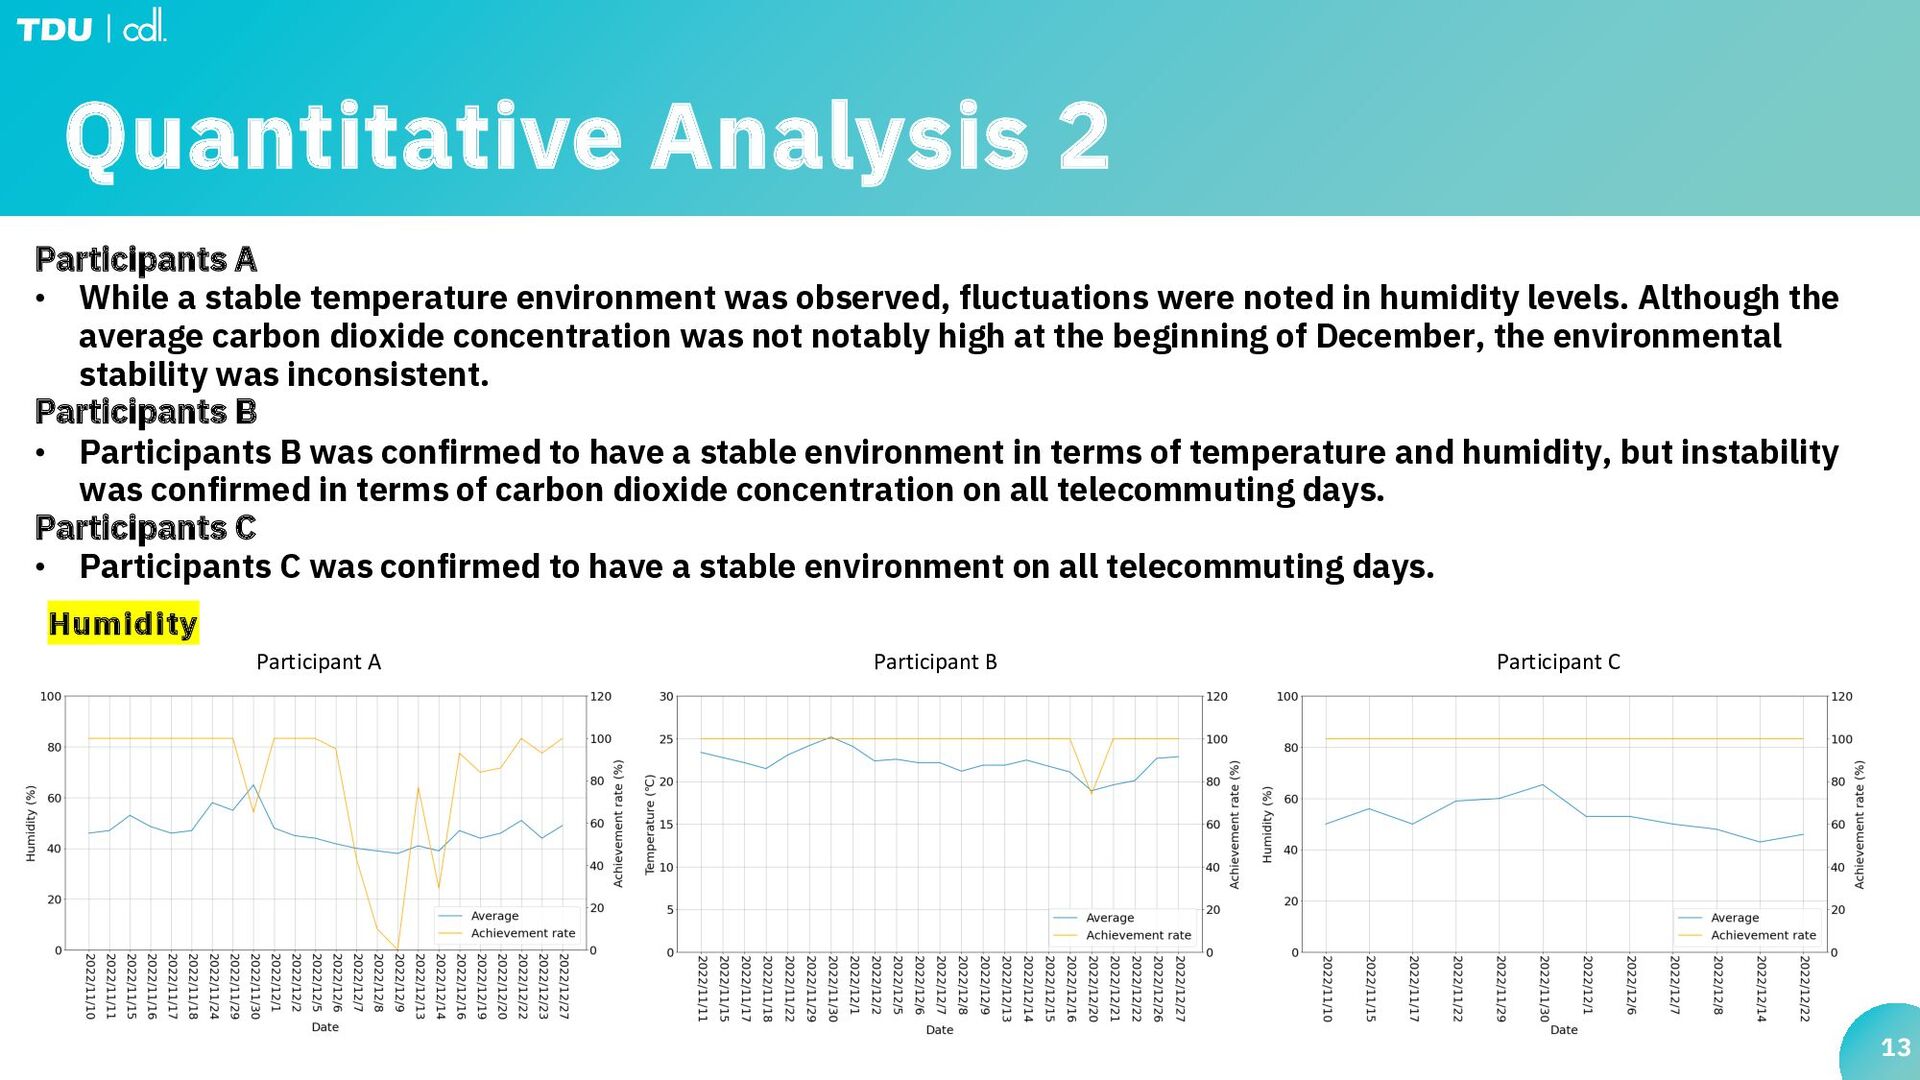
temperature environment was observed, fluctuations were noted in humidity levels. Although the average carbon dioxide concentration was not notably high at the beginning of December, the environmental stability was inconsistent. Participants B • Participants B was confirmed to have a stable environment in terms of temperature and humidity, but instability was confirmed in terms of carbon dioxide concentration on all telecommuting days. Participants C • Participants C was confirmed to have a stable environment on all telecommuting days. Humidity Participant A Participant B Participant C
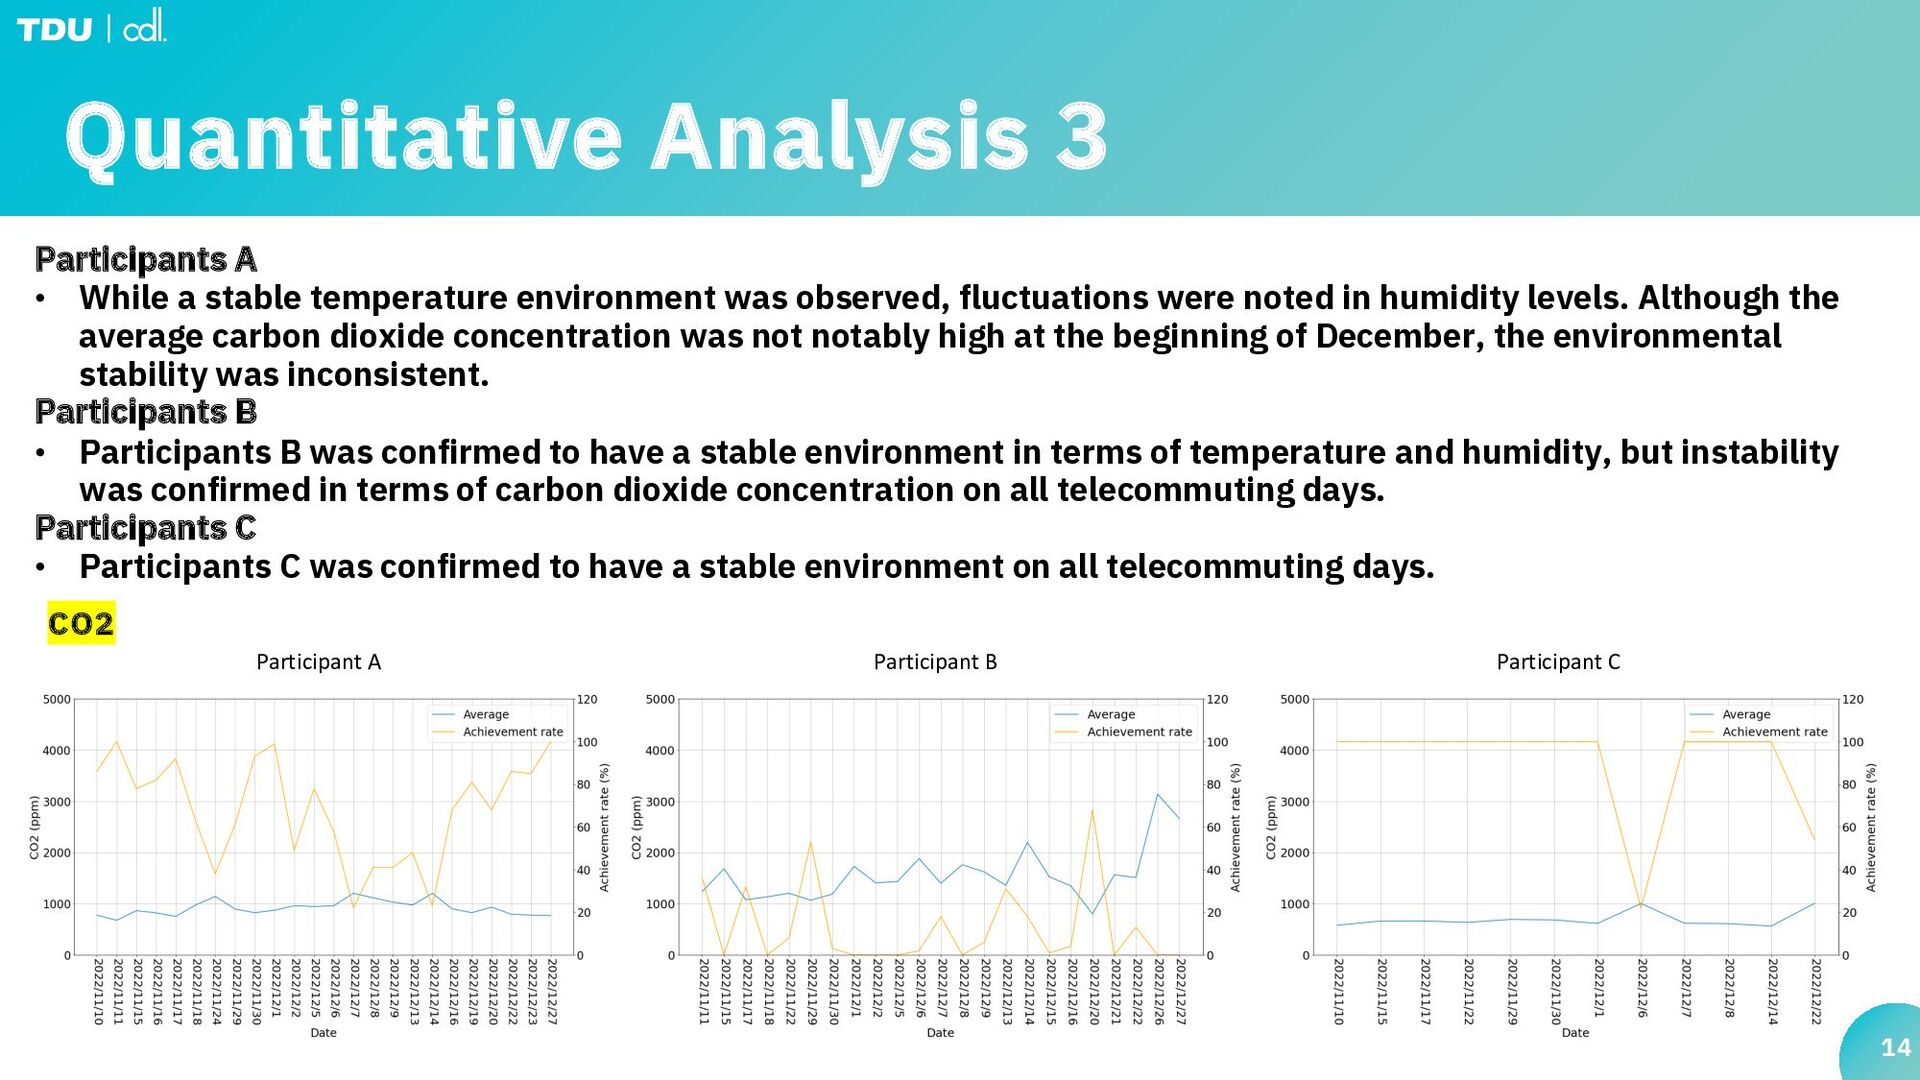
temperature environment was observed, fluctuations were noted in humidity levels. Although the average carbon dioxide concentration was not notably high at the beginning of December, the environmental stability was inconsistent. Participants B • Participants B was confirmed to have a stable environment in terms of temperature and humidity, but instability was confirmed in terms of carbon dioxide concentration on all telecommuting days. Participants C • Participants C was confirmed to have a stable environment on all telecommuting days. CO2 Participant A Participant B Participant C
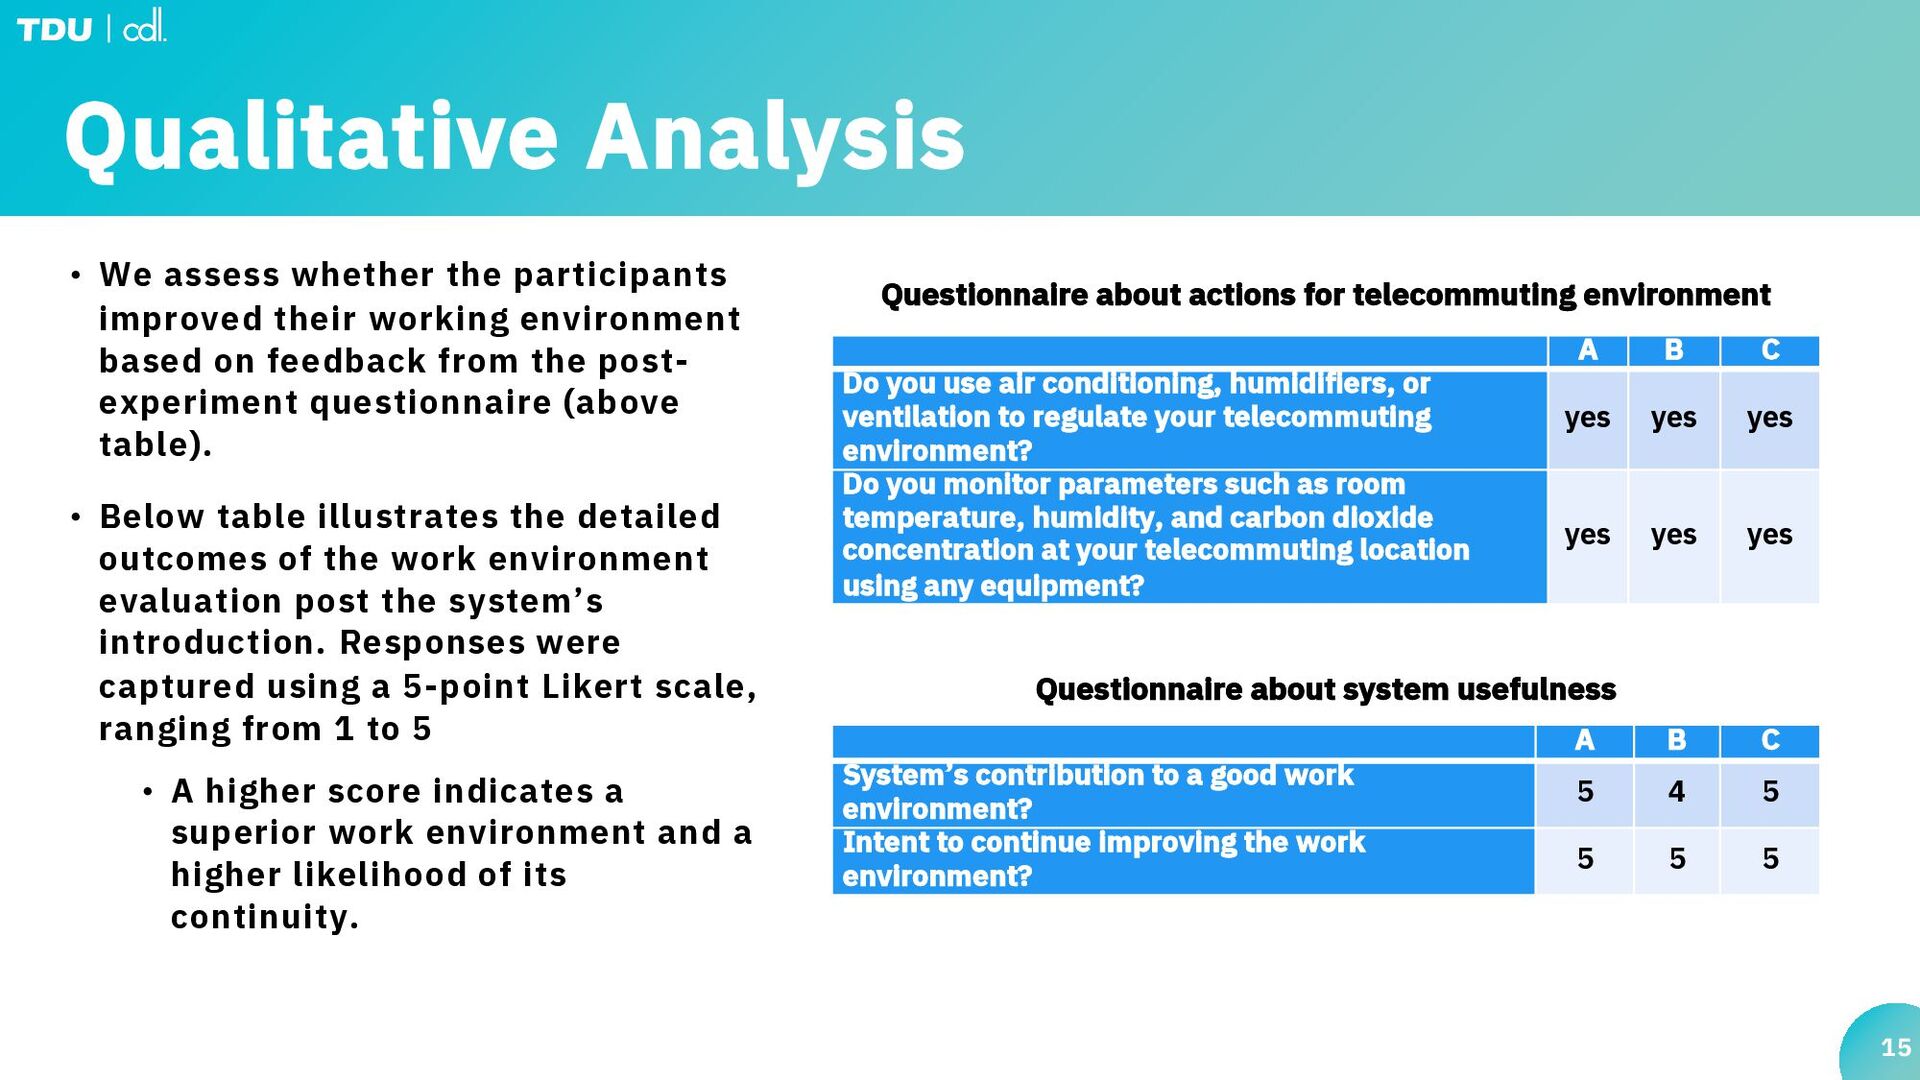
their working environment based on feedback from the post- experiment questionnaire (above table). • Below table illustrates the detailed outcomes of the work environment evaluation post the systemʼs introduction. Responses were captured using a 5-point Likert scale, ranging from 1 to 5 • A higher score indicates a superior work environment and a higher likelihood of its continuity. A B C Do you use air conditioning, humidifiers, or ventilation to regulate your telecommuting environment? yes yes yes Do you monitor parameters such as room temperature, humidity, and carbon dioxide concentration at your telecommuting location using any equipment? yes yes yes A B C Systemʼs contribution to a good work environment? 5 4 5 Intent to continue improving the work environment? 5 5 5 Questionnaire about actions for telecommuting environment Questionnaire about system usefulness
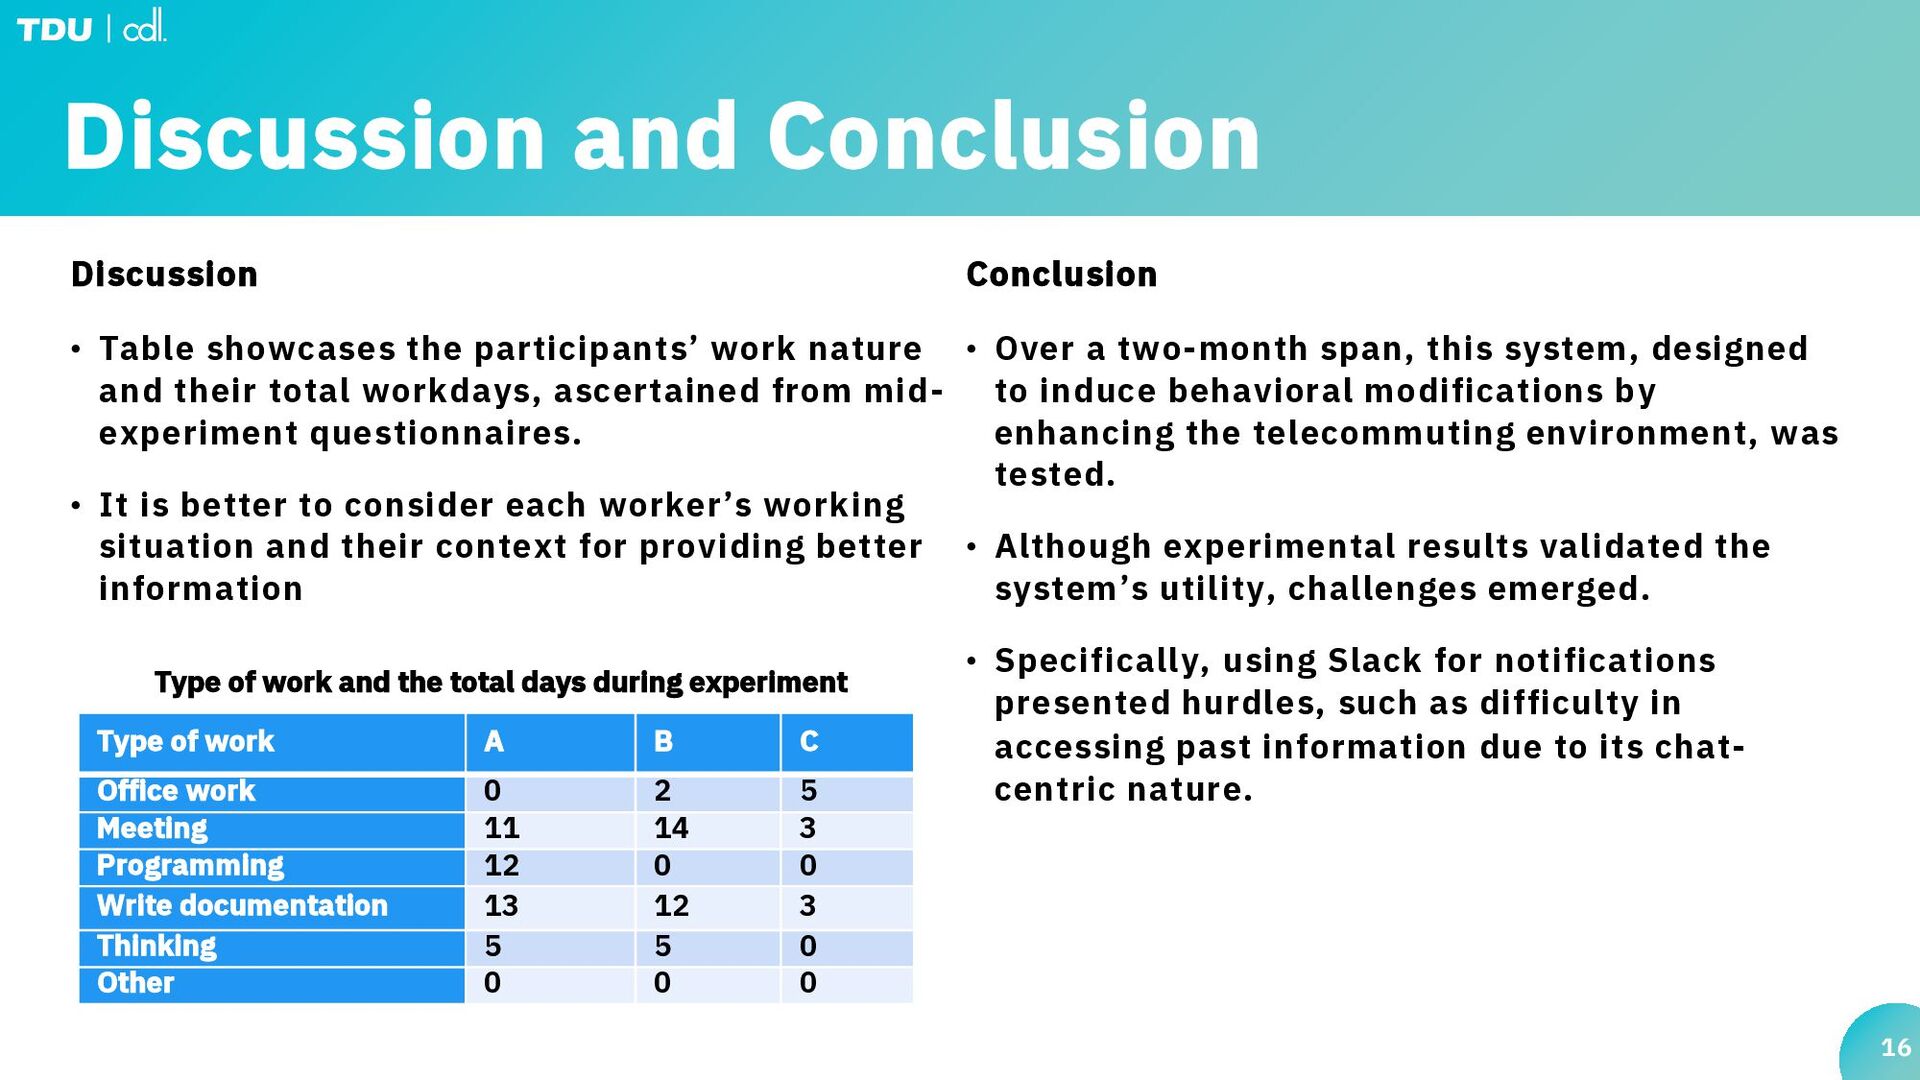
nature and their total workdays, ascertained from mid- experiment questionnaires. • It is better to consider each workerʼs working situation and their context for providing better information 16 Conclusion • Over a two-month span, this system, designed to induce behavioral modifications by enhancing the telecommuting environment, was tested. • Although experimental results validated the systemʼs utility, challenges emerged. • Specifically, using Slack for notifications presented hurdles, such as difficulty in accessing past information due to its chat- centric nature. Type of work A B C Office work 0 2 5 Meeting 11 14 3 Programming 12 0 0 Write documentation 13 12 3 Thinking 5 5 0 Other 0 0 0 Type of work and the total days during experiment