the game is component separation, not noise reduction" H.K. Eriksen ❖ Dust and synchrotron foregrounds in CMB data ❖ De-lensing of CMB data for primordial gravitational waves ❖ CIB measurements ❖ Extinction for cosmological galaxy surveys Daniel Lenz, Caltech/JPL An improved, unbiased E(B-V) map 2
E(B-V) = Extinction in B band - Extinction in V band ❖ More dust => larger E(B-V) ❖ E(B-V) maps essential for correcting observations for Galactic reddening 4
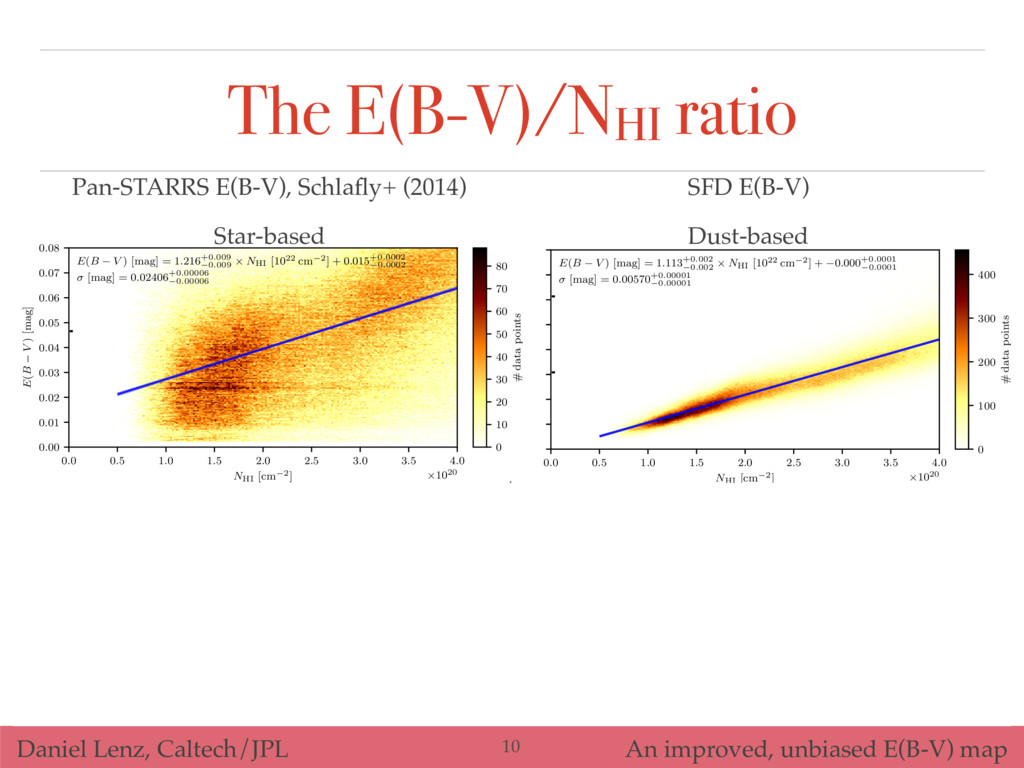
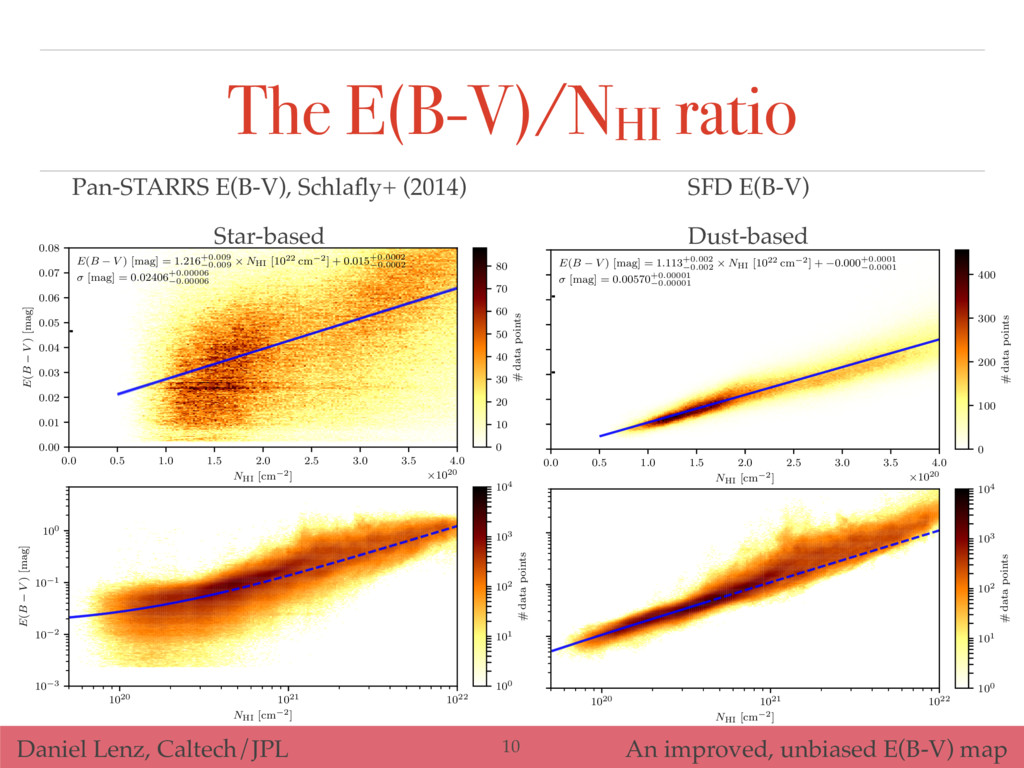
Direct approach ❖ Find many sources with known spectrum (e.g. stars, passive galaxies) ❖ Measure spectra, attribute differences to dust ❖ E.g. Schlafly+ 2014 used 500 million stars from Pan-STARRS to measure reddening to 4.5 kpc ❖ Direct measurements are hard! ❖ Photometric/ spectroscopic errors ❖ Ensuring sources lie behind full dust column ❖ Ensuring adequate number of sources have been measured 5
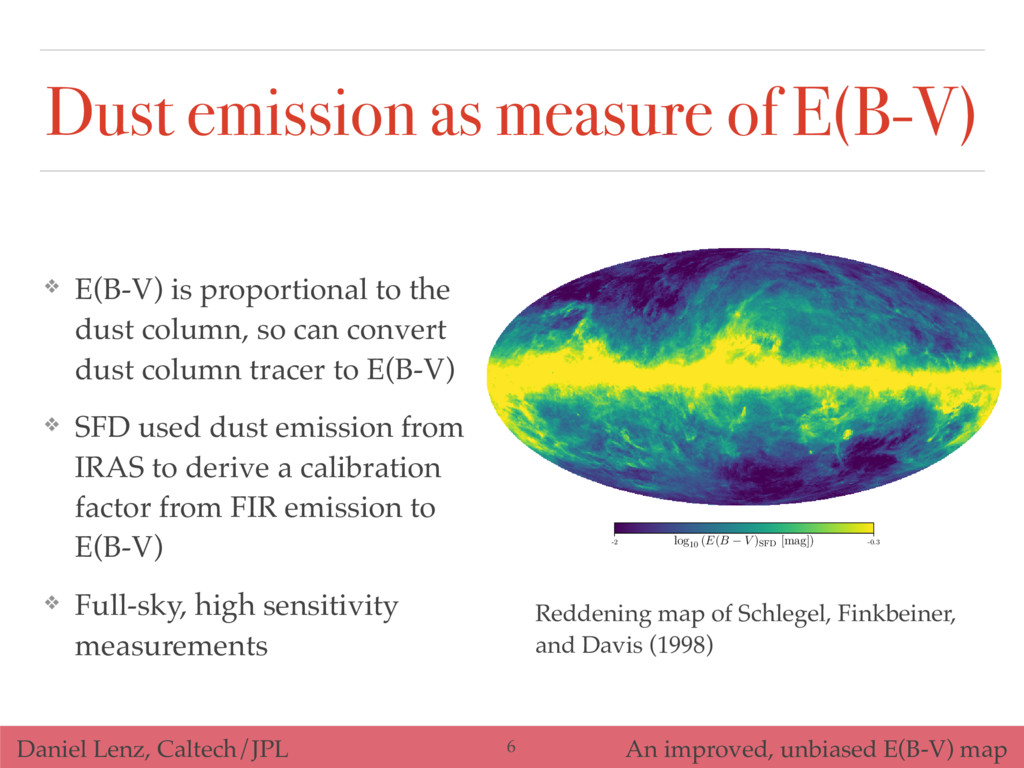
as measure of E(B-V) ❖ E(B-V) is proportional to the dust column, so can convert dust column tracer to E(B-V) ❖ SFD used dust emission from IRAS to derive a calibration factor from FIR emission to E(B-V) ❖ Full-sky, high sensitivity measurements -2 -0.3 log10 (E(B V )SFD [mag]) Reddening map of Schlegel, Finkbeiner, and Davis (1998) 6
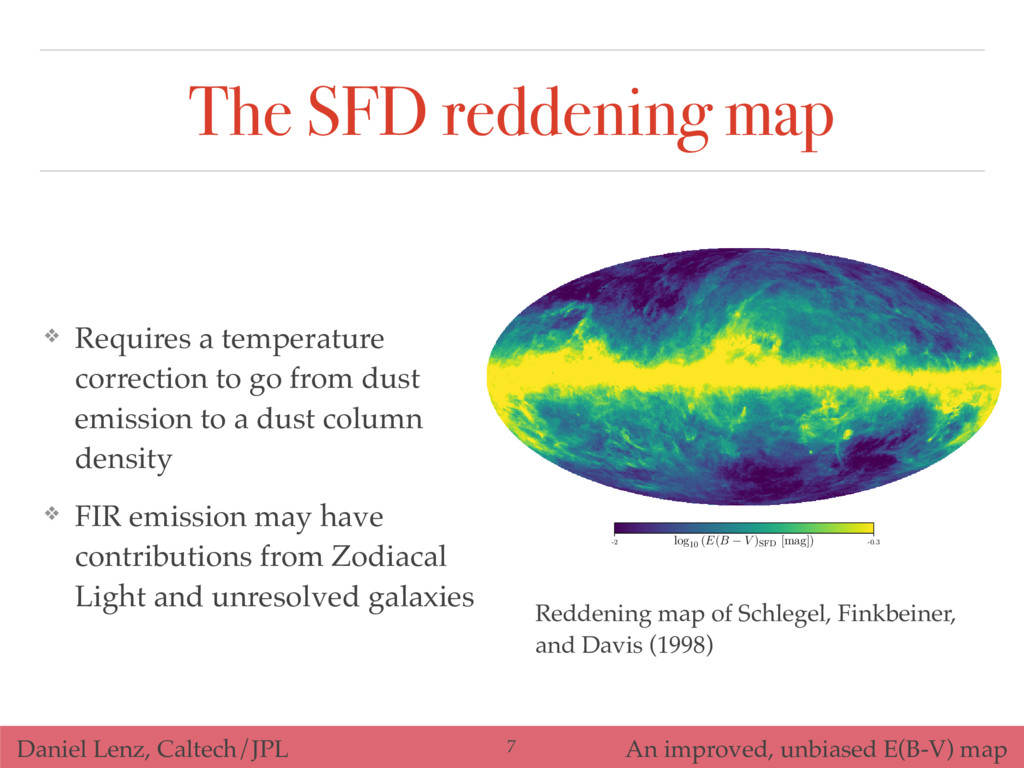
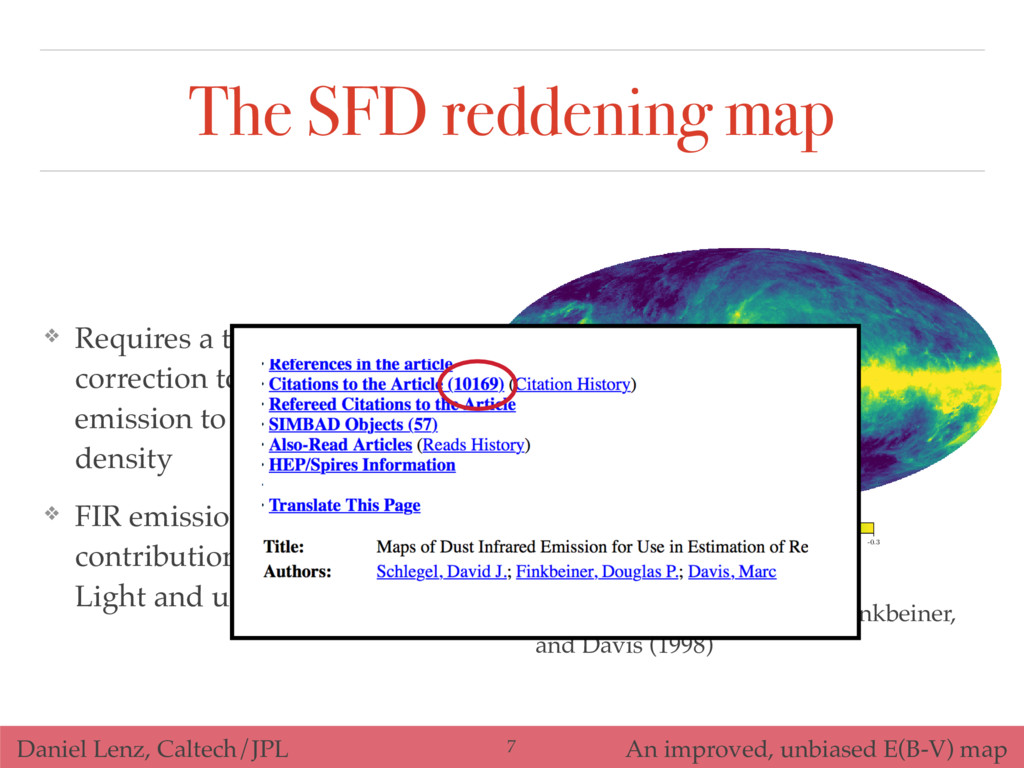
reddening map ❖ Requires a temperature correction to go from dust emission to a dust column density ❖ FIR emission may have contributions from Zodiacal Light and unresolved galaxies -2 -0.3 log10 (E(B V )SFD [mag]) Reddening map of Schlegel, Finkbeiner, and Davis (1998) 7
reddening map ❖ Requires a temperature correction to go from dust emission to a dust column density ❖ FIR emission may have contributions from Zodiacal Light and unresolved galaxies -2 -0.3 log10 (E(B V )SFD [mag]) Reddening map of Schlegel, Finkbeiner, and Davis (1998) 7
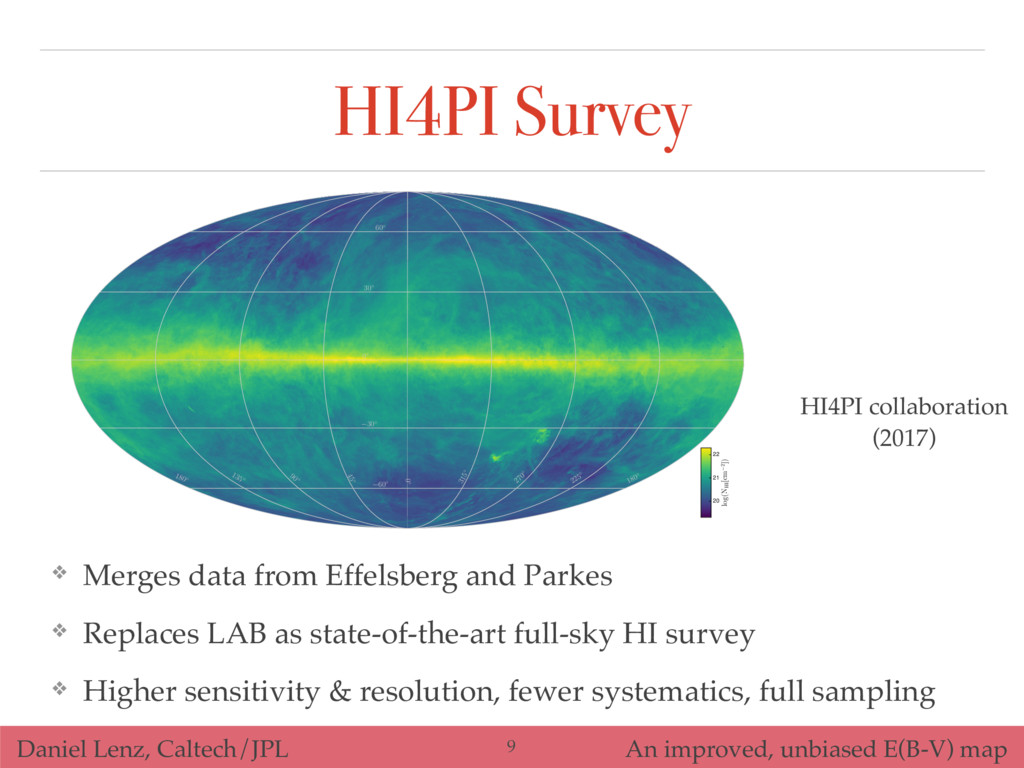
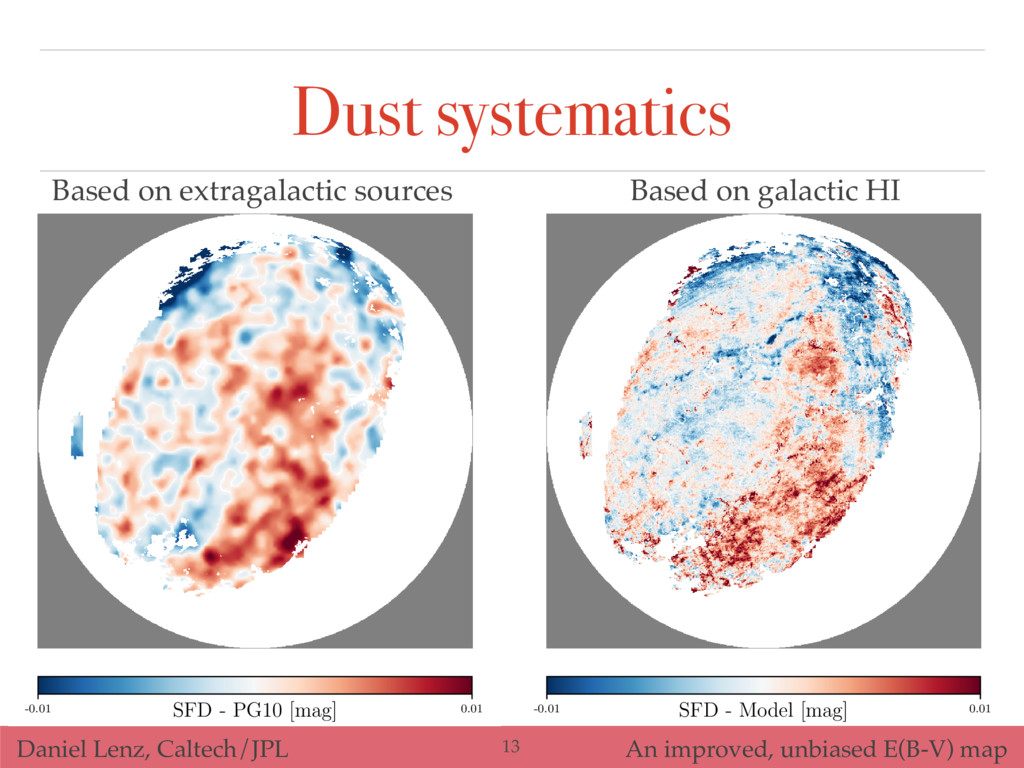
as basis for E(B-V) ❖ Gas and dust are well-coupled in the ISM ❖ Perform an SFD-like analysis to convert HI emission to E(B-V) ❖ Resulting maps free from errors due to dust temperature, Zodi, and extragalactic emission ❖ Limited by non-HI gas along the line of sight 8
❖ Several large-scale data sets available, all of which do not significantly improve the model ❖ A future work would need to combine multiphase gaseous data, FIR dust data, and Pan- STARRS/Gaia data 0.5 1.0 1.5 2.0 WCO [K km s 1] 0.04 0.02 0.00 0.02 0.04 SFD Model [mag] 0.5 1.0 1.5 2.0 2.5 3.0 SCII [nW m 2 sr 1] 0.04 0.02 0.00 0.02 0.04 SFD Model [mag] 1 2 3 4 H↵ [Rayleighs] 0.04 0.02 0.00 0.02 0.04 SFD Model [mag] 100 101 102 103 104 105 # data points 15
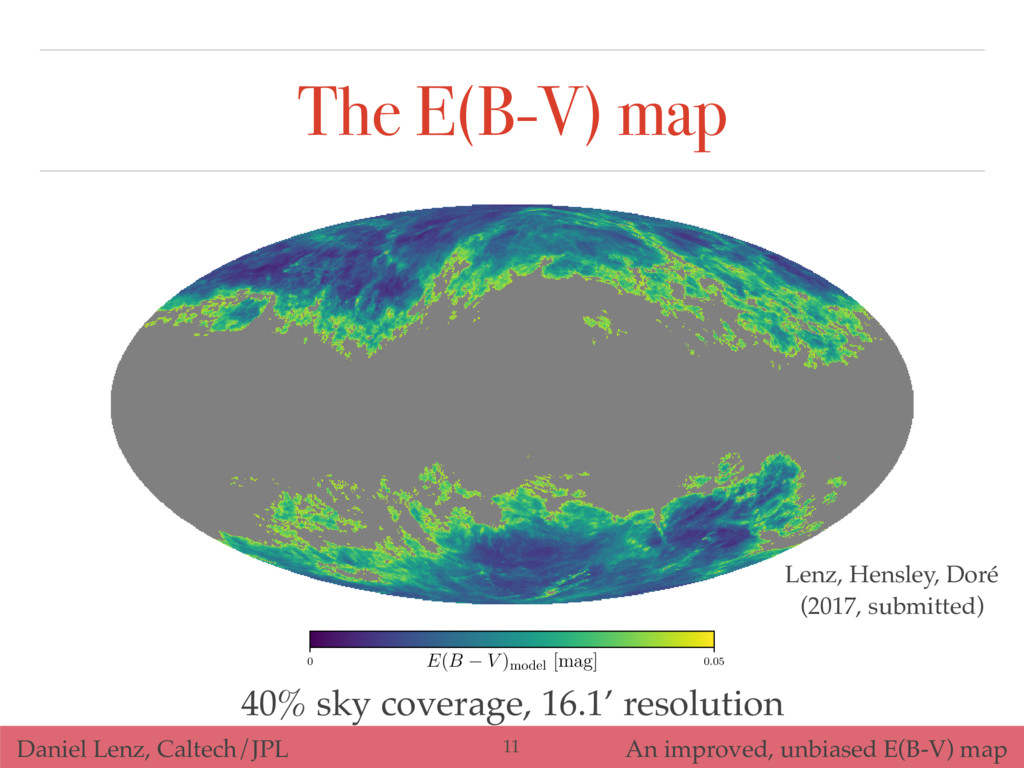
why to use this extinction map ❖ New HI based extinction map ❖ In line with independent corrections, but much higher resolution and better sky coverage ❖ Yahata+ (2007) find correlation of SFD with large-scale structure ❖ For high latitudes, our map overcomes many of the SFD problems and is much more sensitive than stellar data- based E(B-V) maps 16