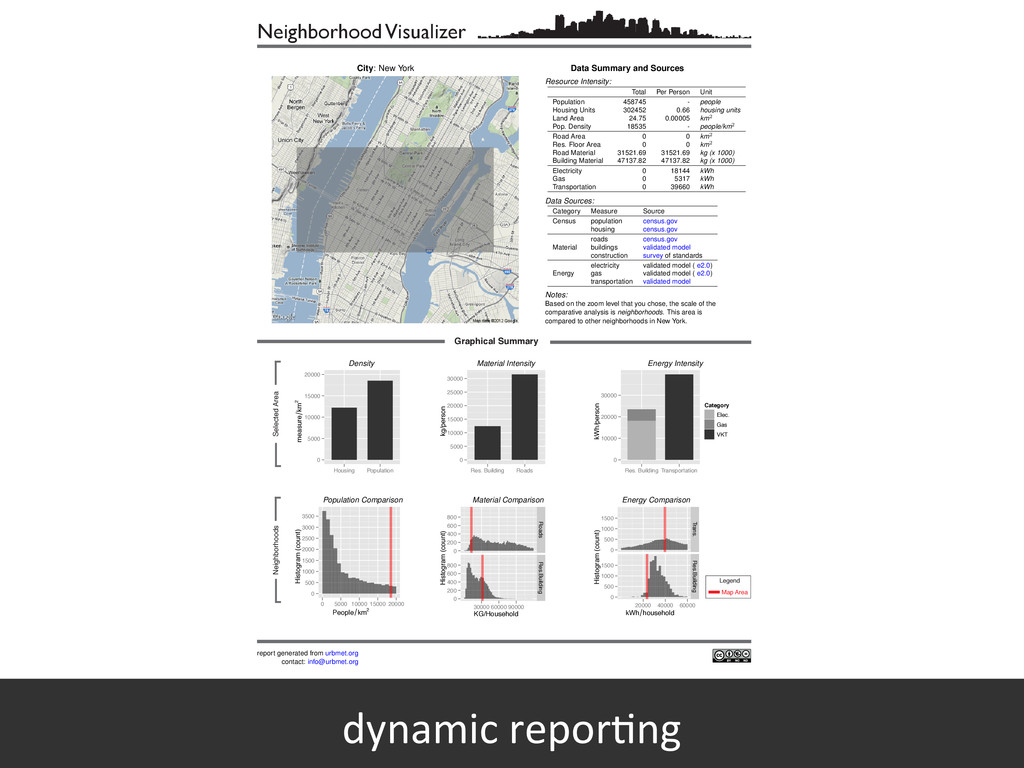
YORK CITY NEW YORK CITY NEW YORK CITY MINNEAPOLIS PHILADELPHIA MIAMI DETROIT HOUSTON CLEVELAND BOSTON Graphical Summary report generated from urbmet.org contact: [email protected] City : New York Selected Area Neighborhoods Data Summary and Sources Resource Intensity: Total Per Person Unit Population 458745 - people Housing Units 302452 0.66 housing units Land Area 24.75 0.00005 km 2 Pop. Density 18535 - people/km 2 Road Area 0 0 km 2 Res. Floor Area 0 0 km 2 Road Material 31521.69 31521.69 kg (x 1000) Building Material 47137.82 47137.82 kg (x 1000) Electricity 0 18144 kWh Gas 0 5317 kWh Transportation 0 39660 kWh Data Sources: Category Measure Source Census population census.gov housing census.gov Material roads census.gov buildings validated model construction survey of standards Energy electricity validated model ( e2.0) gas validated model ( e2.0) transportation validated model Notes: Based on the zoom level that you chose, the scale of the comparative analysis is neighborhoods . This area is compared to other neighborhoods in New York. measure km2 0 5000 10000 15000 20000 Housing Population kg/person 0 5000 10000 15000 20000 25000 30000 Res. Building Roads kWh/person 0 10000 20000 30000 Res. Building Transportation Category Elec. Gas VKT Density Material Intensity Energy Intensity People km2 Histogram (count) 0 500 1000 1500 2000 2500 3000 3500 0 5000 10000 15000 20000 KG/Household Histogram (count) 0 200 400 600 800 0 200 400 600 800 30000 60000 90000 Roads Res.Building kWh household Histogram (count) 0 500 1000 1500 0 500 1000 1500 20000 40000 60000 Trans. Res.Building Population Comparison Material Comparison Energy Comparison Map Area Legend 1 dynamic repor6ng
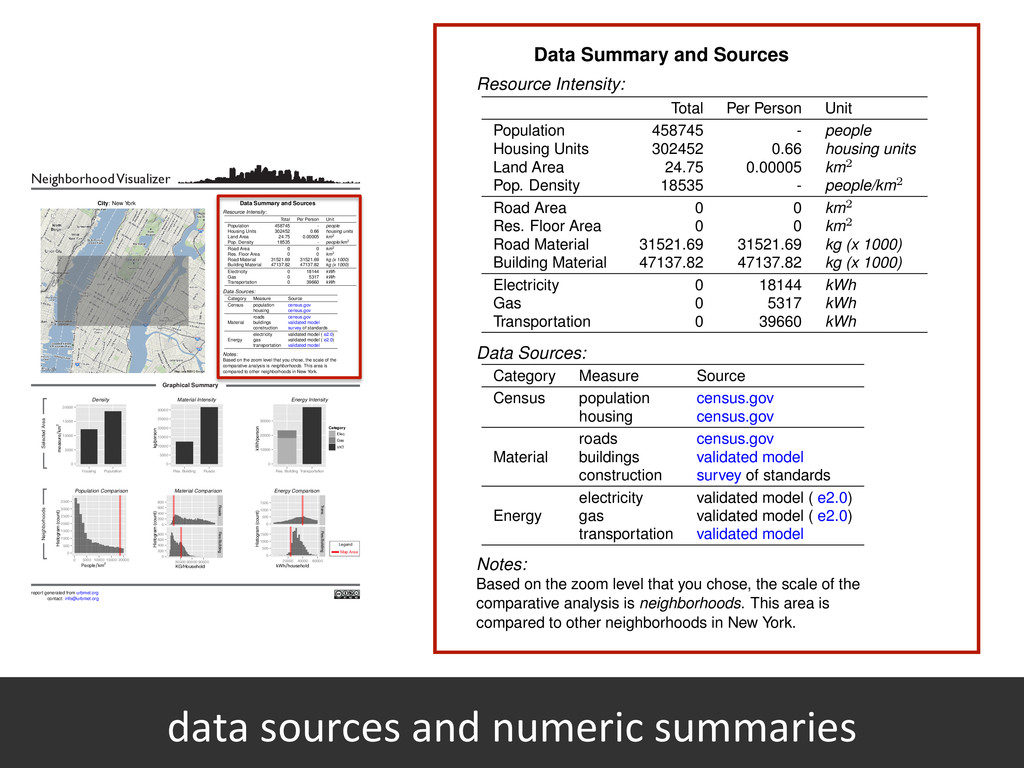
YORK CITY NEW YORK CITY NEW YORK CITY MINNEAPOLIS PHILADELPHIA MIAMI DETROIT HOUSTON CLEVELAND BOSTON Graphical Summary report generated from urbmet.org contact: [email protected] City : New York Selected Area Neighborhoods Data Summary and Sources Resource Intensity: Total Per Person Unit Population 458745 - people Housing Units 302452 0.66 housing units Land Area 24.75 0.00005 km 2 Pop. Density 18535 - people/km 2 Road Area 0 0 km 2 Res. Floor Area 0 0 km 2 Road Material 31521.69 31521.69 kg (x 1000) Building Material 47137.82 47137.82 kg (x 1000) Electricity 0 18144 kWh Gas 0 5317 kWh Transportation 0 39660 kWh Data Sources: Category Measure Source Census population census.gov housing census.gov Material roads census.gov buildings validated model construction survey of standards Energy electricity validated model ( e2.0) gas validated model ( e2.0) transportation validated model Notes: Based on the zoom level that you chose, the scale of the comparative analysis is neighborhoods . This area is compared to other neighborhoods in New York. measure km2 0 5000 10000 15000 20000 Housing Population kg/person 0 5000 10000 15000 20000 25000 30000 Res. Building Roads kWh/person 0 10000 20000 30000 Res. Building Transportation Category Elec. Gas VKT Density Material Intensity Energy Intensity People km2 Histogram (count) 0 500 1000 1500 2000 2500 3000 3500 0 5000 10000 15000 20000 KG/Household Histogram (count) 0 200 400 600 800 0 200 400 600 800 30000 60000 90000 Roads Res.Building kWh household Histogram (count) 0 500 1000 1500 0 500 1000 1500 20000 40000 60000 Trans. Res.Building Population Comparison Material Comparison Energy Comparison Map Area Legend 1 City : New York Data Summary and Sources Resource Intensity: Total Per Person Unit Population 458745 - people Housing Units 302452 0.66 housing units Land Area 24.75 0.00005 km 2 Pop. Density 18535 - people/km 2 Road Area 0 0 km 2 Res. Floor Area 0 0 km 2 Road Material 31521.69 31521.69 kg (x 1000) Building Material 47137.82 47137.82 kg (x 1000) Electricity 0 18144 kWh Gas 0 5317 kWh Transportation 0 39660 kWh Data Sources: Category Measure Source Census population census.gov housing census.gov Material roads census.gov buildings validated model construction survey of standards Energy electricity validated model ( e2.0) gas validated model ( e2.0) transportation validated model Notes: Based on the zoom level that you chose, the scale of the comparative analysis is neighborhoods . This area is compared to other neighborhoods in New York. Density Material Intensity Energy Intensity borhood Visualizer ATLANTA CHICAGO DALLAS LOS ANGELES NEW YORK CITY NEW YORK CITY NEW YORK CITY MINNEAPOLIS PHILADELPHIA MIAMI DETROIT HOUSTON CLEVELAND BOSTON Graphical Summary rom urbmet.org [email protected] City : New York Data Summary and Sources Resource Intensity: Total Per Person Unit Population 458745 - people Housing Units 302452 0.66 housing units Land Area 24.75 0.00005 km 2 Pop. Density 18535 - people/km 2 Road Area 0 0 km 2 Res. Floor Area 0 0 km 2 Road Material 31521.69 31521.69 kg (x 1000) Building Material 47137.82 47137.82 kg (x 1000) Electricity 0 18144 kWh Gas 0 5317 kWh Transportation 0 39660 kWh Data Sources: Category Measure Source Census population census.gov housing census.gov Material roads census.gov buildings validated model construction survey of standards Energy electricity validated model ( e2.0) gas validated model ( e2.0) transportation validated model Notes: Based on the zoom level that you chose, the scale of the comparative analysis is neighborhoods . This area is compared to other neighborhoods in New York. 0 000 000 000 000 Housing Population kg/person 0 5000 10000 15000 20000 25000 30000 Res. Building Roads kWh/person 0 10000 20000 30000 Res. Building Transportation Category Elec. Gas VKT Density Material Intensity Energy Intensity People km2 0 0 0 0 0 0 0 0 0 5000 10000 15000 20000 KG/Household Histogram (count) 0 200 400 600 800 0 200 400 600 800 30000 60000 90000 Roads Res.Building kWh household Histogram (count) 0 500 1000 1500 0 500 1000 1500 20000 40000 60000 Trans. Res.Building Population Comparison Material Comparison Energy Comparison Map Area Legend 1 data sources and numeric summaries
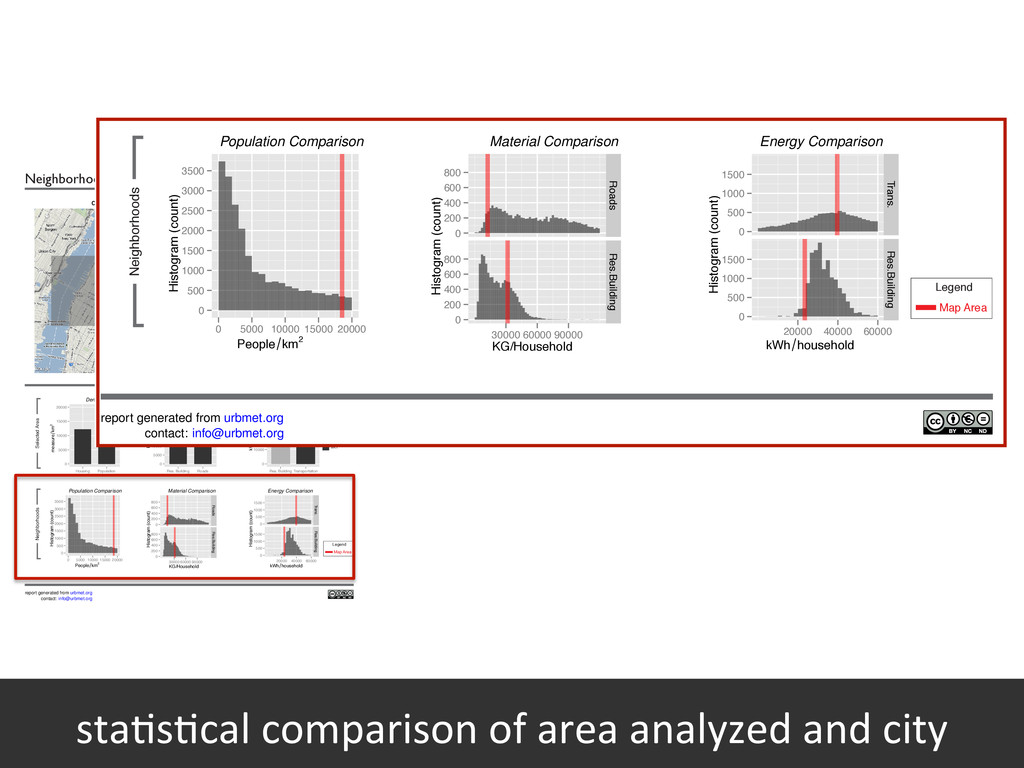
YORK CITY NEW YORK CITY NEW YORK CITY MINNEAPOLIS PHILADELPHIA MIAMI DETROIT HOUSTON CLEVELAND BOSTON Graphical Summary report generated from urbmet.org contact: [email protected] City : New York Selected Area Neighborhoods Data Summary and Sources Resource Intensity: Total Per Person Unit Population 458745 - people Housing Units 302452 0.66 housing units Land Area 24.75 0.00005 km 2 Pop. Density 18535 - people/km 2 Road Area 0 0 km 2 Res. Floor Area 0 0 km 2 Road Material 31521.69 31521.69 kg (x 1000) Building Material 47137.82 47137.82 kg (x 1000) Electricity 0 18144 kWh Gas 0 5317 kWh Transportation 0 39660 kWh Data Sources: Category Measure Source Census population census.gov housing census.gov Material roads census.gov buildings validated model construction survey of standards Energy electricity validated model ( e2.0) gas validated model ( e2.0) transportation validated model Notes: Based on the zoom level that you chose, the scale of the comparative analysis is neighborhoods . This area is compared to other neighborhoods in New York. measure km2 0 5000 10000 15000 20000 Housing Population kg/person 0 5000 10000 15000 20000 25000 30000 Res. Building Roads kWh/person 0 10000 20000 30000 Res. Building Transportation Category Elec. Gas VKT Density Material Intensity Energy Intensity People km2 Histogram (count) 0 500 1000 1500 2000 2500 3000 3500 0 5000 10000 15000 20000 KG/Household Histogram (count) 0 200 400 600 800 0 200 400 600 800 30000 60000 90000 Roads Res.Building kWh household Histogram (count) 0 500 1000 1500 0 500 1000 1500 20000 40000 60000 Trans. Res.Building Population Comparison Material Comparison Energy Comparison Map Area Legend 1 report generated from urbmet.org contact: [email protected] Sele Neighborhoods People km2 Histogram (count) 0 500 1000 1500 2000 2500 3000 3500 0 5000 10000 15000 20000 KG/Household Histogram (count) 0 200 400 600 800 0 200 400 600 800 30000 60000 90000 Roads Res.Building kWh household Histogram (count) 0 500 1000 1500 0 500 1000 1500 20000 40000 60000 Trans. Res.Building Population Comparison Material Comparison Energy Comparison Map Area Legend 1 sta6s6cal comparison of area analyzed and city
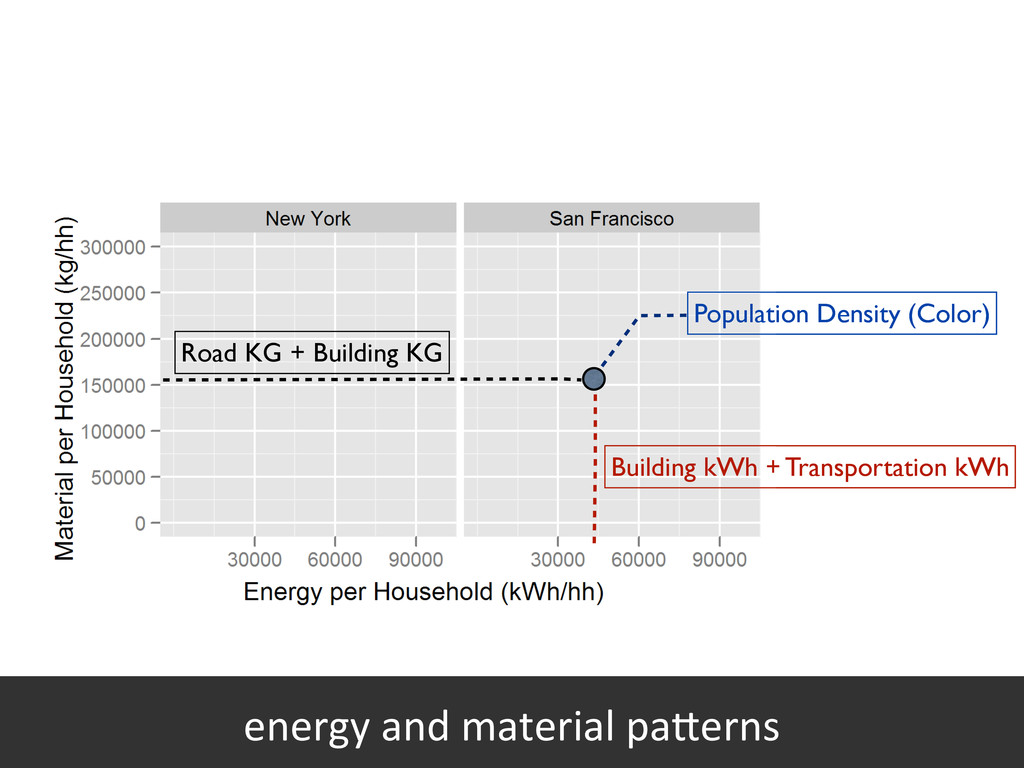
![energy and material pa?erns: NY and SF [people/km2]](https://files.speakerdeck.com/presentations/8dfcdc60116a0130a40122000a8f8767/slide_9.jpg)
![pa?erns for 40 ci6es [people/km2]](https://files.speakerdeck.com/presentations/8dfcdc60116a0130a40122000a8f8767/slide_10.jpg)