Upgrade to Pro
— share decks privately, control downloads, hide ads and more …
Speaker Deck
Features
Speaker Deck
PRO
Sign in
Sign up for free
Search
Search
Debugging and Profiling Rails App
Search
David Paluy
January 28, 2013
How-to & DIY
240
3
Share
Embed
Copy iframe code
Copy JS code
Copy link
Start on current slide
Debugging and Profiling Rails App
Overview of Debugging and Profiling tools for Rails
David Paluy
January 28, 2013
More Decks by David Paluy
See All by David Paluy
LLM Telemetry & Evals as First Class Rails Concerns - BlueRidgeRuby 2026
dpaluy
0
42
Tools to help you better understand the code
dpaluy
0
150
Ruby On Rails coding conventions, standards and best practices
dpaluy
1
1.5k
Faster on Rails
dpaluy
2
230
How to Prepare 3 min Fundraising Presentation
dpaluy
0
1k
Other Decks in How-to & DIY
See All in How-to & DIY
2026.6.27 お誕生日会で配布された透明シェルを交換する際の注意点について
mongonta0716
0
190
フィールドエンジニア at 多摩川 / Field Engineer at Tamagawa
aokiplayer
0
330
ROSAというLLM使ったROSエージェントをおもちゃに実装してみた話
takeofuture
0
240
AIツール“三種の神器”ではじめる 自動運転AIチャレンジ
covao
0
100
JAWS-UG 福岡 in 北九州 | JAWS-UG/AWSコミュニティ プログラムのご紹介
awsjcpm
1
240
おっきなガジェットの回線事情
2bo
1
220
スタックチャンはカワイイの夢を見るか?
syumme01
0
130
JAWS-UG/AWS Community Update 2026/05/25 JAWS-UG札幌 & 秋田コラボ会
awsjcpm
0
110
2025版 鯖落ちパーツで安価に機械学習用マシンを作ってみる
bobfromjapan
0
900
251011「ひとりより、みんなで!」 九州の支部で始めた、新しい連携のかたち
east_takumi
2
170
なぜJAWS-UGはこんなにも活発なのか?
awsjcpm
1
250
JAWS-UG/AWSコミュニティ JAWS-UG おおいた
awsjcpm
2
3k
Featured
See All Featured
The Illustrated Guide to Node.js - THAT Conference 2024
reverentgeek
1
410
The Invisible Side of Design
smashingmag
301
52k
A brief & incomplete history of UX Design for the World Wide Web: 1989–2019
jct
2
420
Mozcon NYC 2025: Stop Losing SEO Traffic
samtorres
1
300
Dealing with People You Can't Stand - Big Design 2015
cassininazir
367
27k
Why Your Marketing Sucks and What You Can Do About It - Sophie Logan
marketingsoph
0
220
How to optimise 3,500 product descriptions for ecommerce in one day using ChatGPT
katarinadahlin
PRO
1
3.7k
Designing Experiences People Love
moore
143
24k
Build your cross-platform service in a week with App Engine
jlugia
234
18k
職位にかかわらず全員がリーダーシップを発揮するチーム作り / Building a team where everyone can demonstrate leadership regardless of position
madoxten
63
55k
The Art of Delivering Value - GDevCon NA Keynote
reverentgeek
16
2k
We Have a Design System, Now What?
morganepeng
55
8.2k
Transcript
Debugging and Profiling Rails App David Paluy January 2013
None
Ruby is eating RAM
Agenda • “Winter is coming!” • Garbage Collector • Debug
Tools • Profiling Tools
The Task: Send ~30,000 e-mails
Result Before
How Ruby Works? Physical RAM Process Heap Ruby Heap Ruby
Heap Ruby Object Ruby Object Ruby Object Ruby Object Ruby Object Ruby Object
New Object allocation Free List A L L O C
A T E D F R E E
New Object allocation Free List A L L O C
A T E D
New Object allocation Free List is empty A L L
O C A T E D
New Object allocation Free List is empty – Call GC
A L L O C A T E D
GC Process • GC finds non-reachable objects and adds them
to Free List • If Free List is still empty, another Heap allocated
MRI GC • “Conservative”: any bit pattern could be a
pointer (may produce false positive) • “Stop the world”: no other Ruby code can execute during GC • “Mark & Sweep”: mark all objects in use, than sweep away unmarked objects
More Objects => Longer GC => Slow
In our case – Out of Memory!
How to Debug? • gem "pry-debugger" https://github.com/nixme/pry-debugger • gem "debugger-pry"
https://github.com/pry/debugger-pry
Tools • ObjectSpace.count_objects • GC debug - Enable heap dump
support • gdb.rb (only Linux) Note: memprof works only with Ruby 1.8
ObjectSpace.count_objects
Enable heap dump support to Ruby Install custom patched version
of ruby Usage:
https://github.com/tmm1/gdb.rb Attached to existing process and examine the HEAP
Result After
Profiling Tools • Ruby Benchmark • ruby-prof • perftools.rb (Google
perftools for Ruby)
Benchmark • gem 'benchmark_suite' https://github.com/evanphx/benchmark_suite
ruby-prof gem 'ruby-prof' https://github.com/rdp/ruby-prof
ruby-prof Measurements • process time (RubyProf::PROCESS_TIME) • wall time (RubyProf::WALL_TIME)
• cpu time (RubyProf::CPU_TIME) • object allocations (RubyProf::ALLOCATIONS) • memory usage (RubyProf::MEMORY) • garbage collections runs (RubyProf::GC_RUNS) • garbage collection time (RubyProf::GC_TIME)
perftools.rb https://github.com/tmm1/perftools.rb gem 'rack-perftools_profiler', :require => 'rack/perftools_profiler'
rack-perftools_profiler usage
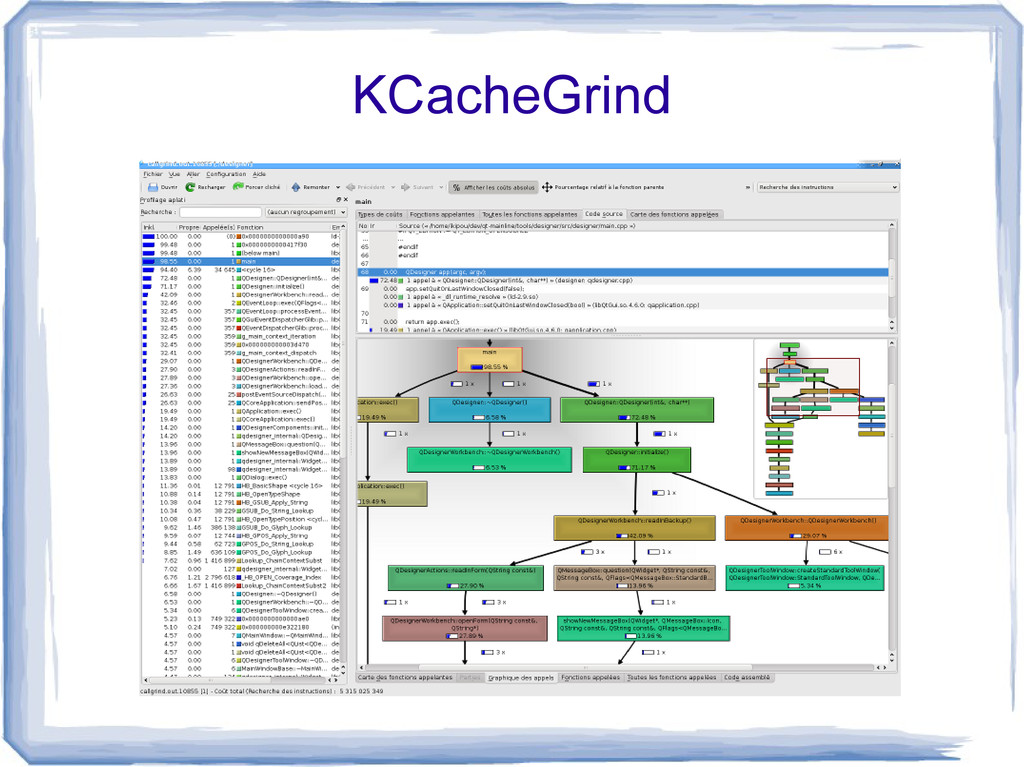
KCacheGrind
Summary • More Objects => Longer GC => Slow •
Examine your HEAP • Use Tools
Q&A http://dpaluy.github.com @dpaluy
[email protected]
http://www.linkedin.com/in/davidpaluy
![Q&A http://dpaluy.github.com @dpaluy [email protected] http://www.linkedin.com/in/davidpaluy](https://files.speakerdeck.com/presentations/247068904c18013061e712313d2a504d/slide_29.jpg)