Multilevel Data with Recursive Partitioning Daniel P. Martin University of Virginia Department of Psychology February 2, 2015 Daniel P. Martin 1 of 46 Efficiently Exploring Multilevel Data with Recursive Partitioning
Committee - Brian Nosek - Sara Rimm-Kaufman - Timo von Oertzen - Vivian Wong Implicit Social Cognition Lab - Jordan Axt - Charlie Ebersole - Becca Frazier - Anup Gampa - Kelly Hoffman - Calvin Lai - Erin Westgate Math Psy Lab - Bommae Kim - Joey Meyer - Siny Tsang Social Development Lab - Holland Banse - Michelle Ko - Micela Leis - Carol Paxton - Lia Sandilos - Julie Thomas IES Training Grant Daniel P. Martin 2 of 46 Efficiently Exploring Multilevel Data with Recursive Partitioning
Recursive Partitioning Previous Research Multilevel Issues The Proposal Daniel P. Martin 3 of 46 Efficiently Exploring Multilevel Data with Recursive Partitioning
a time statisticians only explored. Then they learned to confirm exactly - to confirm a few things exactly, each under very specific circumstances. As they emphasized exact confirmation, their techniques inevitably became less flexible. The connection of the most used techniques with past insights was weakened. Anything to which a confirmatory procedure was not explicitly attached was decried as “mere descriptive statistics”, no matter how much we had learned from it. -John Tukey, 1977 Daniel P. Martin 4 of 46 Efficiently Exploring Multilevel Data with Recursive Partitioning
“exploratory” is considered by many as less than an approach to data analysis and more a confession of guilt. -Jack McArdle, 2014 Daniel P. Martin 5 of 46 Efficiently Exploring Multilevel Data with Recursive Partitioning
After Confirmatory Tests? Try data-driven exploration with NHST Daniel P. Martin 9 of 46 Efficiently Exploring Multilevel Data with Recursive Partitioning
After Confirmatory Tests? Move on to more interesting projects Daniel P. Martin 10 of 46 Efficiently Exploring Multilevel Data with Recursive Partitioning
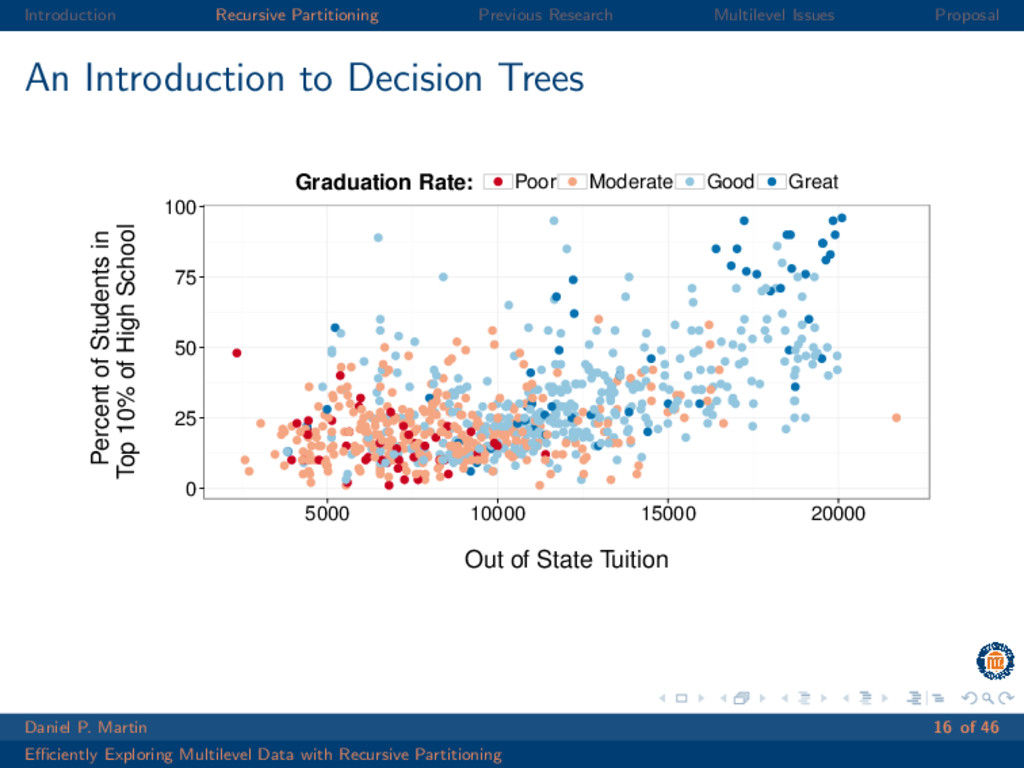
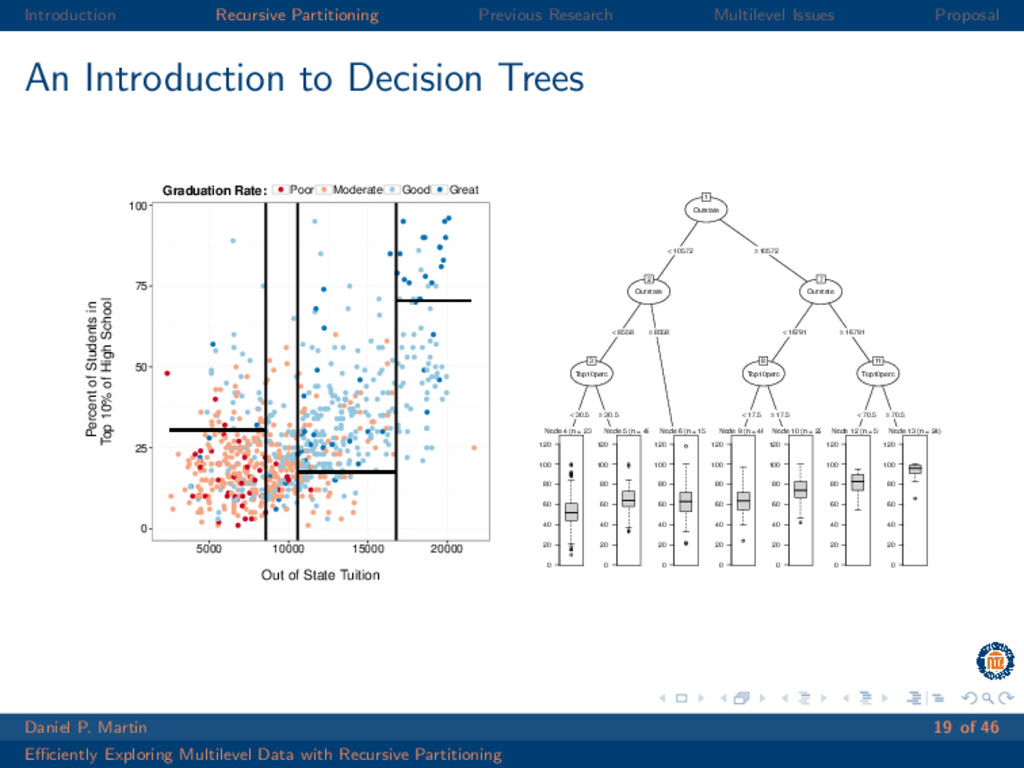
to Decision Trees 0 25 50 75 100 5000 10000 15000 20000 Out of State Tuition Percent of Students in Top 10% of High School Graduation Rate: Poor Moderate Good Great Daniel P. Martin 16 of 46 Efficiently Exploring Multilevel Data with Recursive Partitioning
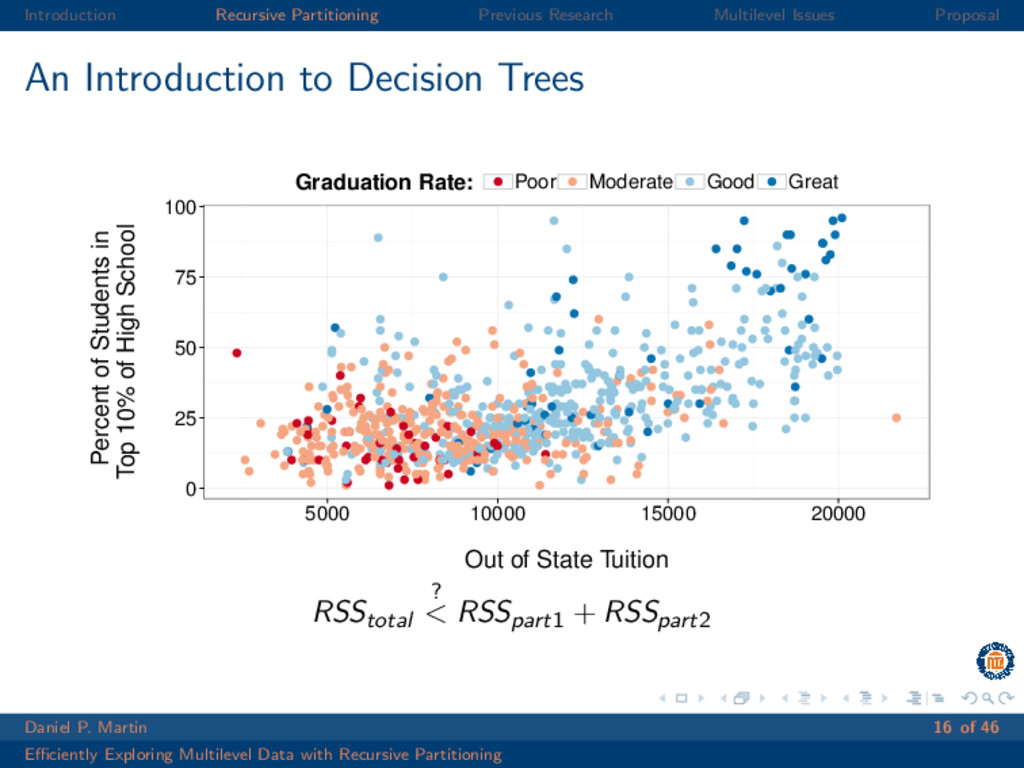
to Decision Trees 0 25 50 75 100 5000 10000 15000 20000 Out of State Tuition Percent of Students in Top 10% of High School Graduation Rate: Poor Moderate Good Great RSStotal ? < RSSpart1 + RSSpart2 Daniel P. Martin 16 of 46 Efficiently Exploring Multilevel Data with Recursive Partitioning
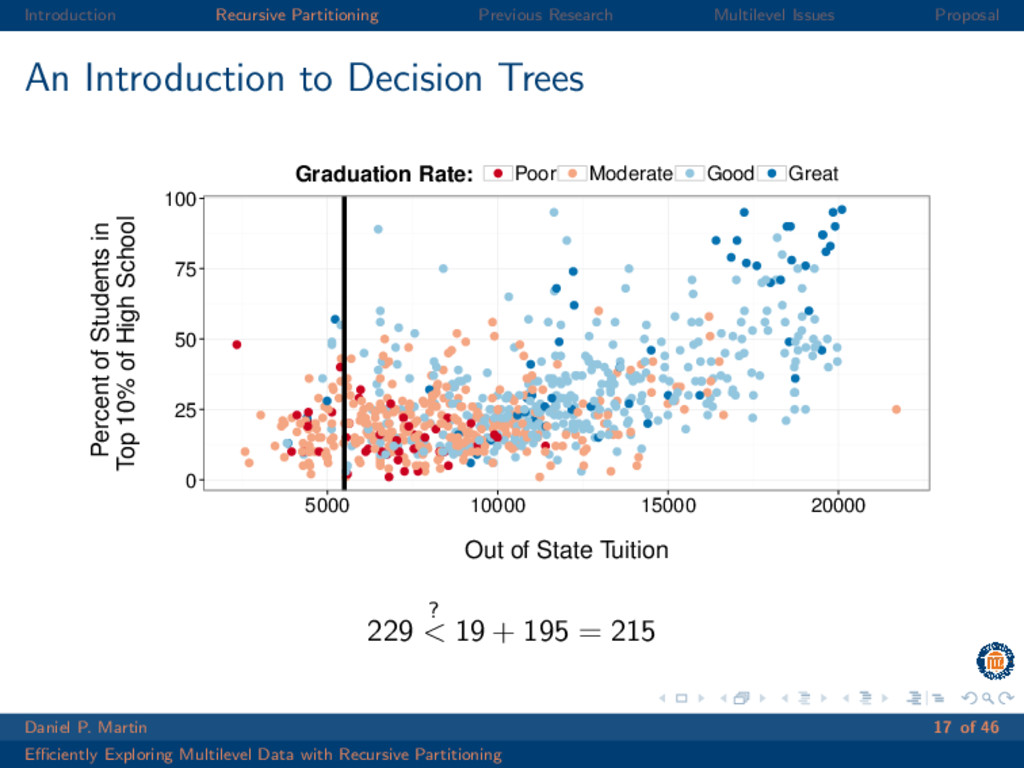
to Decision Trees 0 25 50 75 100 5000 10000 15000 20000 Out of State Tuition Percent of Students in Top 10% of High School Graduation Rate: Poor Moderate Good Great 229 ? < 19 + 195 = 215 Daniel P. Martin 17 of 46 Efficiently Exploring Multilevel Data with Recursive Partitioning
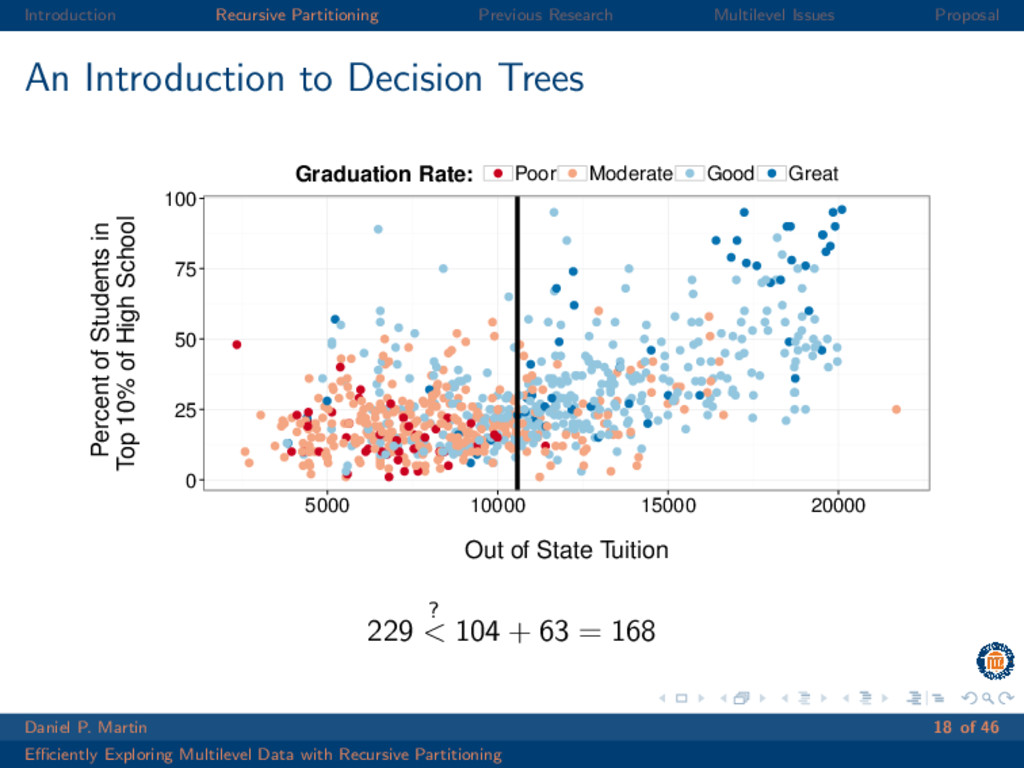
to Decision Trees 0 25 50 75 100 5000 10000 15000 20000 Out of State Tuition Percent of Students in Top 10% of High School Graduation Rate: Poor Moderate Good Great 229 ? < 104 + 63 = 168 Daniel P. Martin 18 of 46 Efficiently Exploring Multilevel Data with Recursive Partitioning
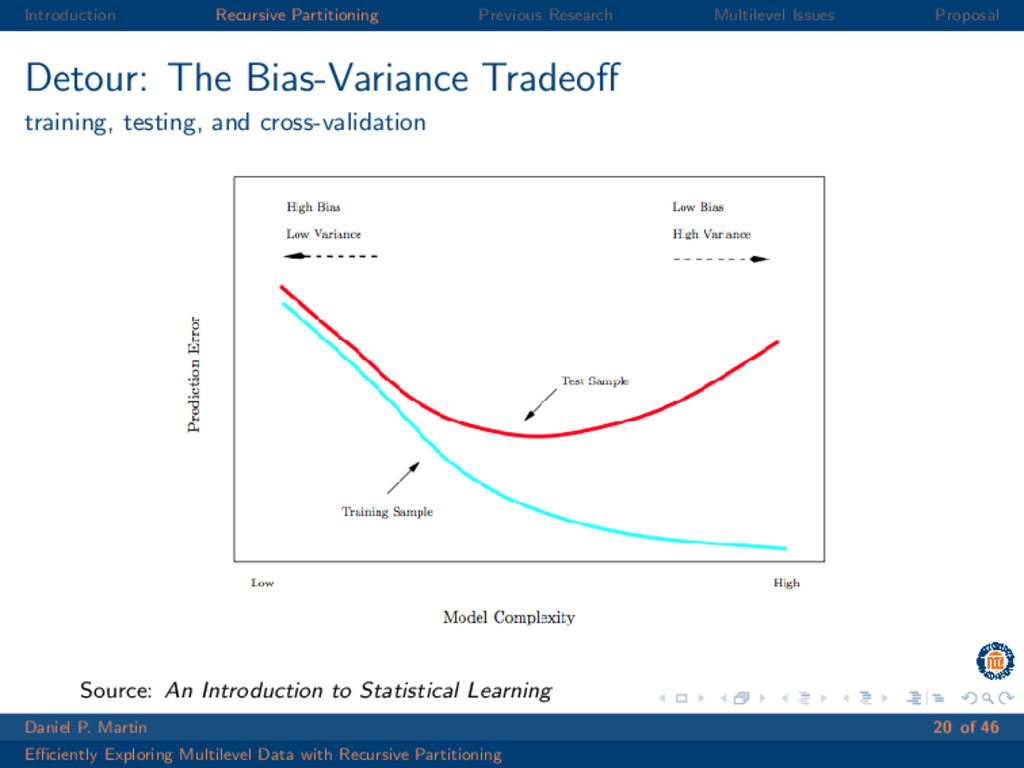
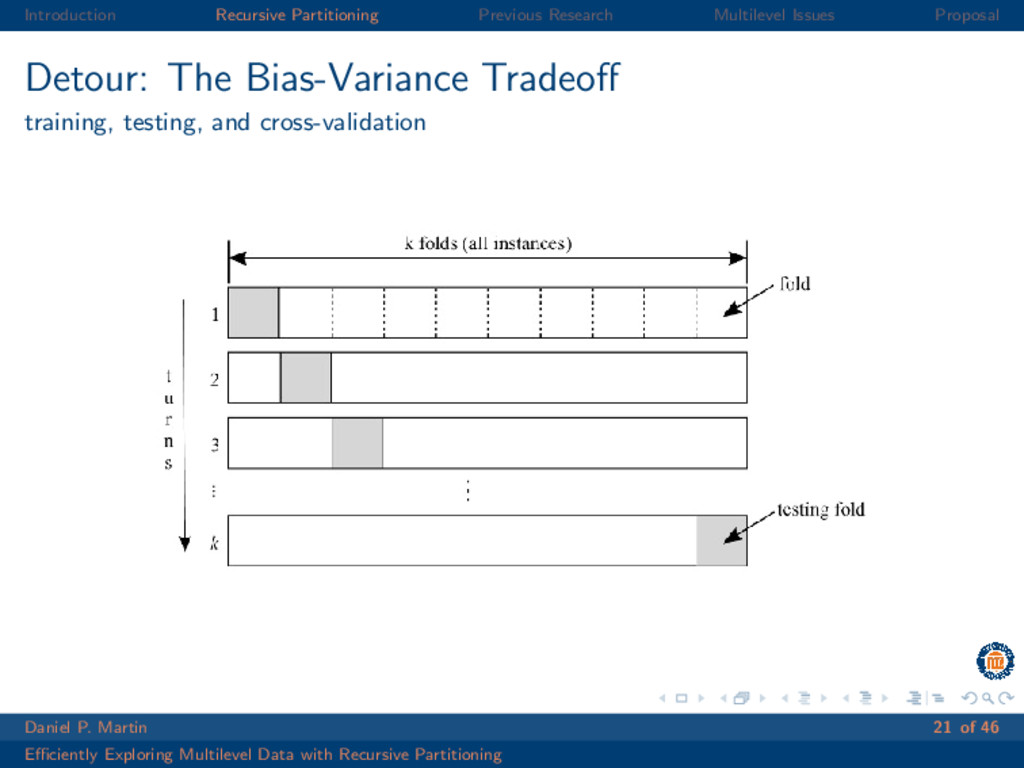
Bias-Variance Tradeoff training, testing, and cross-validation Source: An Introduction to Statistical Learning Daniel P. Martin 20 of 46 Efficiently Exploring Multilevel Data with Recursive Partitioning
Bias-Variance Tradeoff training, testing, and cross-validation Daniel P. Martin 21 of 46 Efficiently Exploring Multilevel Data with Recursive Partitioning
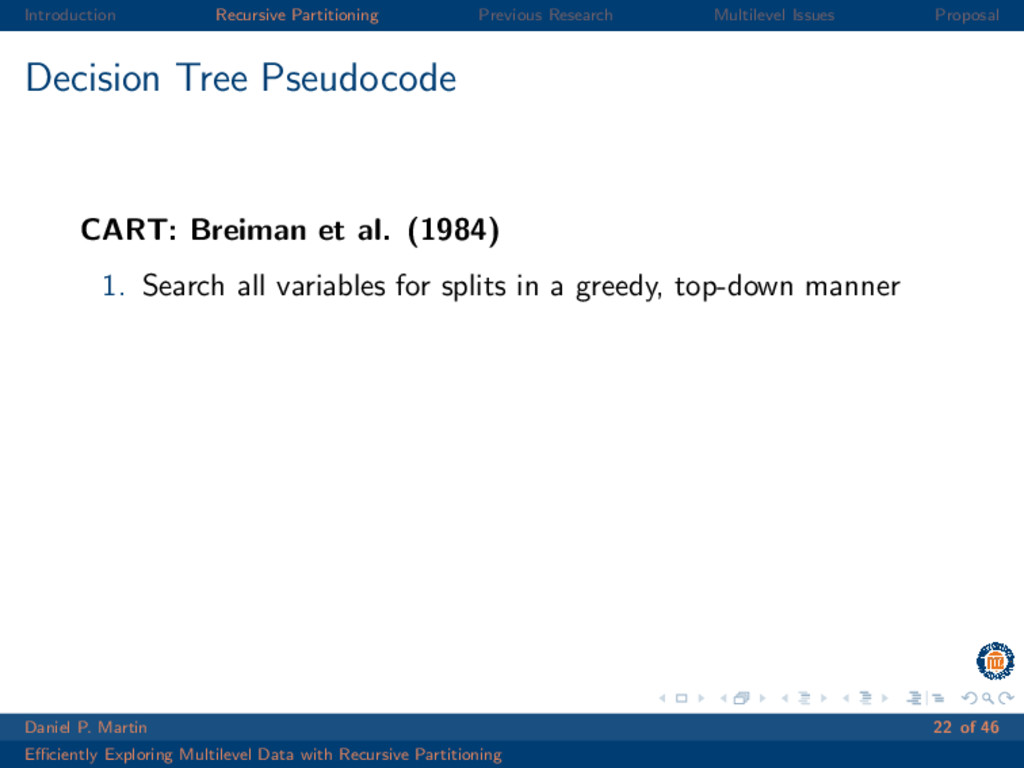
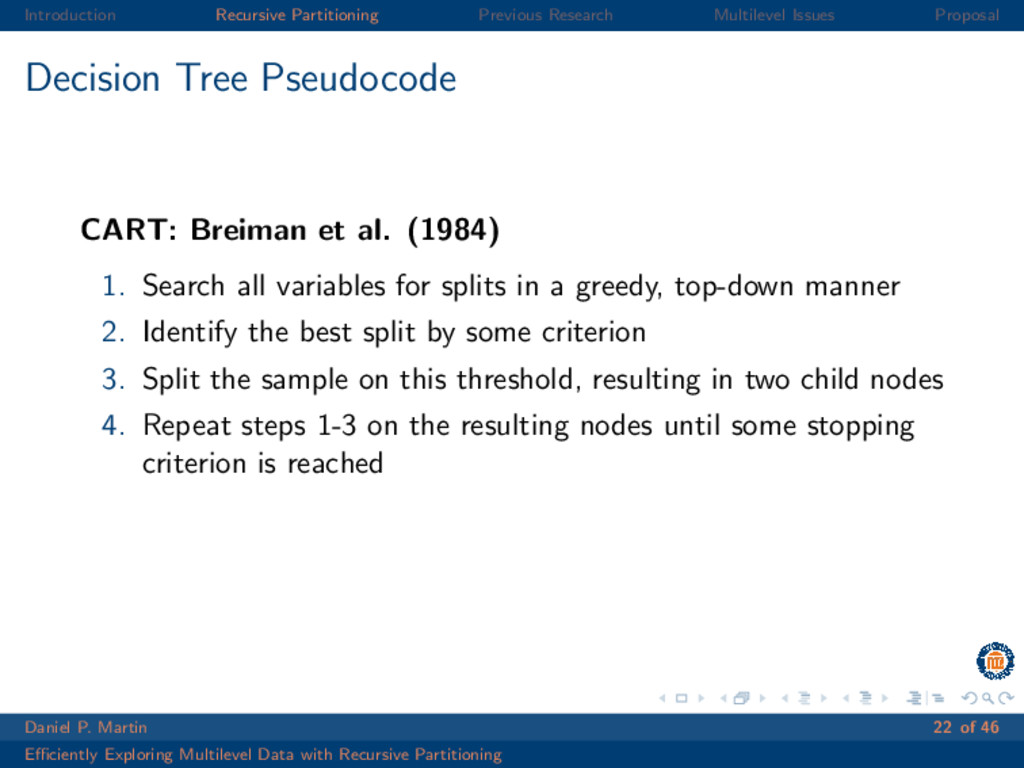
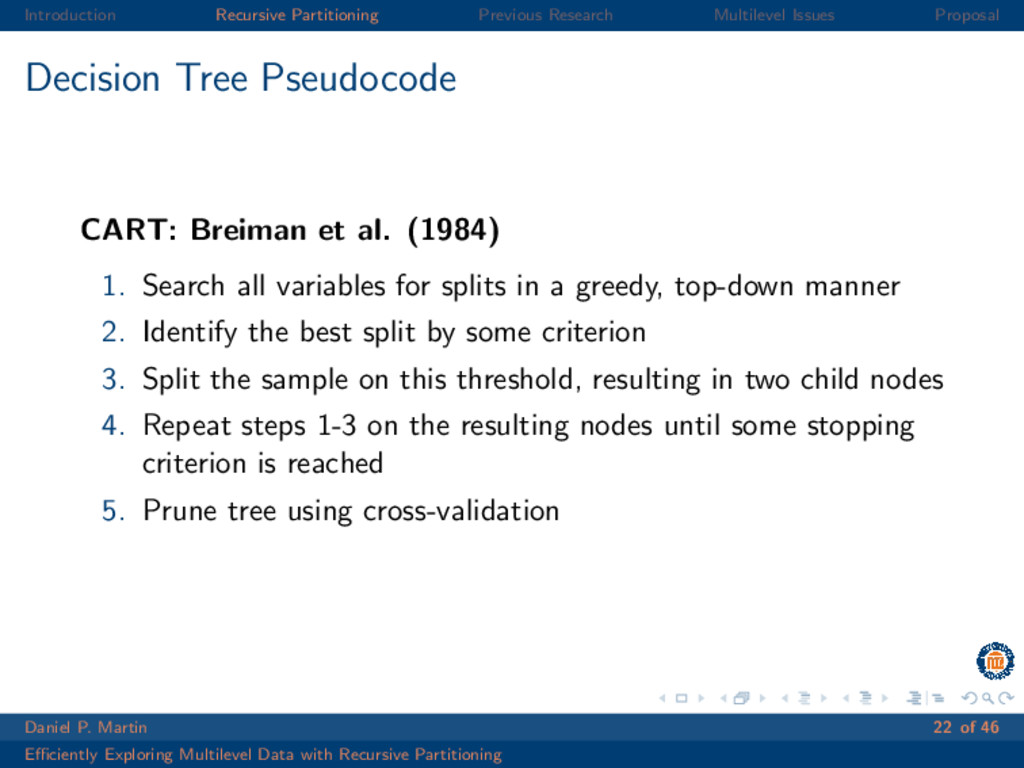
Pseudocode CART: Breiman et al. (1984) 1. Search all variables for splits in a greedy, top-down manner Daniel P. Martin 22 of 46 Efficiently Exploring Multilevel Data with Recursive Partitioning
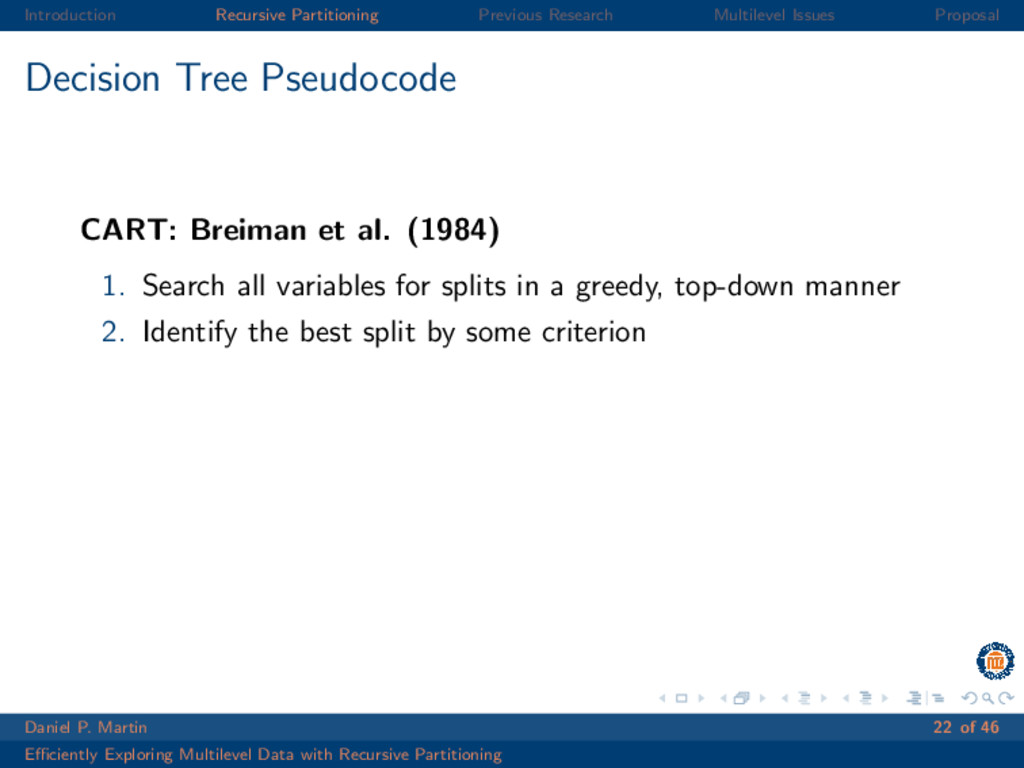
Pseudocode CART: Breiman et al. (1984) 1. Search all variables for splits in a greedy, top-down manner 2. Identify the best split by some criterion Daniel P. Martin 22 of 46 Efficiently Exploring Multilevel Data with Recursive Partitioning
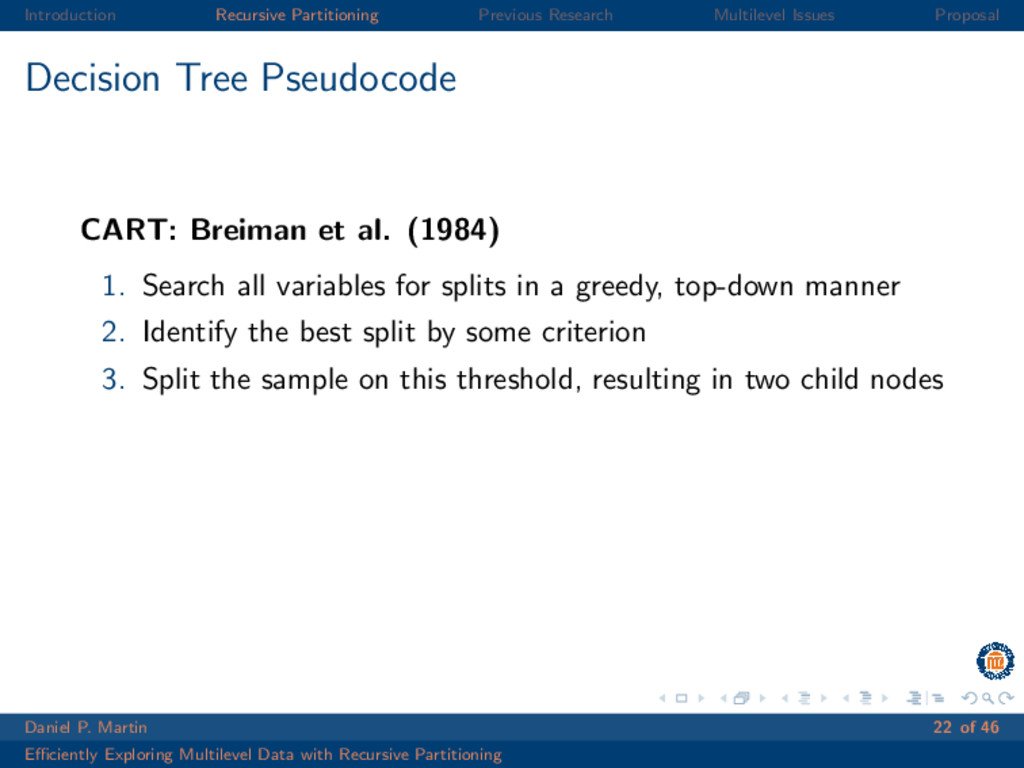
Pseudocode CART: Breiman et al. (1984) 1. Search all variables for splits in a greedy, top-down manner 2. Identify the best split by some criterion 3. Split the sample on this threshold, resulting in two child nodes Daniel P. Martin 22 of 46 Efficiently Exploring Multilevel Data with Recursive Partitioning
Pseudocode CART: Breiman et al. (1984) 1. Search all variables for splits in a greedy, top-down manner 2. Identify the best split by some criterion 3. Split the sample on this threshold, resulting in two child nodes 4. Repeat steps 1-3 on the resulting nodes until some stopping criterion is reached Daniel P. Martin 22 of 46 Efficiently Exploring Multilevel Data with Recursive Partitioning
Pseudocode CART: Breiman et al. (1984) 1. Search all variables for splits in a greedy, top-down manner 2. Identify the best split by some criterion 3. Split the sample on this threshold, resulting in two child nodes 4. Repeat steps 1-3 on the resulting nodes until some stopping criterion is reached 5. Prune tree using cross-validation Daniel P. Martin 22 of 46 Efficiently Exploring Multilevel Data with Recursive Partitioning
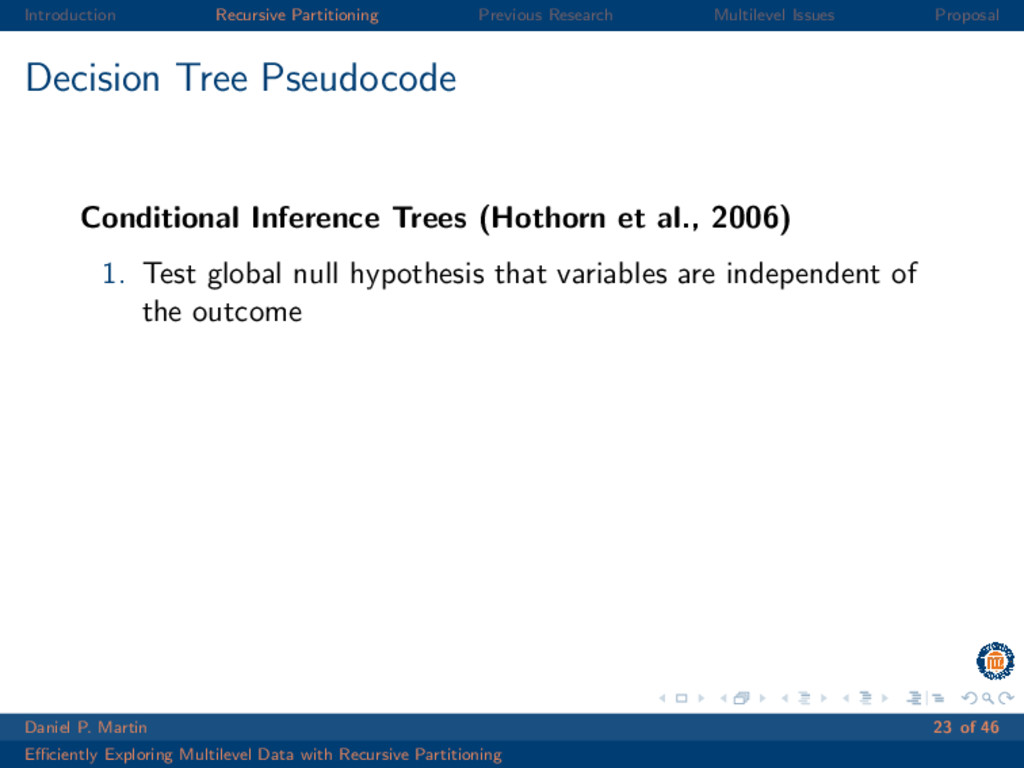
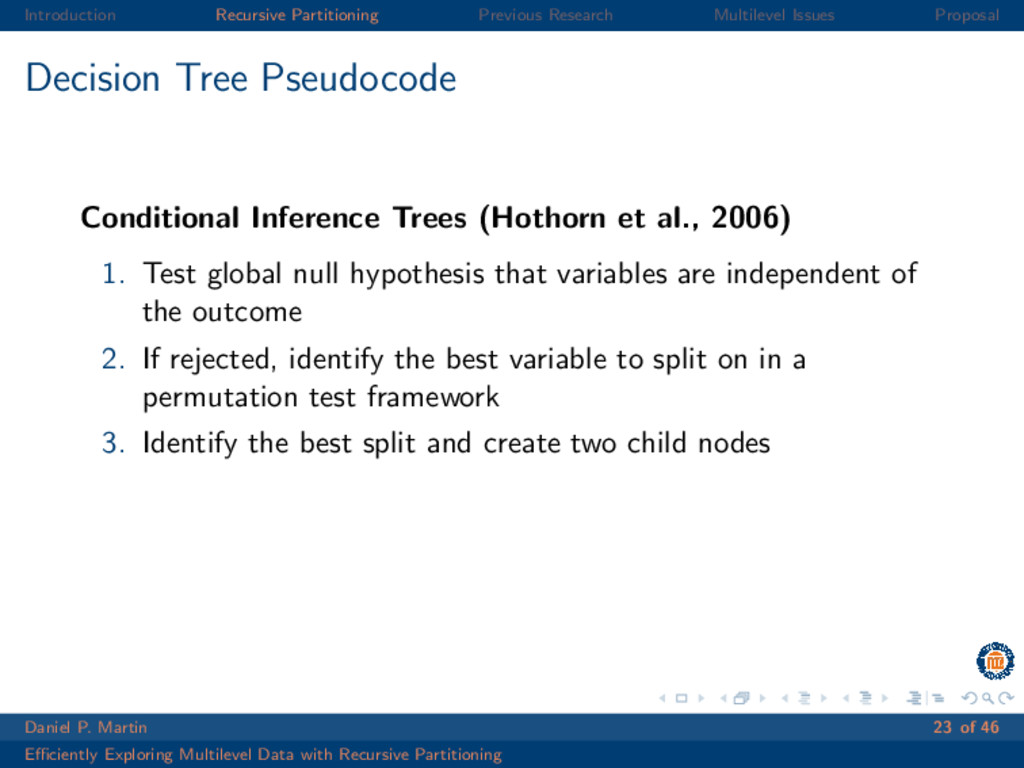
Pseudocode Conditional Inference Trees (Hothorn et al., 2006) 1. Test global null hypothesis that variables are independent of the outcome Daniel P. Martin 23 of 46 Efficiently Exploring Multilevel Data with Recursive Partitioning
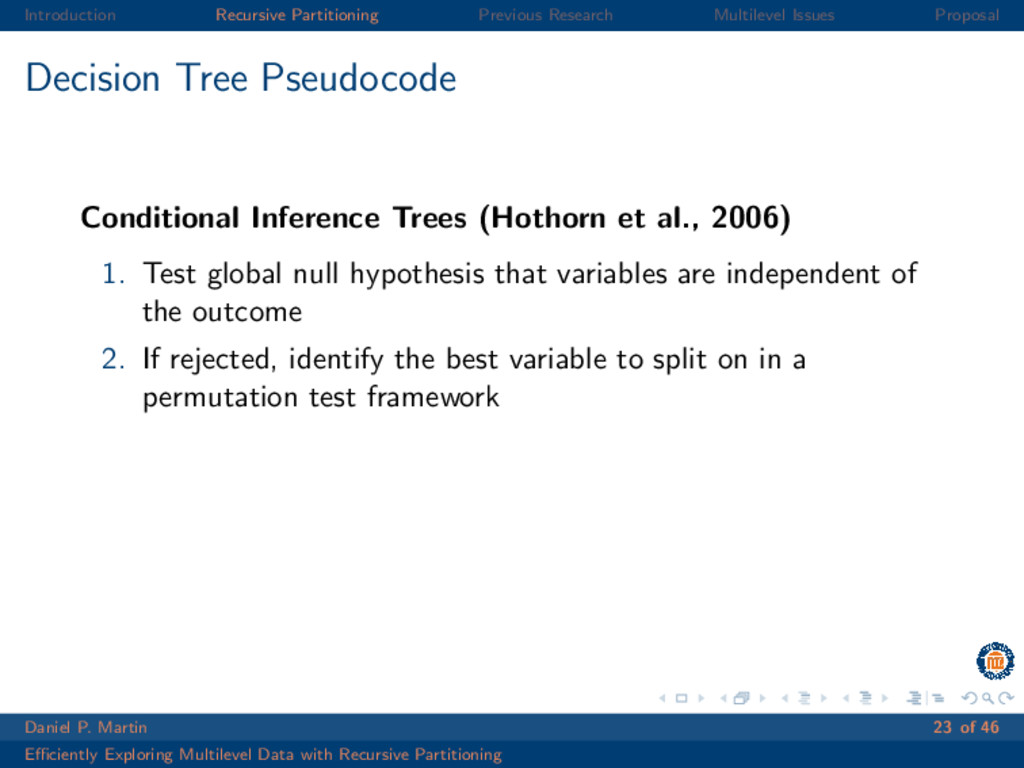
Pseudocode Conditional Inference Trees (Hothorn et al., 2006) 1. Test global null hypothesis that variables are independent of the outcome 2. If rejected, identify the best variable to split on in a permutation test framework Daniel P. Martin 23 of 46 Efficiently Exploring Multilevel Data with Recursive Partitioning
Pseudocode Conditional Inference Trees (Hothorn et al., 2006) 1. Test global null hypothesis that variables are independent of the outcome 2. If rejected, identify the best variable to split on in a permutation test framework 3. Identify the best split and create two child nodes Daniel P. Martin 23 of 46 Efficiently Exploring Multilevel Data with Recursive Partitioning
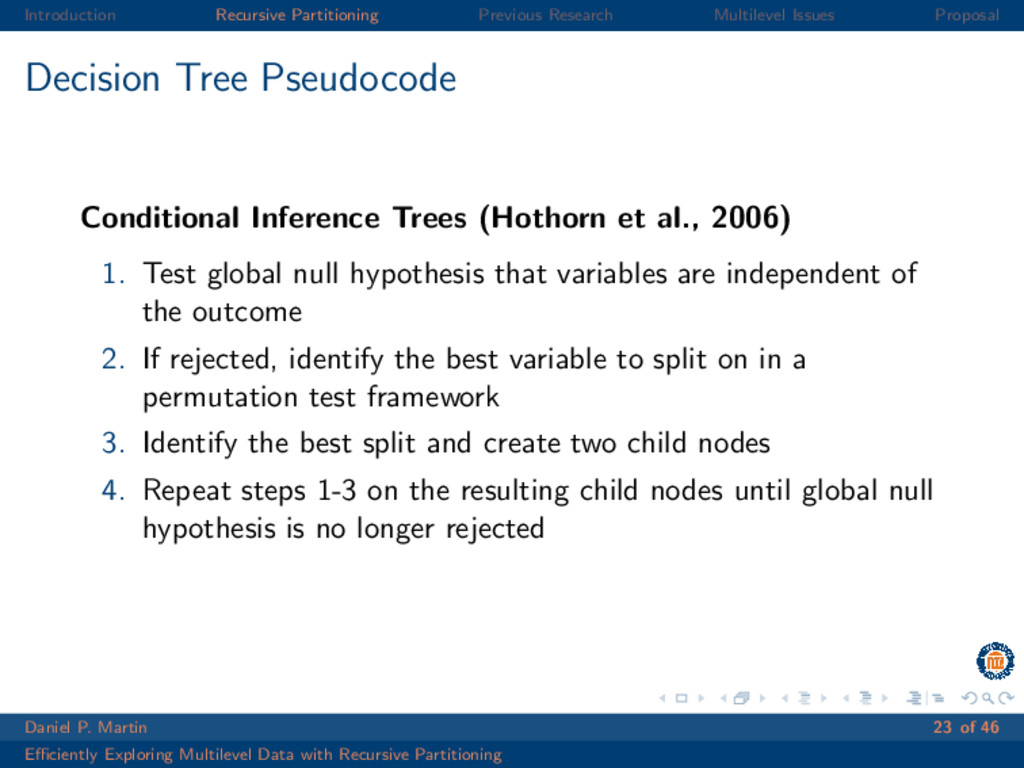
Pseudocode Conditional Inference Trees (Hothorn et al., 2006) 1. Test global null hypothesis that variables are independent of the outcome 2. If rejected, identify the best variable to split on in a permutation test framework 3. Identify the best split and create two child nodes 4. Repeat steps 1-3 on the resulting child nodes until global null hypothesis is no longer rejected Daniel P. Martin 23 of 46 Efficiently Exploring Multilevel Data with Recursive Partitioning
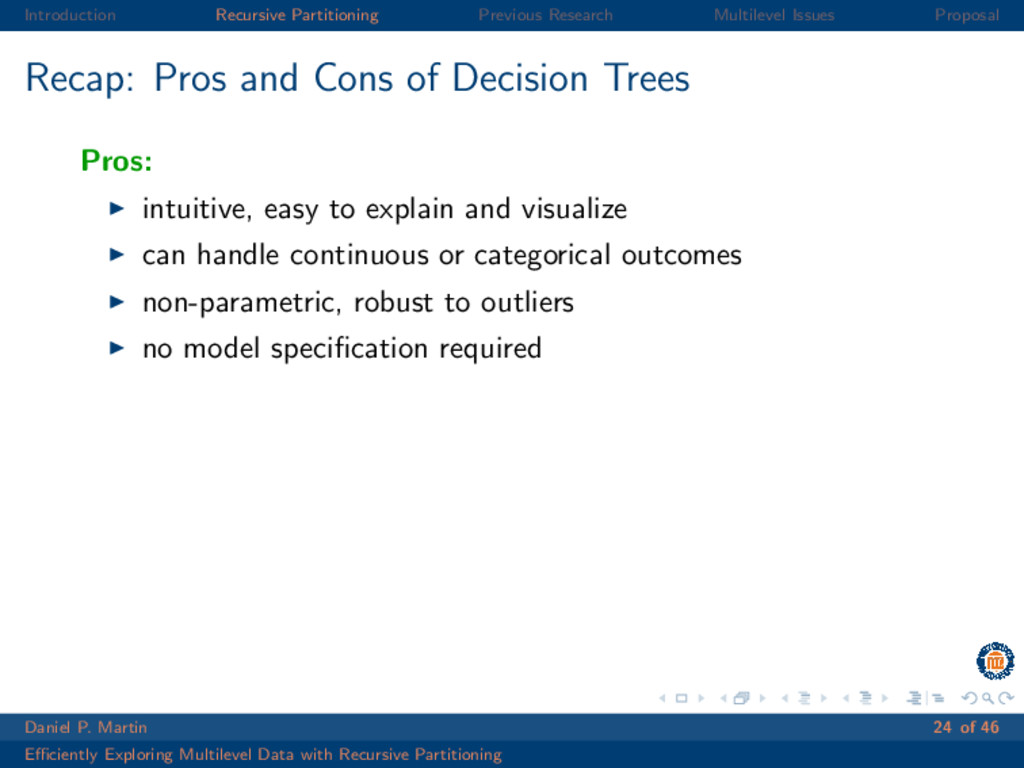
and Cons of Decision Trees Pros: intuitive, easy to explain and visualize can handle continuous or categorical outcomes non-parametric, robust to outliers no model specification required Daniel P. Martin 24 of 46 Efficiently Exploring Multilevel Data with Recursive Partitioning
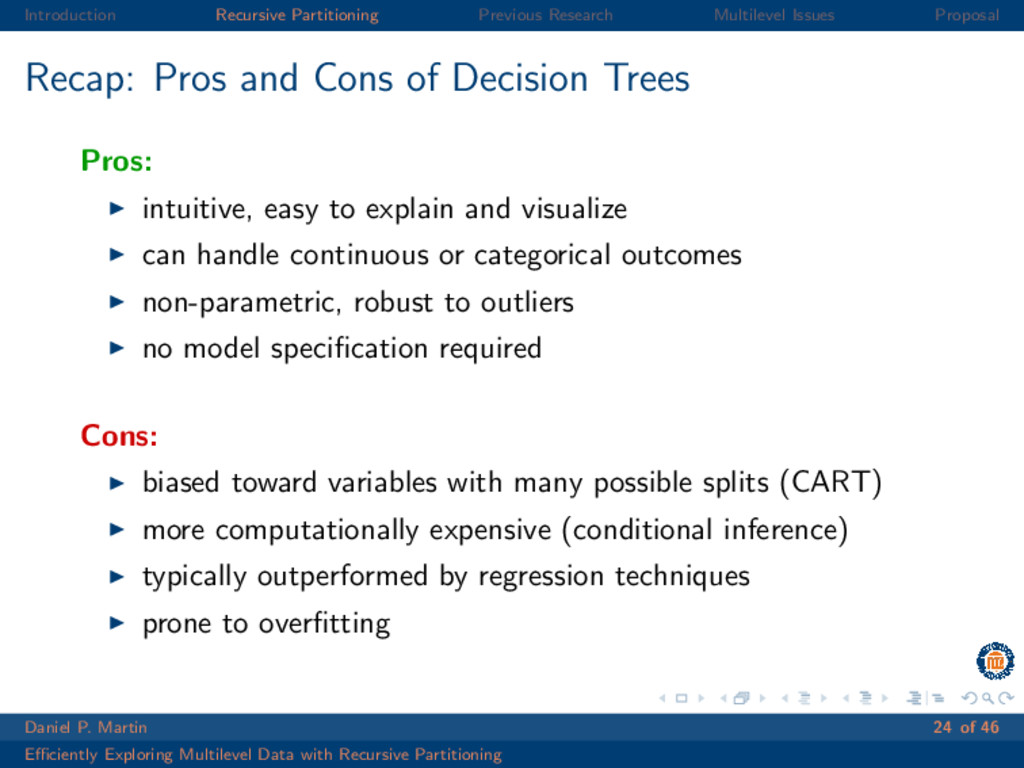
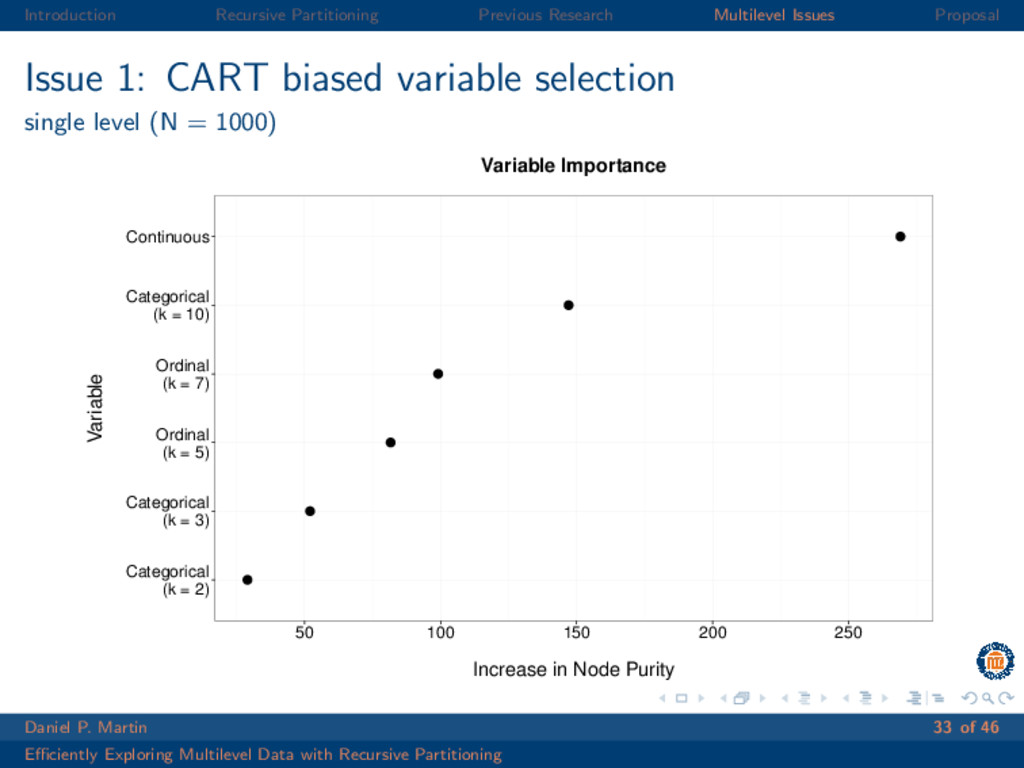
and Cons of Decision Trees Pros: intuitive, easy to explain and visualize can handle continuous or categorical outcomes non-parametric, robust to outliers no model specification required Cons: biased toward variables with many possible splits (CART) more computationally expensive (conditional inference) typically outperformed by regression techniques prone to overfitting Daniel P. Martin 24 of 46 Efficiently Exploring Multilevel Data with Recursive Partitioning
“Magic” Solution Random forests make no general assumptions regarding independence, and thus have the potential to be used for multilevel EDA with little added complexity Daniel P. Martin 28 of 46 Efficiently Exploring Multilevel Data with Recursive Partitioning
Applying recursive partitioning to multilevel data is not new RE-EM and MERT techniques can be inflexible ignore problems commonly found in multilevel data Daniel P. Martin 29 of 46 Efficiently Exploring Multilevel Data with Recursive Partitioning
Applying recursive partitioning to multilevel data is not new RE-EM and MERT techniques can be inflexible ignore problems commonly found in multilevel data Why not just use “traditional” recursive partitioning methods? Daniel P. Martin 29 of 46 Efficiently Exploring Multilevel Data with Recursive Partitioning
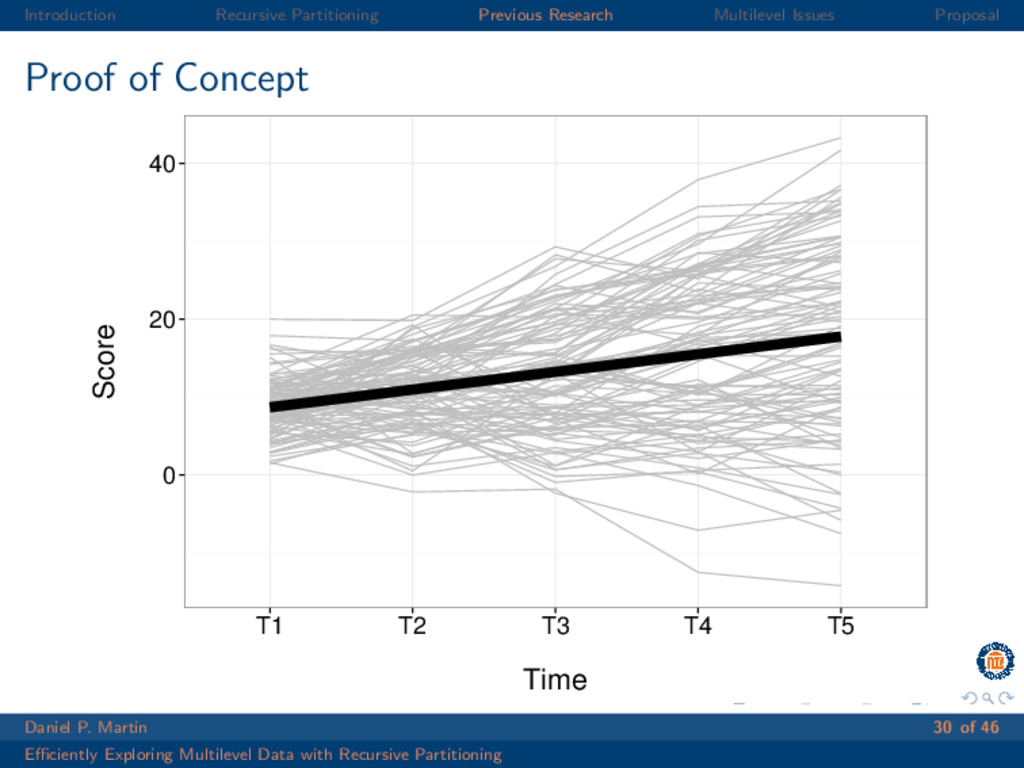
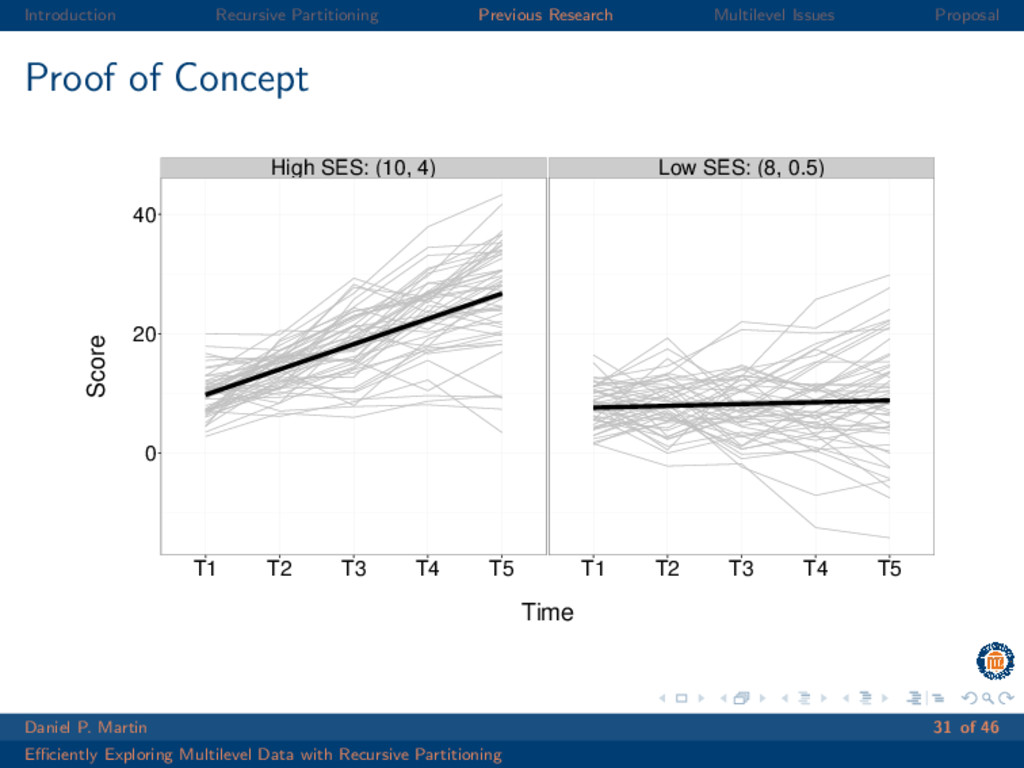
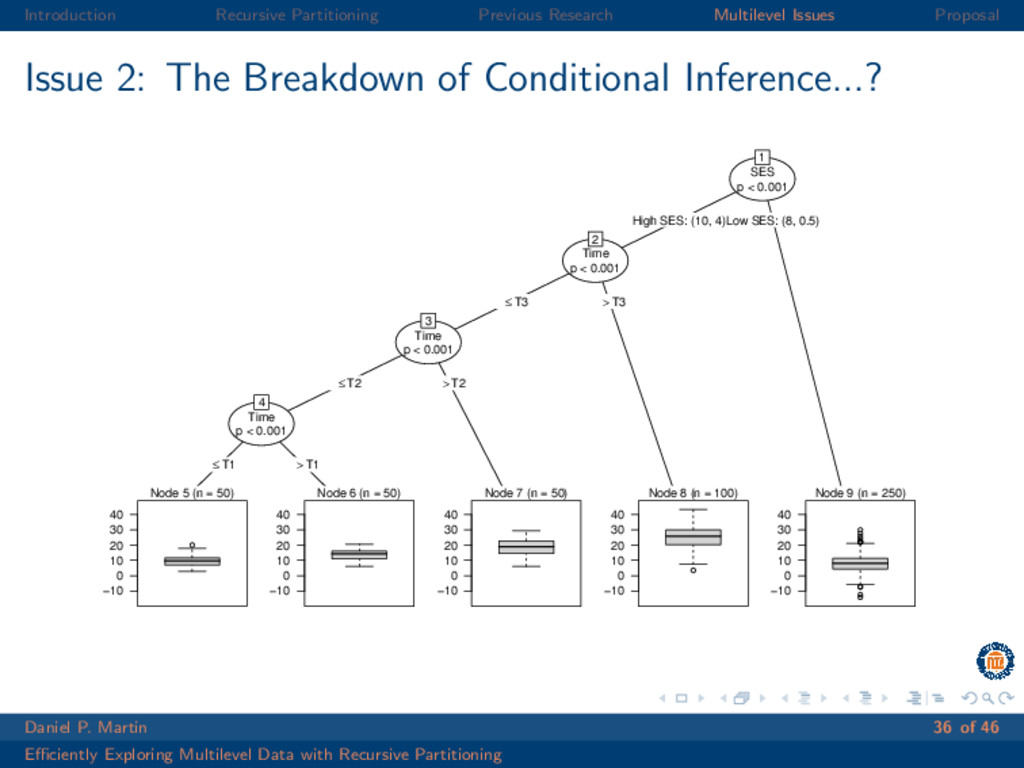
Concept High SES: (10, 4) Low SES: (8, 0.5) 0 20 40 T1 T2 T3 T4 T5 T1 T2 T3 T4 T5 Time Score Daniel P. Martin 31 of 46 Efficiently Exploring Multilevel Data with Recursive Partitioning
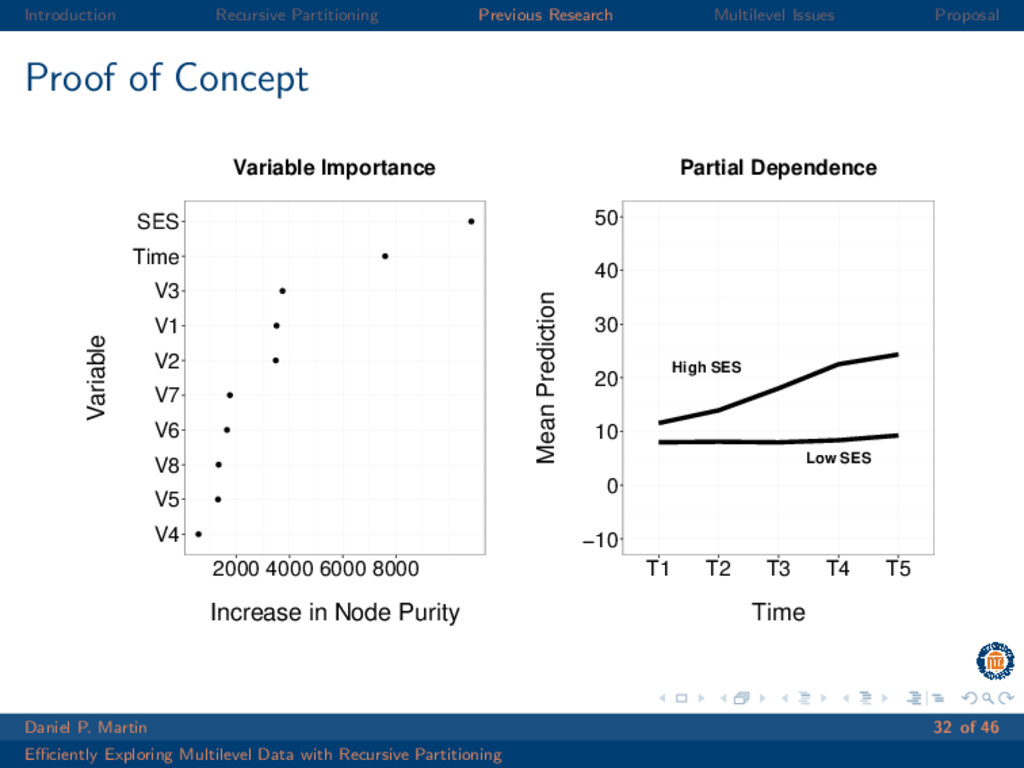
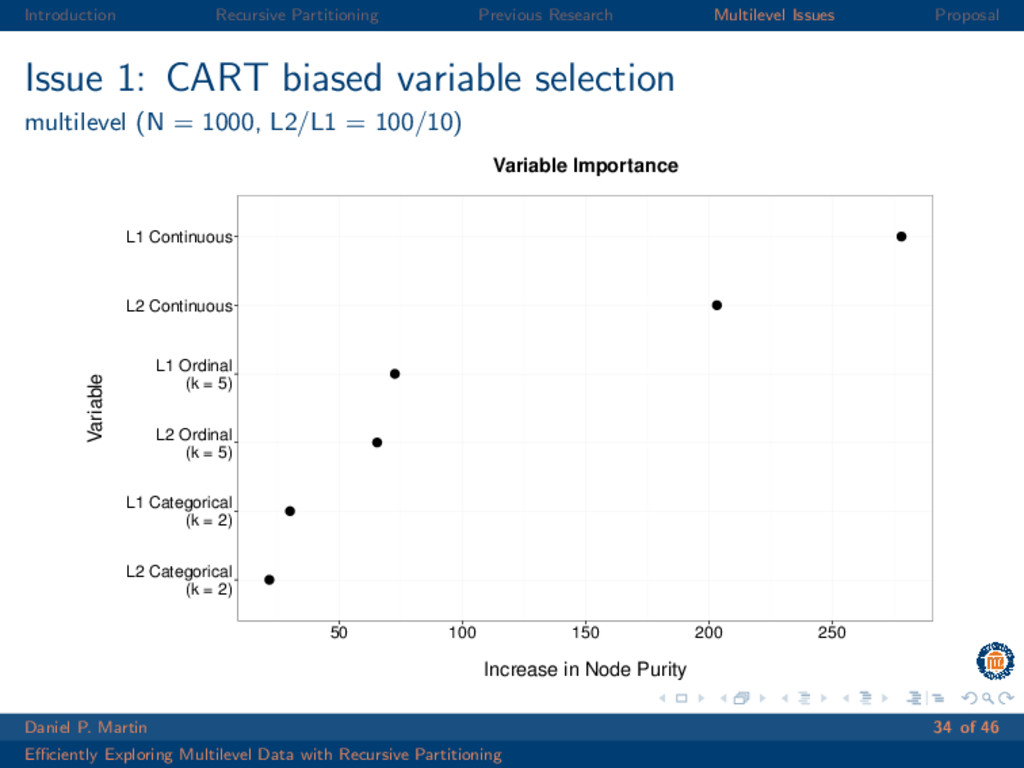
Concept V4 V5 V8 V6 V7 V2 V1 V3 Time SES 2000 4000 6000 8000 Increase in Node Purity Variable Variable Importance High SES Low SES −10 0 10 20 30 40 50 T1 T2 T3 T4 T5 Time Mean Prediction Partial Dependence Daniel P. Martin 32 of 46 Efficiently Exploring Multilevel Data with Recursive Partitioning
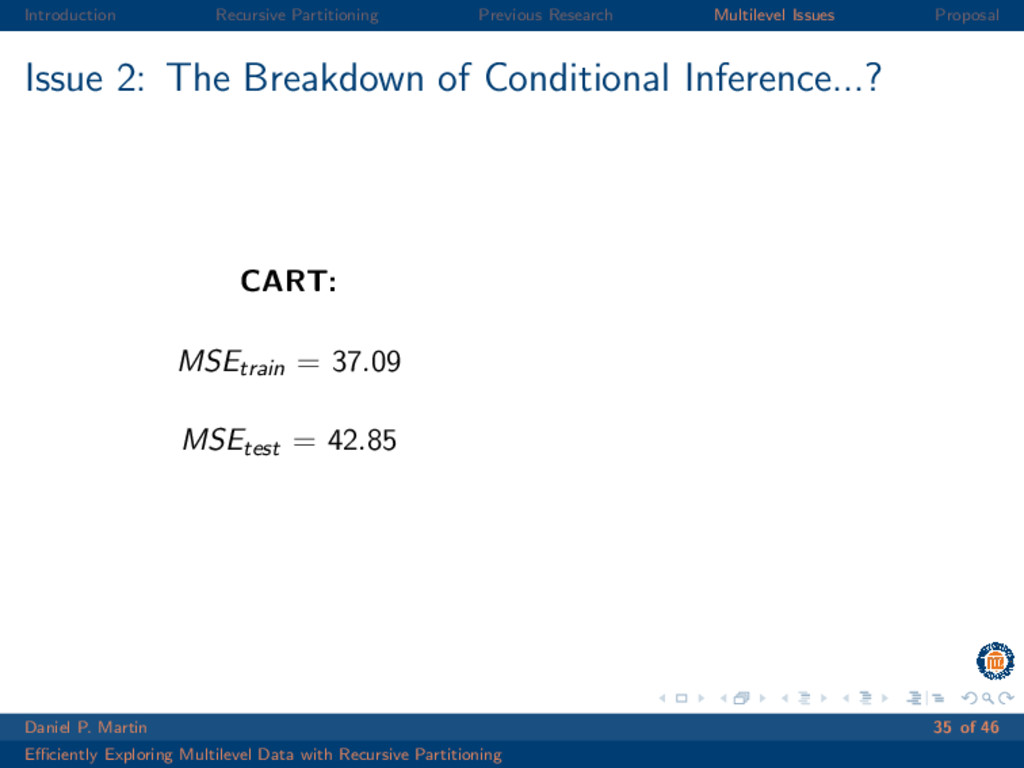
The Breakdown of Conditional Inference...? CART: MSEtrain = 37.09 MSEtest = 42.85 Daniel P. Martin 35 of 46 Efficiently Exploring Multilevel Data with Recursive Partitioning
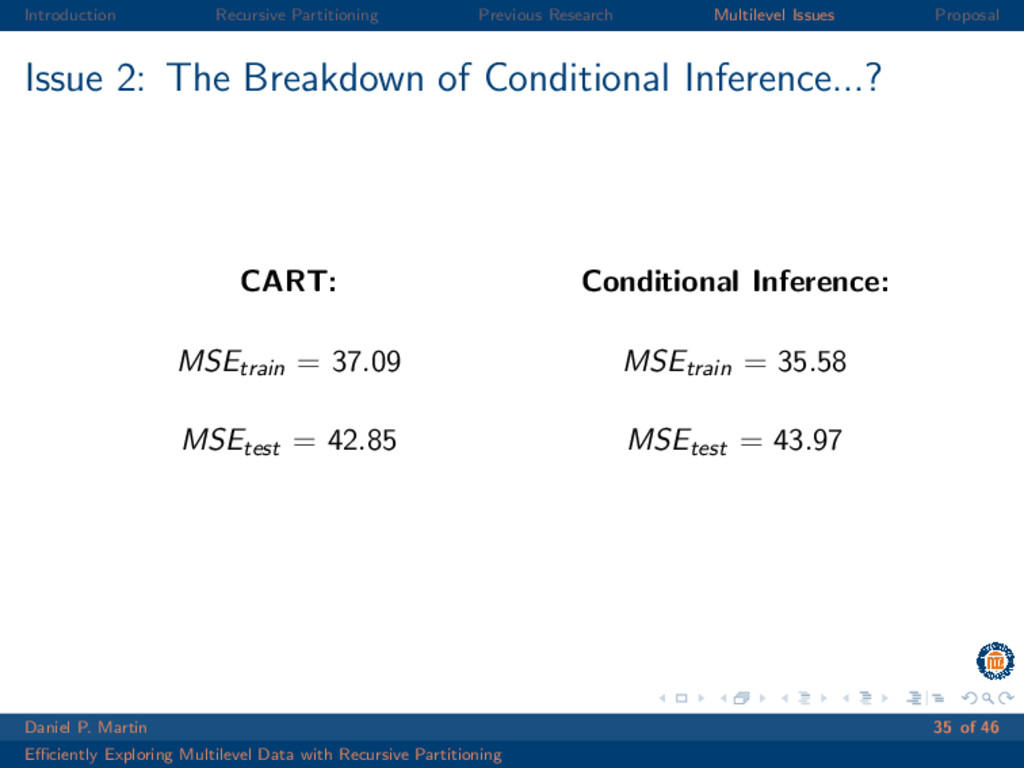
The Breakdown of Conditional Inference...? CART: MSEtrain = 37.09 MSEtest = 42.85 Conditional Inference: MSEtrain = 35.58 MSEtest = 43.97 Daniel P. Martin 35 of 46 Efficiently Exploring Multilevel Data with Recursive Partitioning
Underestimation of OOB error Pnotselected = (1 − 1 n )n limn→∞ P = 1 e ≈ 0.368 Daniel P. Martin 37 of 46 Efficiently Exploring Multilevel Data with Recursive Partitioning
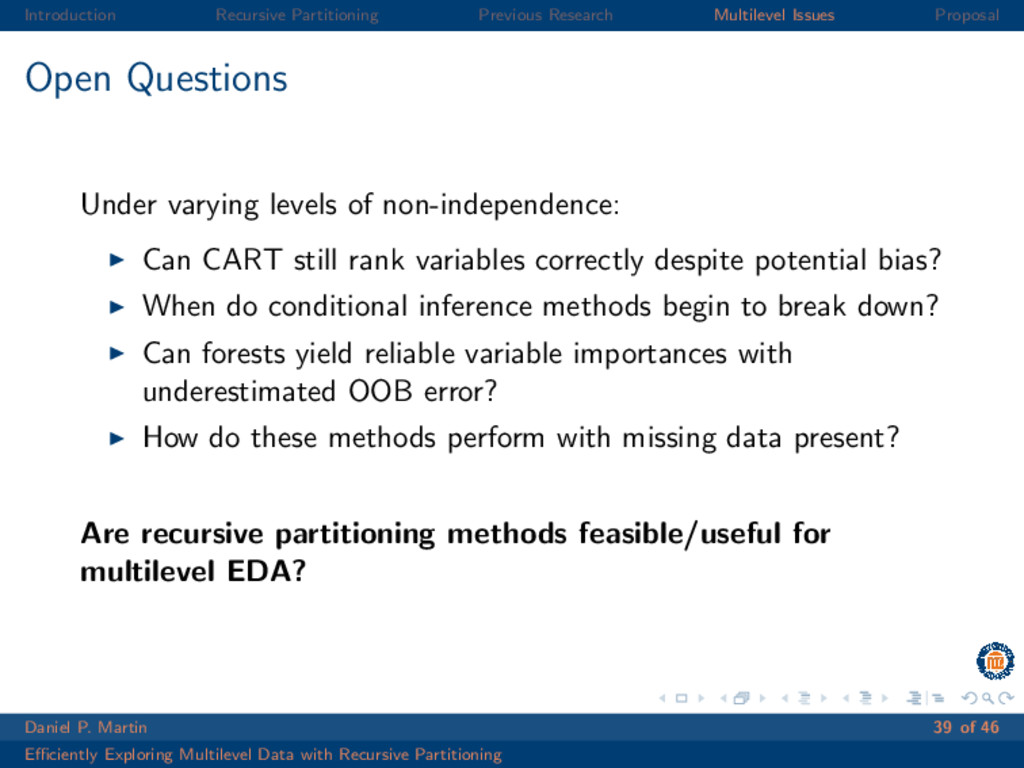
Under varying levels of non-independence: Can CART still rank variables correctly despite potential bias? Daniel P. Martin 39 of 46 Efficiently Exploring Multilevel Data with Recursive Partitioning
Under varying levels of non-independence: Can CART still rank variables correctly despite potential bias? When do conditional inference methods begin to break down? Daniel P. Martin 39 of 46 Efficiently Exploring Multilevel Data with Recursive Partitioning
Under varying levels of non-independence: Can CART still rank variables correctly despite potential bias? When do conditional inference methods begin to break down? Can forests yield reliable variable importances with underestimated OOB error? Daniel P. Martin 39 of 46 Efficiently Exploring Multilevel Data with Recursive Partitioning
Under varying levels of non-independence: Can CART still rank variables correctly despite potential bias? When do conditional inference methods begin to break down? Can forests yield reliable variable importances with underestimated OOB error? How do these methods perform with missing data present? Daniel P. Martin 39 of 46 Efficiently Exploring Multilevel Data with Recursive Partitioning
Under varying levels of non-independence: Can CART still rank variables correctly despite potential bias? When do conditional inference methods begin to break down? Can forests yield reliable variable importances with underestimated OOB error? How do these methods perform with missing data present? Are recursive partitioning methods feasible/useful for multilevel EDA? Daniel P. Martin 39 of 46 Efficiently Exploring Multilevel Data with Recursive Partitioning
Application Data Set 1: Math Achievement (Bliese, 2013) 7,185 students nested in 160 schools predictors include students per school, whether the school is public/Catholic, and student demographics large sample size, no missing data, and a continuous outcome Daniel P. Martin 41 of 46 Efficiently Exploring Multilevel Data with Recursive Partitioning
Application Data Set 2: Fidelity of Implementation (Rimm-Kaufman et al., 2014) 139 teachers in 24 schools predictors include baseline teacher self-efficacy in instruction and classroom management, and their attitudes toward their principal, schools programs, and teaching in general small sample, moderate rates of missingness, and a continuous outcome Daniel P. Martin 42 of 46 Efficiently Exploring Multilevel Data with Recursive Partitioning
Application Data Set 3: Student Achievement (Allen et al., 2011) 960 students and 68 teachers classes split across Math, English, History, and Science predictors include student-reports (motivation, engagement, etc.), teacher-reports (opinions of professional development, student learning, etc.), and teacher instruction quality larger sample size, minimal missingness, longitudinal predictors, and a categorical outcome Daniel P. Martin 43 of 46 Efficiently Exploring Multilevel Data with Recursive Partitioning
Dissemination Will conduct a small workshop followed by a group interview with prepared questions for qualitative feedback to help construct an R package and tutorial sample R package (IAT) sample R markdown tutorial Daniel P. Martin 44 of 46 Efficiently Exploring Multilevel Data with Recursive Partitioning
there will be some tinkering involved Meaningful continuous variable with non-linear relationship Meaningful categorical variable (L1 or L2) Meaningful interaction (L1 only or cross-level) Null continuous variables Null ordinal variables (k = 5) Null categorical variables (k = 2 - 5) Daniel P. Martin 1 of 10 Efficiently Exploring Multilevel Data with Recursive Partitioning
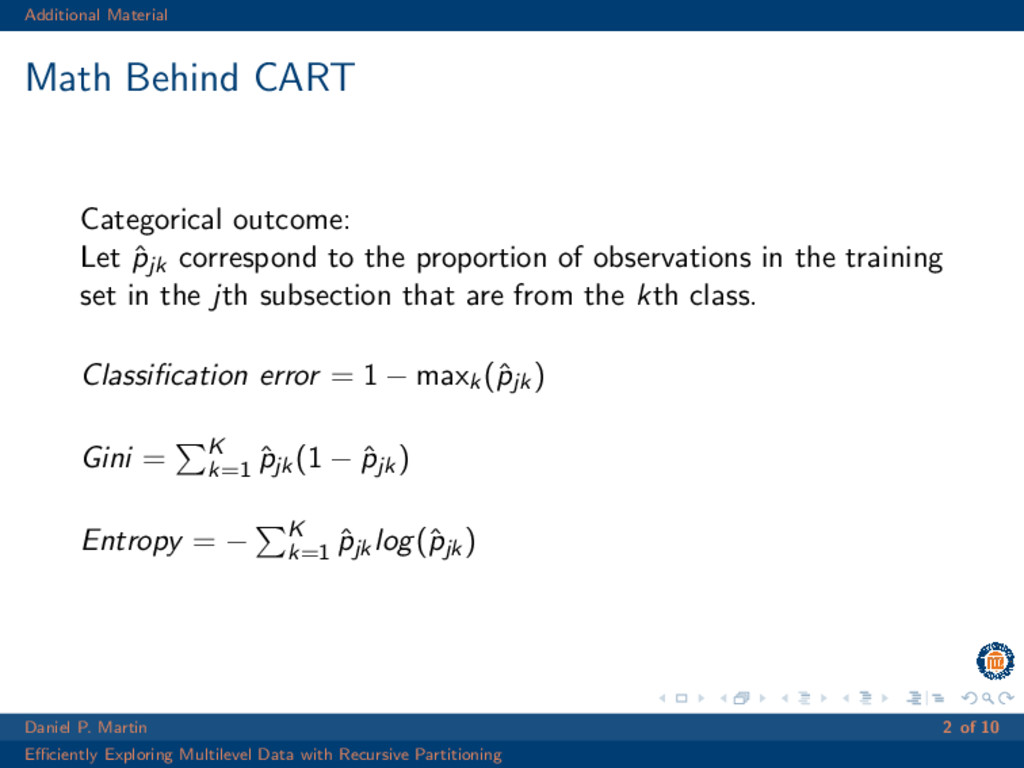
correspond to the proportion of observations in the training set in the jth subsection that are from the kth class. Classification error = 1 − maxk(ˆ pjk) Gini = K k=1 ˆ pjk(1 − ˆ pjk) Entropy = − K k=1 ˆ pjklog(ˆ pjk) Daniel P. Martin 2 of 10 Efficiently Exploring Multilevel Data with Recursive Partitioning
Test H0 = p j=1 Hj 0 , where Hj 0 : D(Y |Xj ) = D(Y ) Is tested with: Tj (Ln, w) = vec n i=1 wi gj (Xj,i )h(Yi )T ∈ Rpj q and standardized by: c(t, µ, Σ) = maxk=1,...,pq (t−µ)k √ Σkk Daniel P. Martin 3 of 10 Efficiently Exploring Multilevel Data with Recursive Partitioning
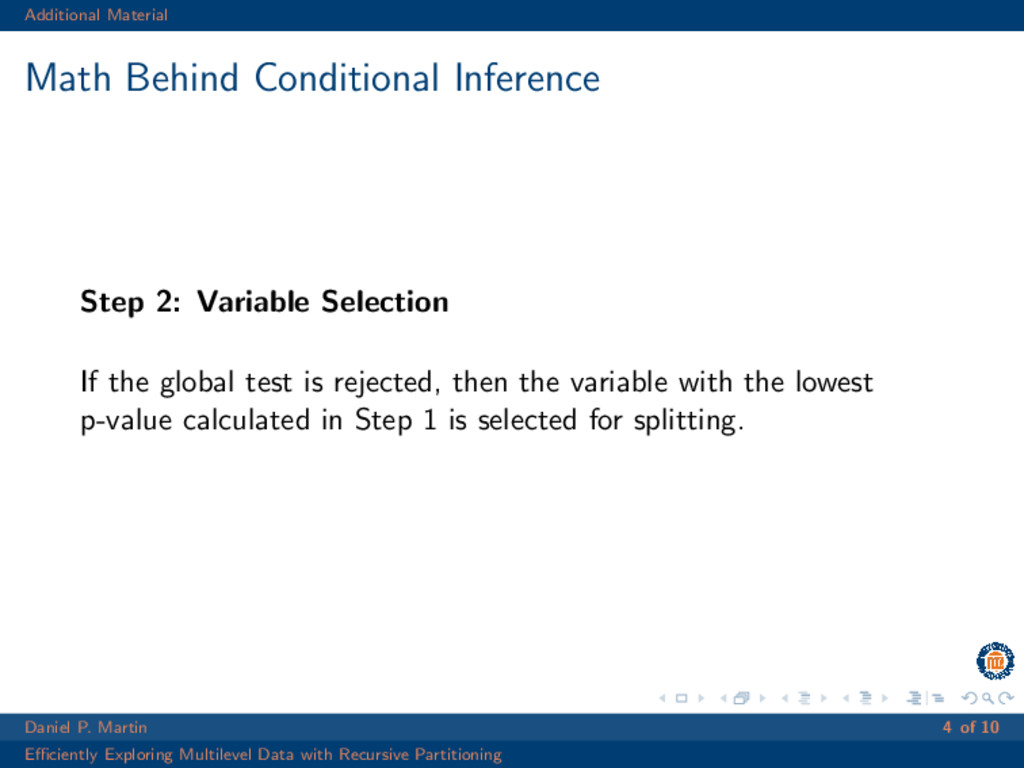
If the global test is rejected, then the variable with the lowest p-value calculated in Step 1 is selected for splitting. Daniel P. Martin 4 of 10 Efficiently Exploring Multilevel Data with Recursive Partitioning
Selection First use a modified test statistic: TA j∗ (Ln, w) = vec n i=1 wi I(Xj∗,i ∈ A)h(Yi )T ∈ Rq Then, find the split point that yields the largest standardized value: A∗ = argmax A c(tA j∗ , µA j∗ , ΣA j∗ ) Daniel P. Martin 5 of 10 Efficiently Exploring Multilevel Data with Recursive Partitioning
weights within each node are re-normalized, and these steps are repeated until the global null hypothesis is no longer rejected in each subsection. Daniel P. Martin 6 of 10 Efficiently Exploring Multilevel Data with Recursive Partitioning
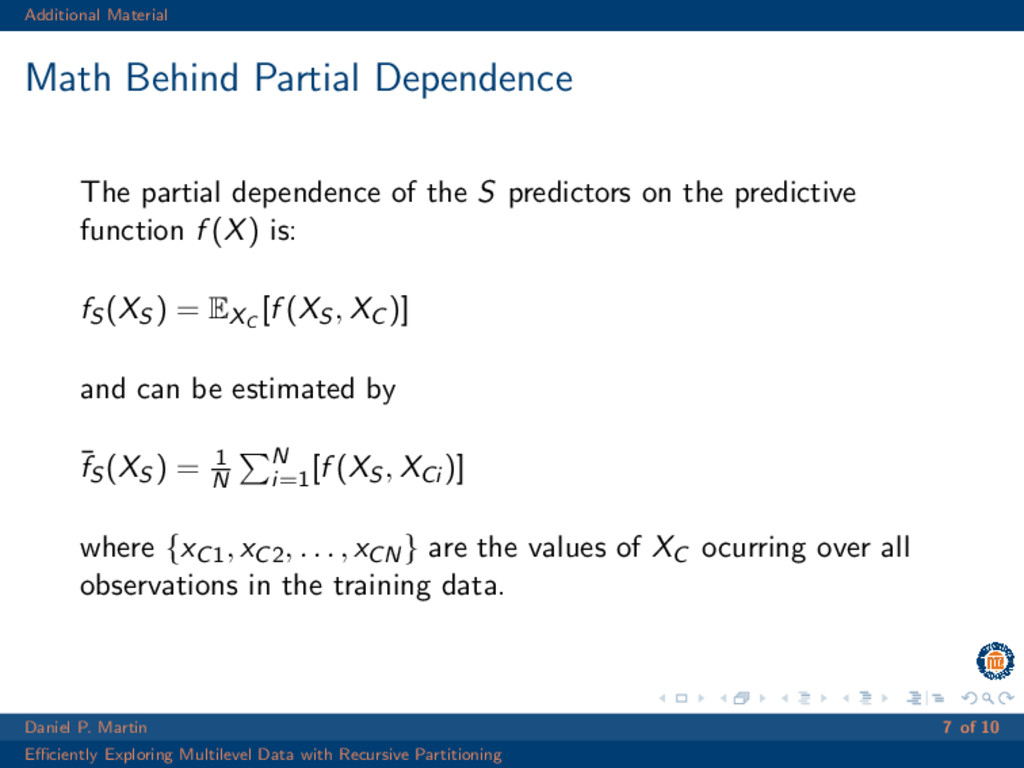
the S predictors on the predictive function f (X) is: fS (XS ) = EXC [f (XS , XC )] and can be estimated by ¯ fS (XS ) = 1 N N i=1 [f (XS , XCi )] where {xC1, xC2, . . . , xCN} are the values of XC ocurring over all observations in the training data. Daniel P. Martin 7 of 10 Efficiently Exploring Multilevel Data with Recursive Partitioning
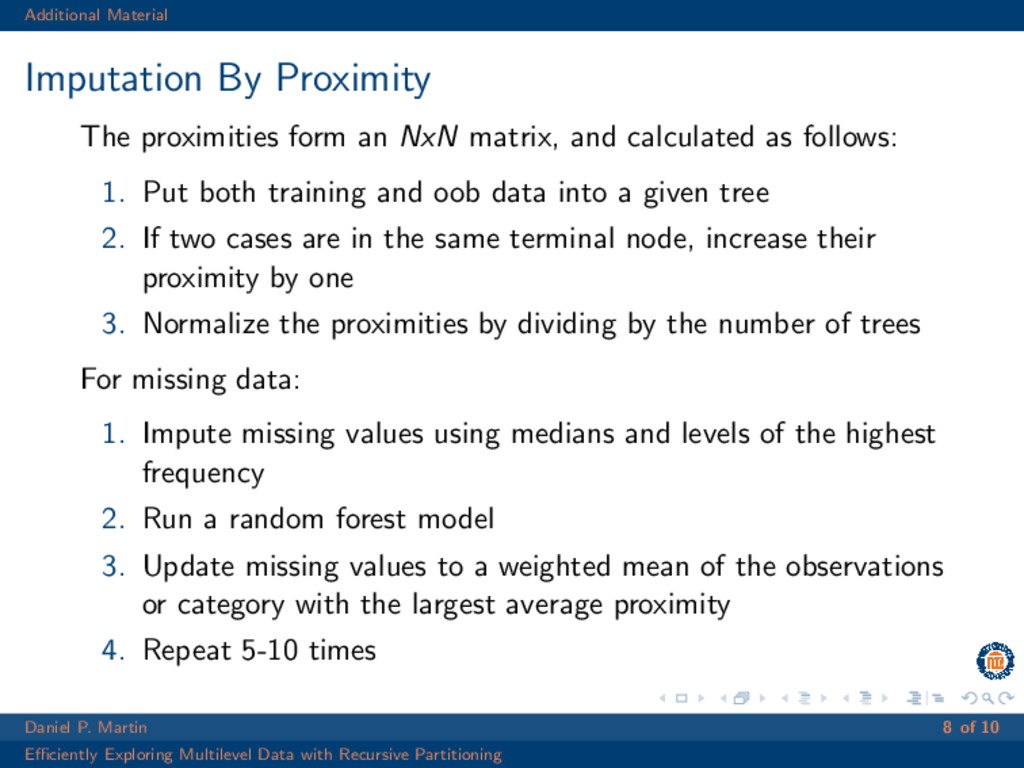
matrix, and calculated as follows: 1. Put both training and oob data into a given tree 2. If two cases are in the same terminal node, increase their proximity by one 3. Normalize the proximities by dividing by the number of trees For missing data: 1. Impute missing values using medians and levels of the highest frequency 2. Run a random forest model 3. Update missing values to a weighted mean of the observations or category with the largest average proximity 4. Repeat 5-10 times Daniel P. Martin 8 of 10 Efficiently Exploring Multilevel Data with Recursive Partitioning
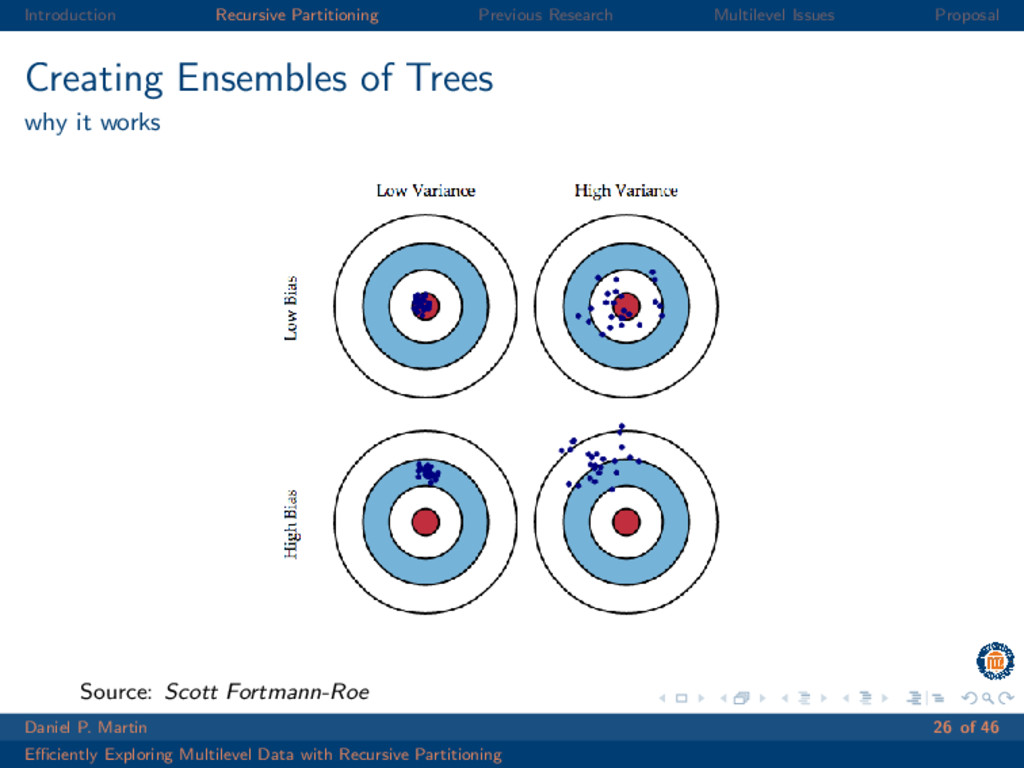
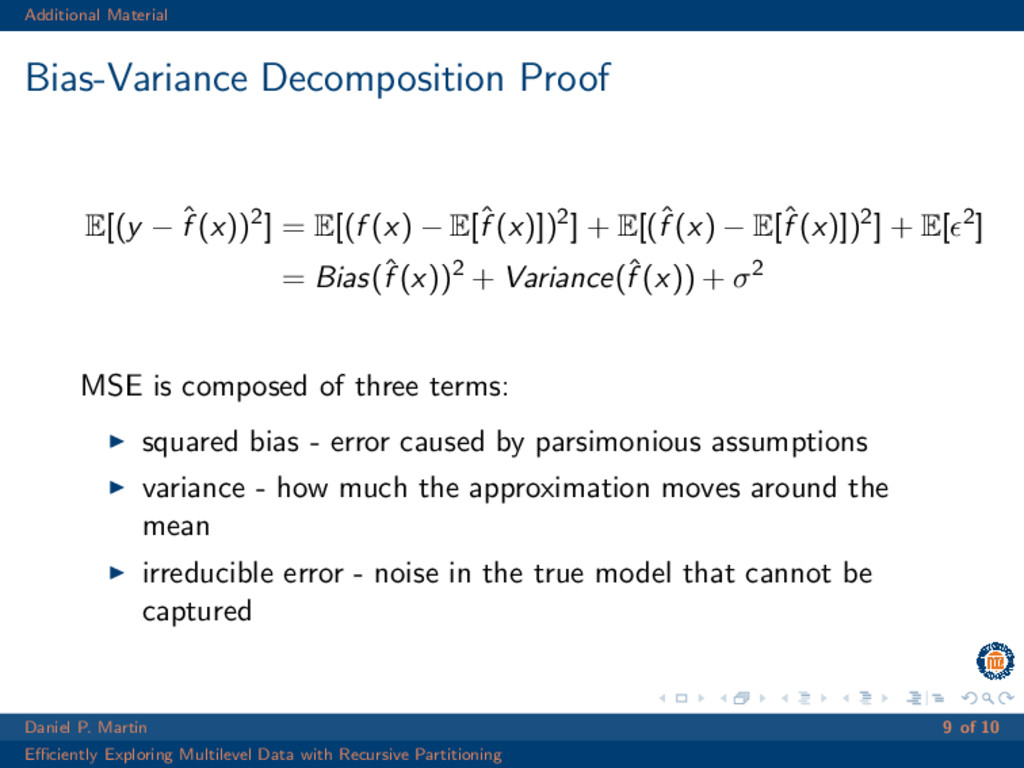
= E[(f (x) − E[ˆ f (x)])2] + E[(ˆ f (x) − E[ˆ f (x)])2] + E[ 2] = Bias(ˆ f (x))2 + Variance(ˆ f (x)) + σ2 MSE is composed of three terms: squared bias - error caused by parsimonious assumptions variance - how much the approximation moves around the mean irreducible error - noise in the true model that cannot be captured Daniel P. Martin 9 of 10 Efficiently Exploring Multilevel Data with Recursive Partitioning
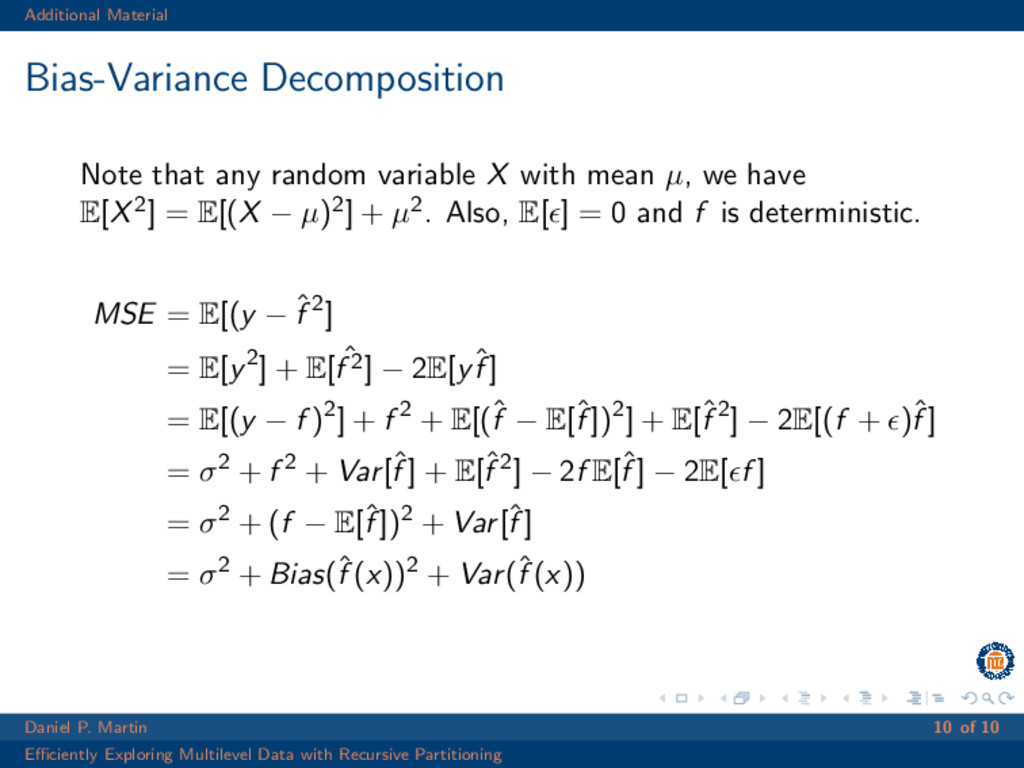
with mean µ, we have E[X2] = E[(X − µ)2] + µ2. Also, E[ ] = 0 and f is deterministic. MSE = E[(y − ˆ f 2] = E[y2] + E[ ˆ f 2] − 2E[yˆ f ] = E[(y − f )2] + f 2 + E[(ˆ f − E[ˆ f ])2] + E[ˆ f 2] − 2E[(f + )ˆ f ] = σ2 + f 2 + Var[ˆ f ] + E[ˆ f 2] − 2f E[ˆ f ] − 2E[ f ] = σ2 + (f − E[ˆ f ])2 + Var[ˆ f ] = σ2 + Bias(ˆ f (x))2 + Var(ˆ f (x)) Daniel P. Martin 10 of 10 Efficiently Exploring Multilevel Data with Recursive Partitioning

 Your Podcast. Everywhere. Effortlessly.


 dpmartin42
 tammyeverts
 notwaldorf
 dougneiner
 lara
 shlominoach
 konakalab
 rakko
 maggiecrowley
 marcoroth
 oripsolob
 gurzu