Upgrade to Pro — share decks privately, control downloads, hide ads and more …

More Mixtures, More Problems: Evaluating Analyt...

Avatar for Dan Dan
April 11, 2013
33

More Mixtures, More Problems: Evaluating Analytic Techniques to Identify Heterogeneity in Longitudinal Growth

Avatar for Dan

Dan

April 11, 2013

Transcript

  1. Introduction Tutorial Conditions Results Discussion More Mixtures, More Problems Evaluating

    Analytic Techniques to Identify Heterogeneity in Longitudinal Growth Dan Martin University of Virginia Design and Data Analysis April 11, 2013 Dan Martin 1 of 52 More Mixtures, More Problems
  2. Introduction Tutorial Conditions Results Discussion Acknowledgements Timo von Oertzen Jeff

    Spies Jean Hu The rest of the quant area! Dan Martin 2 of 52 More Mixtures, More Problems
  3. Introduction Tutorial Conditions Results Discussion Outline Introduction Tutorial Simulation Conditions

    Results Discussion Dan Martin 3 of 52 More Mixtures, More Problems
  4. Introduction Tutorial Conditions Results Discussion Measuring Longitudinal Growth Latent growth

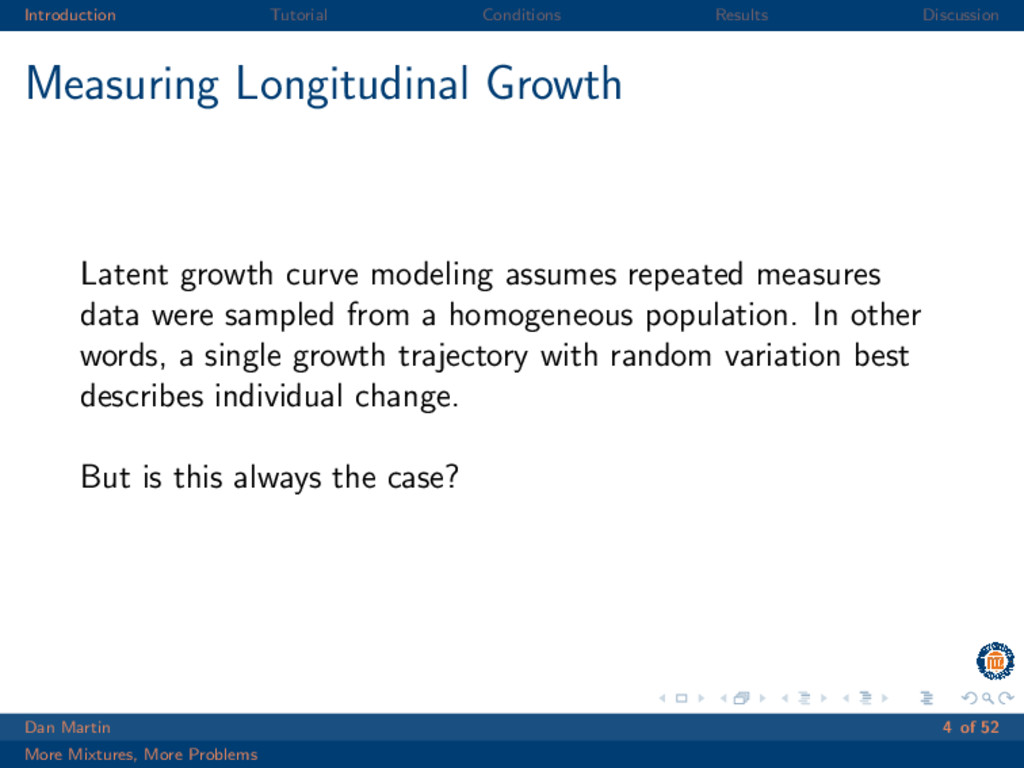
    curve modeling assumes repeated measures data were sampled from a homogeneous population. In other words, a single growth trajectory with random variation best describes individual change. But is this always the case? Dan Martin 4 of 52 More Mixtures, More Problems
  5. Introduction Tutorial Conditions Results Discussion Clustering as a Solution Clustering

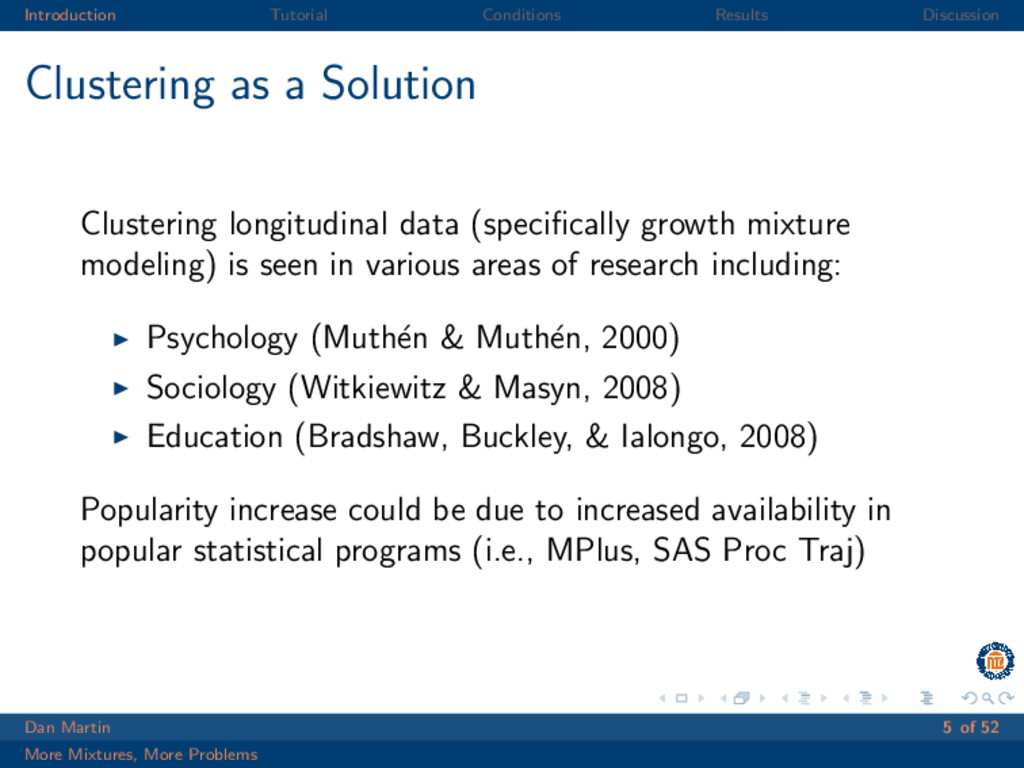
    longitudinal data (specifically growth mixture modeling) is seen in various areas of research including: Psychology (Muth´ en & Muth´ en, 2000) Sociology (Witkiewitz & Masyn, 2008) Education (Bradshaw, Buckley, & Ialongo, 2008) Popularity increase could be due to increased availability in popular statistical programs (i.e., MPlus, SAS Proc Traj) Dan Martin 5 of 52 More Mixtures, More Problems
  6. Introduction Tutorial Conditions Results Discussion How Well Do These Methods

    Work? Simulation work in this area leaves a lot to be desired All focus purely on choosing latent classes Most are evaluated as a stand-alone method Dan Martin 6 of 52 More Mixtures, More Problems
  7. Introduction Tutorial Conditions Results Discussion Posing a New Research Question

    1. K-Means clustering (MacQueen, 1967) 2. Growth Mixture Modeling (Muth´ en & Shedden, 1999) Which method performs better? Dan Martin 7 of 52 More Mixtures, More Problems
  8. Introduction Tutorial Conditions Results Discussion Posing a New Research Question

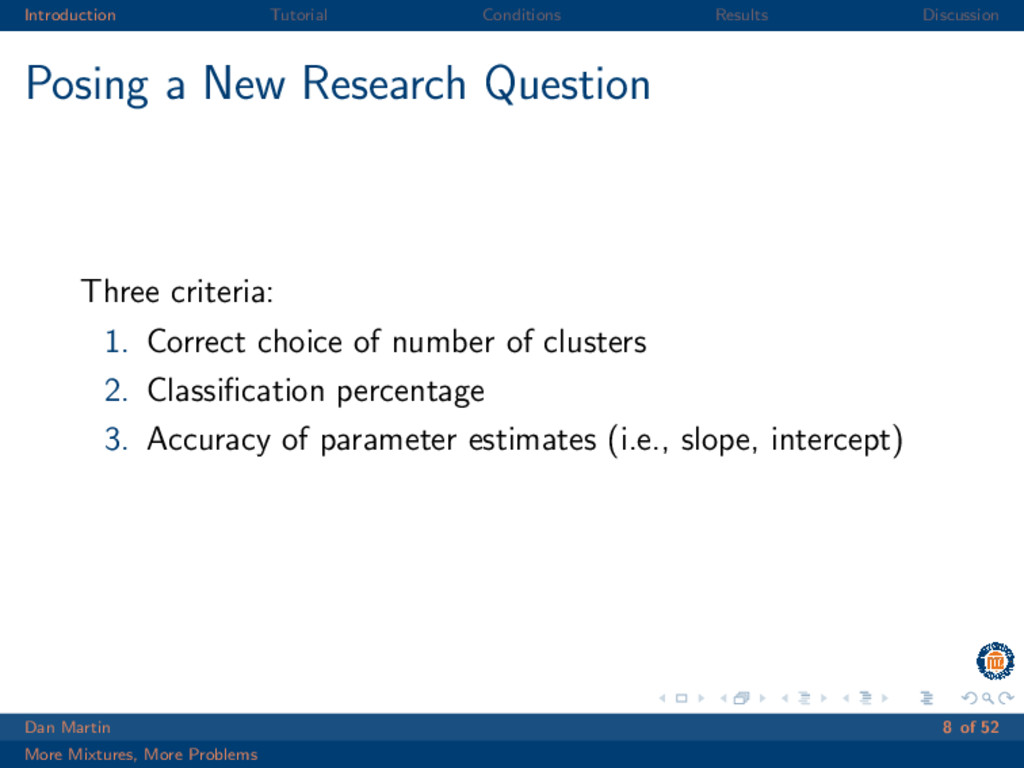
    Three criteria: 1. Correct choice of number of clusters 2. Classification percentage 3. Accuracy of parameter estimates (i.e., slope, intercept) Dan Martin 8 of 52 More Mixtures, More Problems
  9. Introduction Tutorial Conditions Results Discussion What is K-means? Step 1

    Credit: Wikimedia Commons Dan Martin 9 of 52 More Mixtures, More Problems
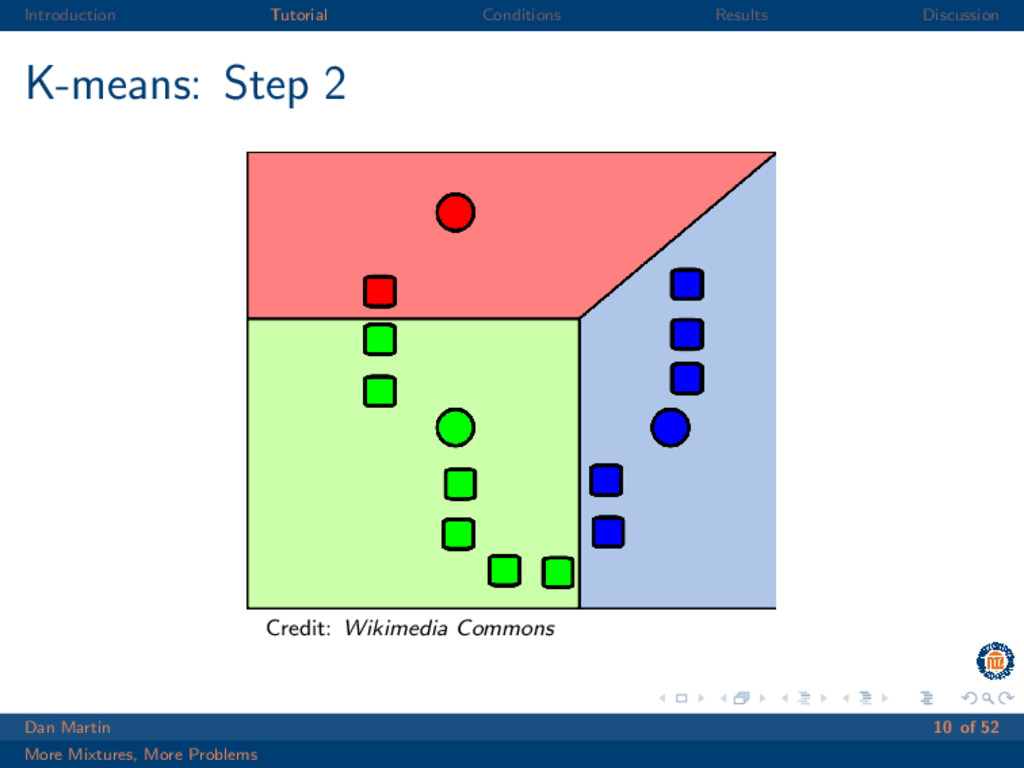
  10. Introduction Tutorial Conditions Results Discussion K-means: Step 2 Credit: Wikimedia

    Commons Dan Martin 10 of 52 More Mixtures, More Problems
  11. Introduction Tutorial Conditions Results Discussion K-means: Step 3 Credit: Wikimedia

    Commons Dan Martin 11 of 52 More Mixtures, More Problems
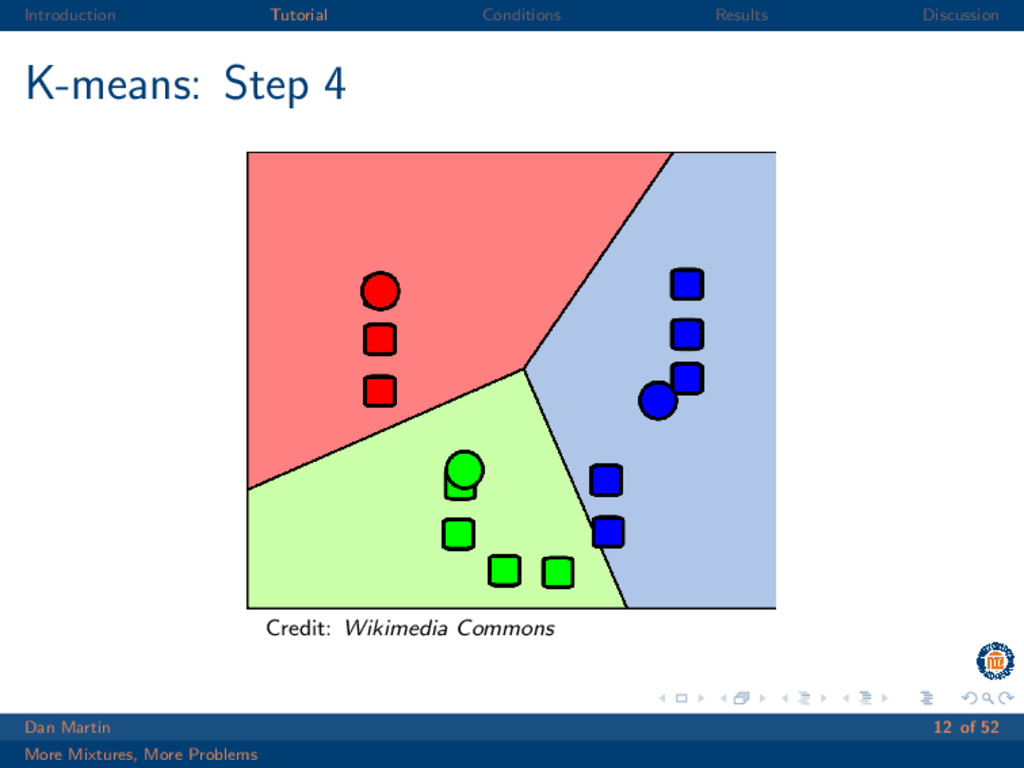
  12. Introduction Tutorial Conditions Results Discussion K-means: Step 4 Credit: Wikimedia

    Commons Dan Martin 12 of 52 More Mixtures, More Problems
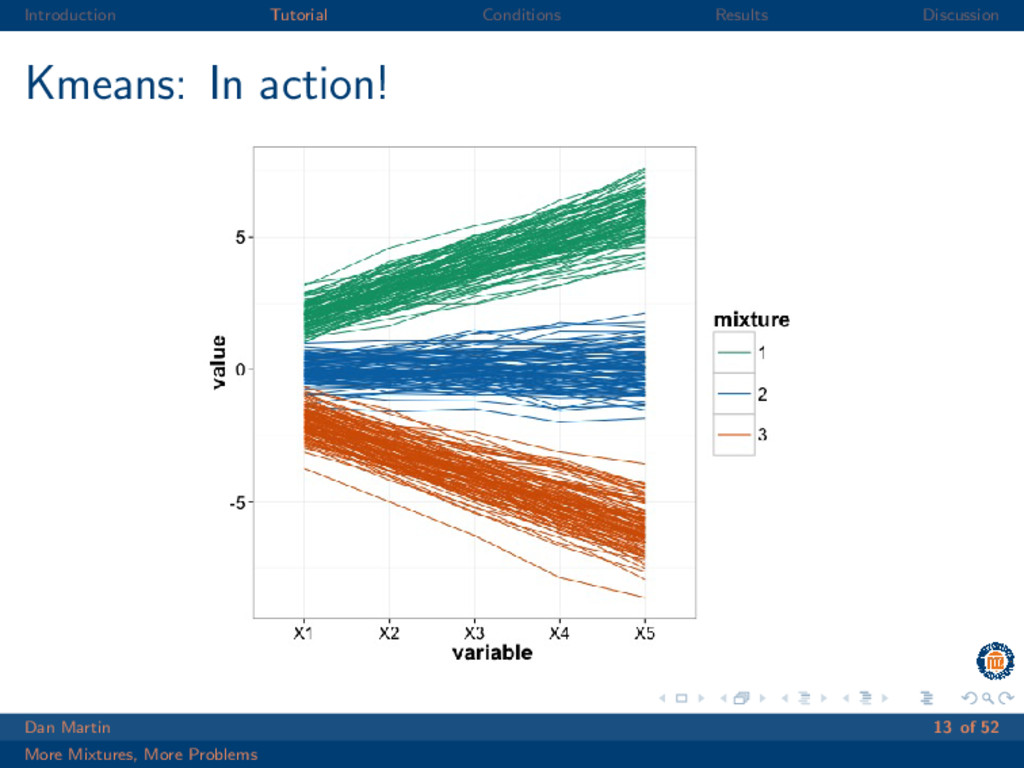
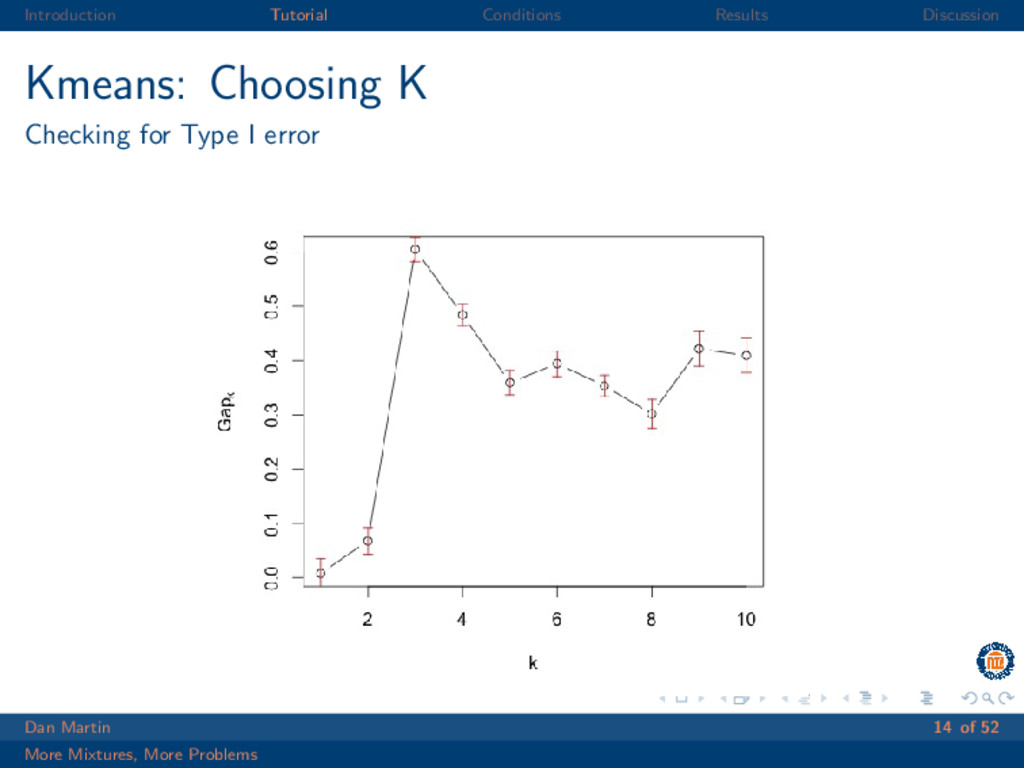
  13. Introduction Tutorial Conditions Results Discussion Kmeans: Choosing K Checking for

    Type I error Dan Martin 14 of 52 More Mixtures, More Problems
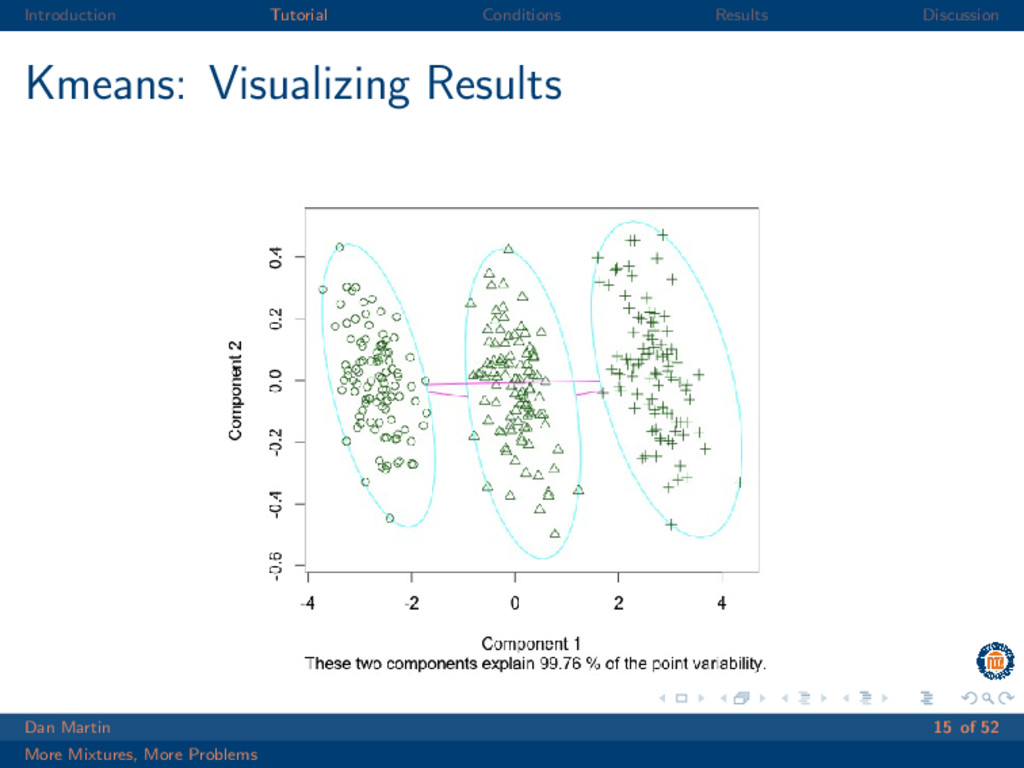
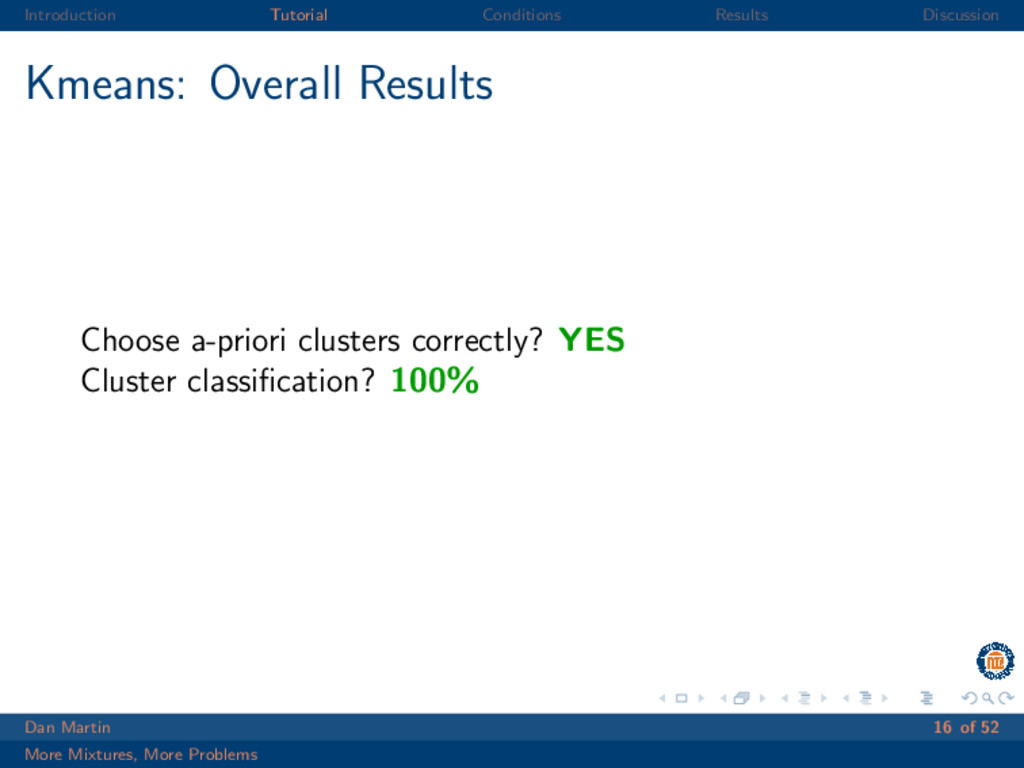
  14. Introduction Tutorial Conditions Results Discussion Kmeans: Overall Results Choose a-priori

    clusters correctly? YES Cluster classification? 100% Dan Martin 16 of 52 More Mixtures, More Problems
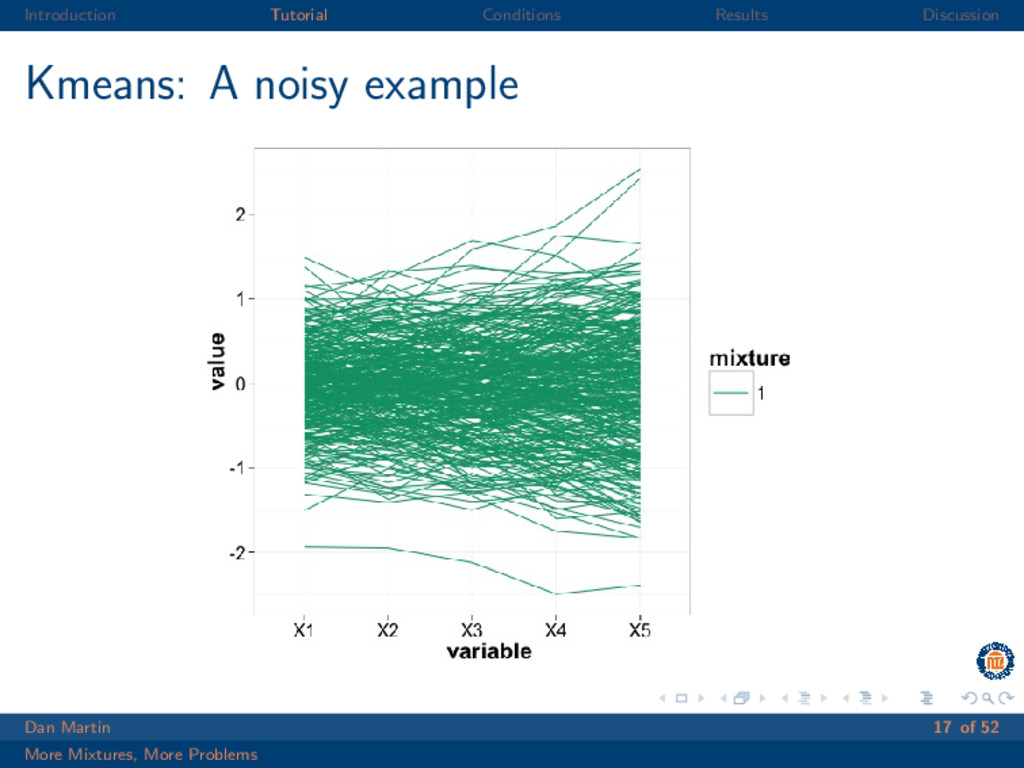
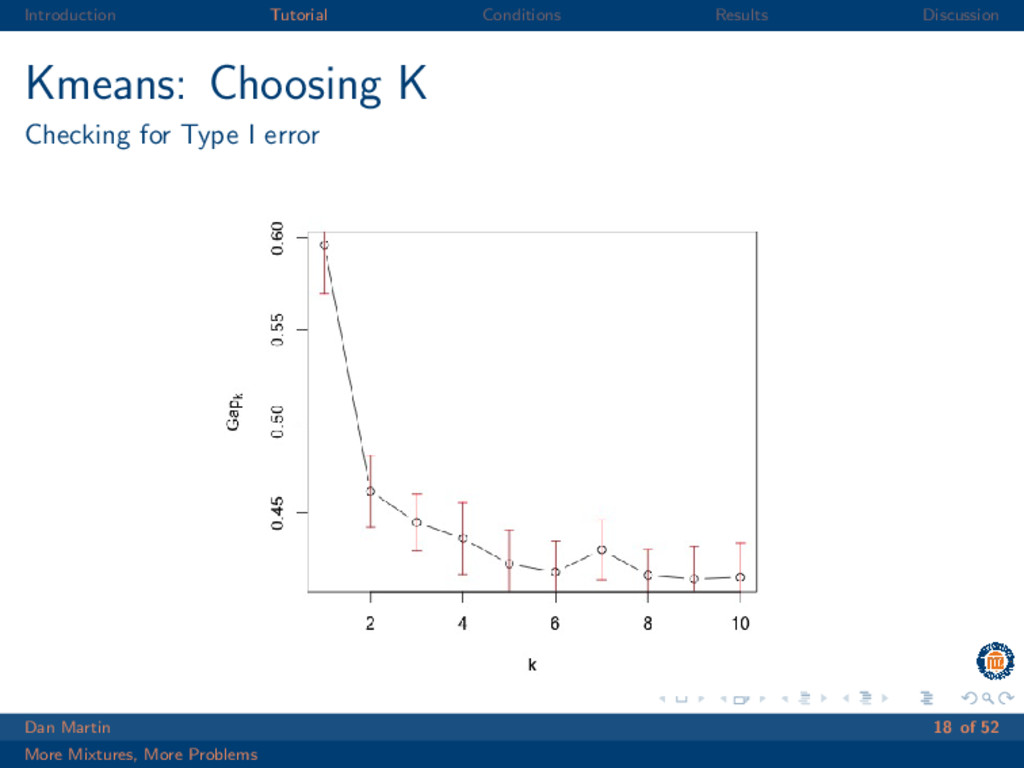
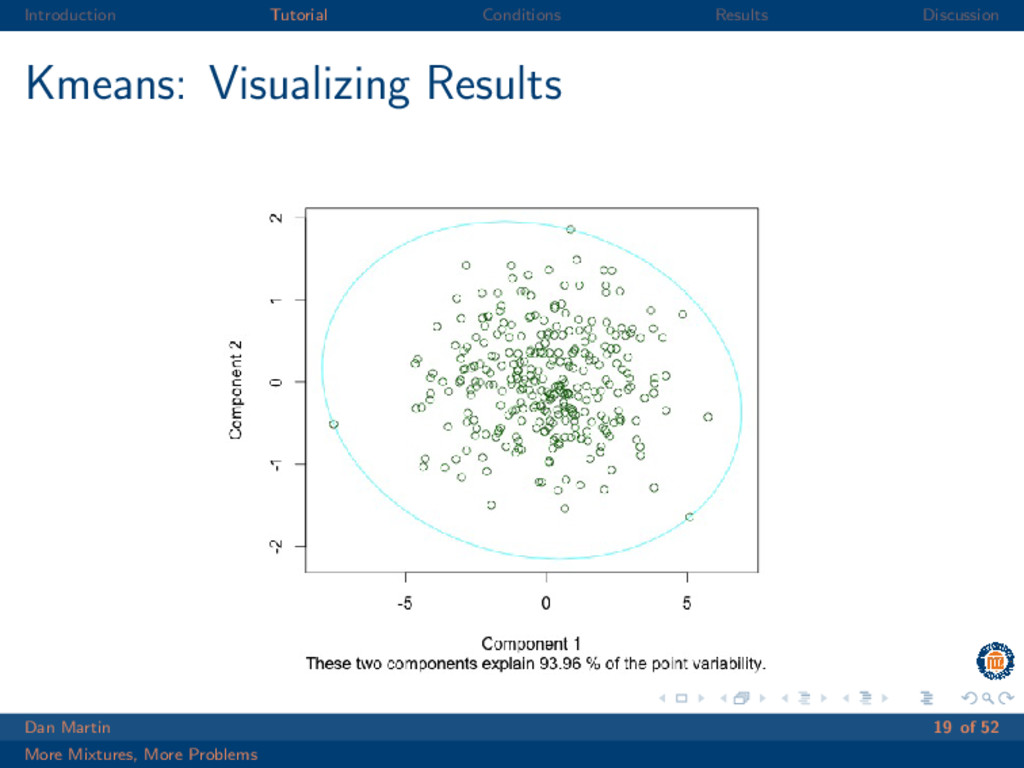
  15. Introduction Tutorial Conditions Results Discussion Kmeans: Choosing K Checking for

    Type I error Dan Martin 18 of 52 More Mixtures, More Problems
  16. Introduction Tutorial Conditions Results Discussion Kmeans: Overall Results Did the

    gap statistic catch the type I error? YES Dan Martin 20 of 52 More Mixtures, More Problems
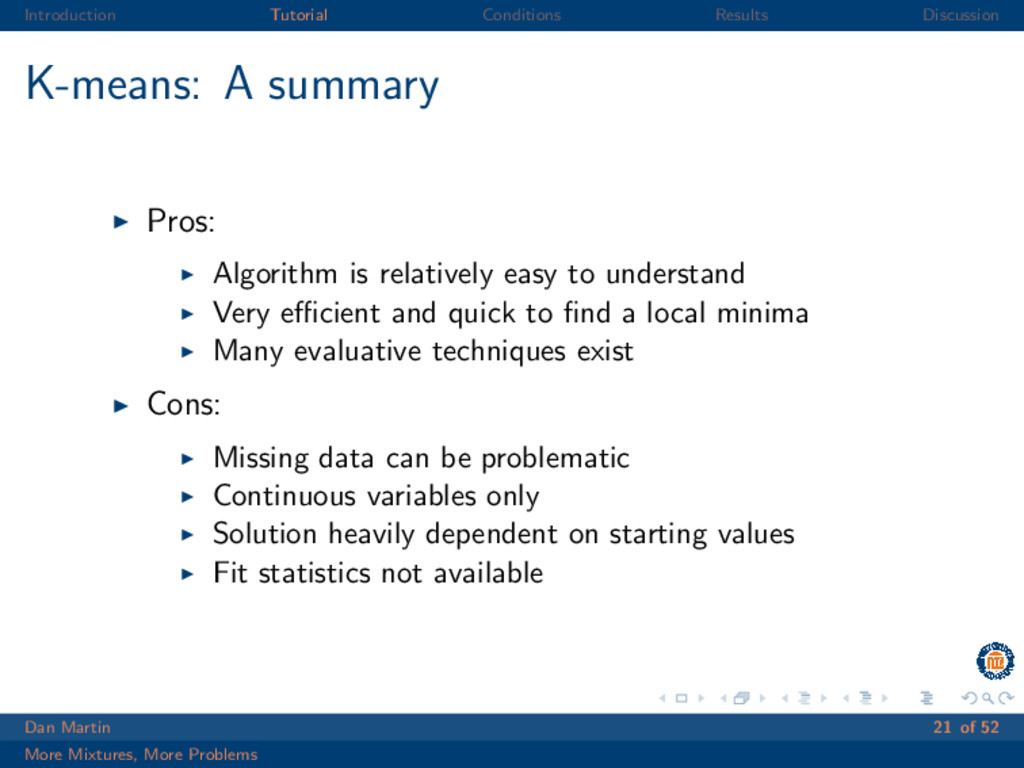
  17. Introduction Tutorial Conditions Results Discussion K-means: A summary Pros: Algorithm

    is relatively easy to understand Very efficient and quick to find a local minima Many evaluative techniques exist Cons: Missing data can be problematic Continuous variables only Solution heavily dependent on starting values Fit statistics not available Dan Martin 21 of 52 More Mixtures, More Problems
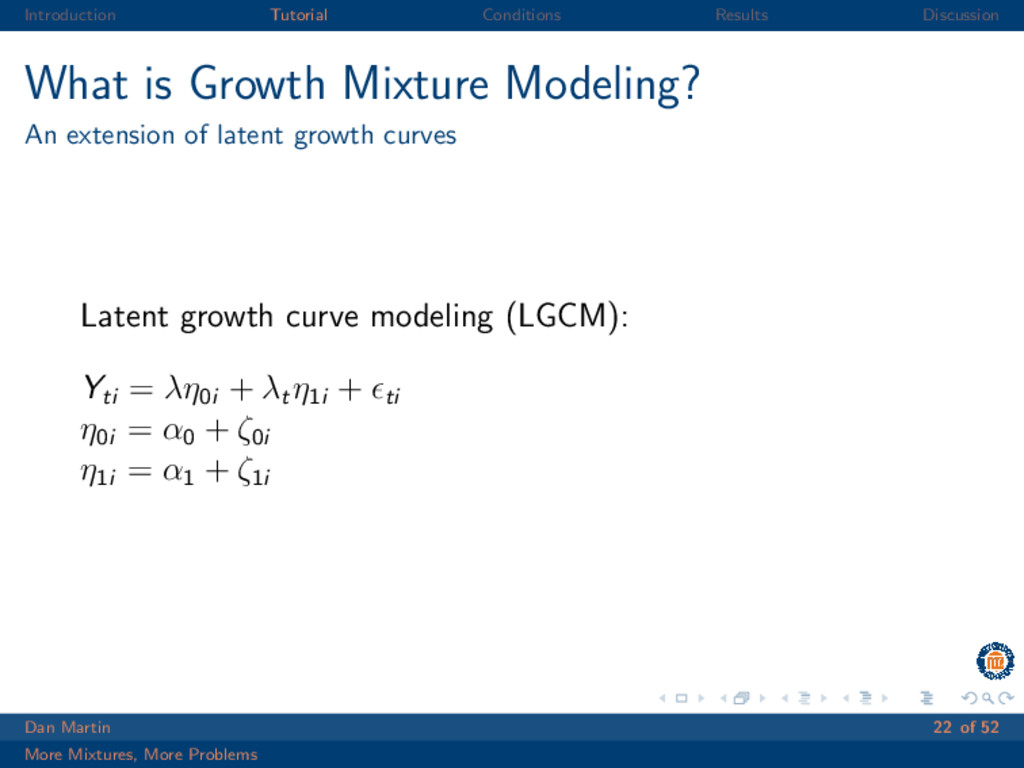
  18. Introduction Tutorial Conditions Results Discussion What is Growth Mixture Modeling?

    An extension of latent growth curves Latent growth curve modeling (LGCM): Yti = λη0i + λt η1i + ti η0i = α0 + ζ0i η1i = α1 + ζ1i Dan Martin 22 of 52 More Mixtures, More Problems
  19. Introduction Tutorial Conditions Results Discussion What is Growth Mixture Modeling?

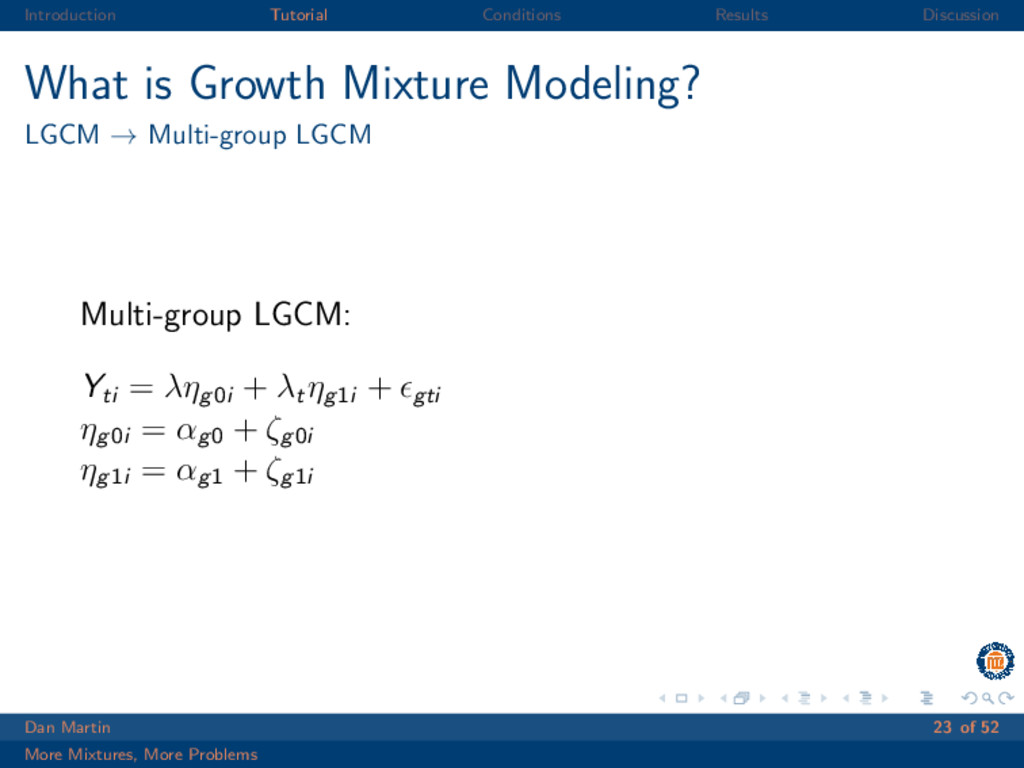
    LGCM → Multi-group LGCM Multi-group LGCM: Yti = ληg0i + λt ηg1i + gti ηg0i = αg0 + ζg0i ηg1i = αg1 + ζg1i Dan Martin 23 of 52 More Mixtures, More Problems
  20. Introduction Tutorial Conditions Results Discussion What is Growth Mixture Modeling?

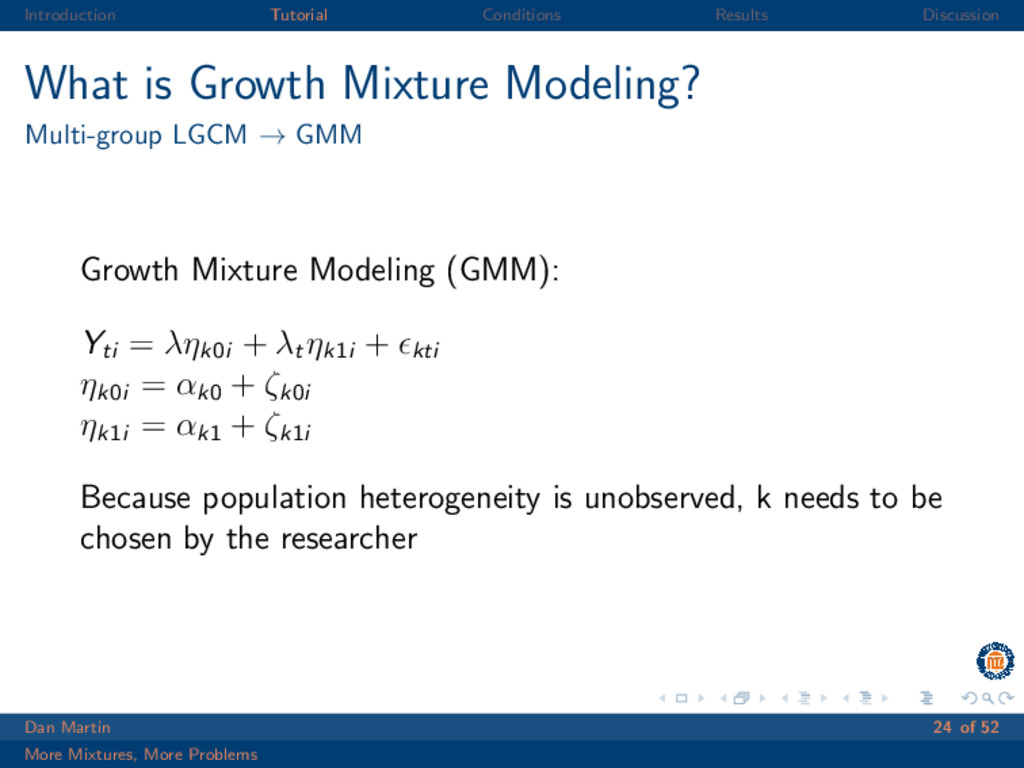
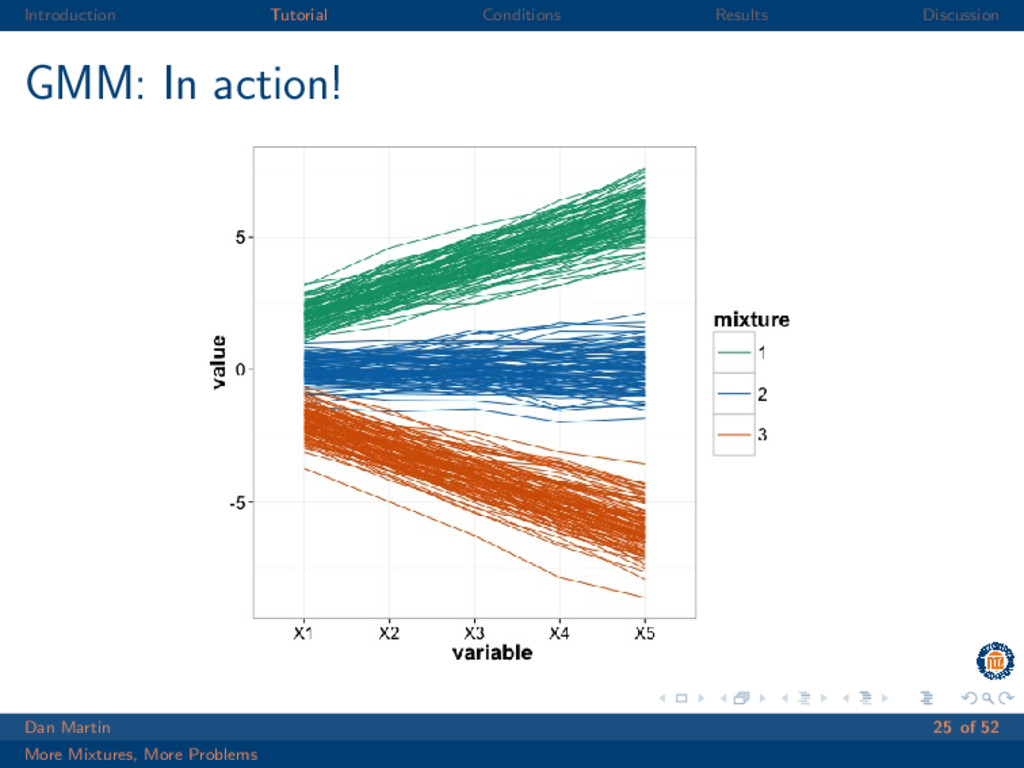
    Multi-group LGCM → GMM Growth Mixture Modeling (GMM): Yti = ληk0i + λt ηk1i + kti ηk0i = αk0 + ζk0i ηk1i = αk1 + ζk1i Because population heterogeneity is unobserved, k needs to be chosen by the researcher Dan Martin 24 of 52 More Mixtures, More Problems
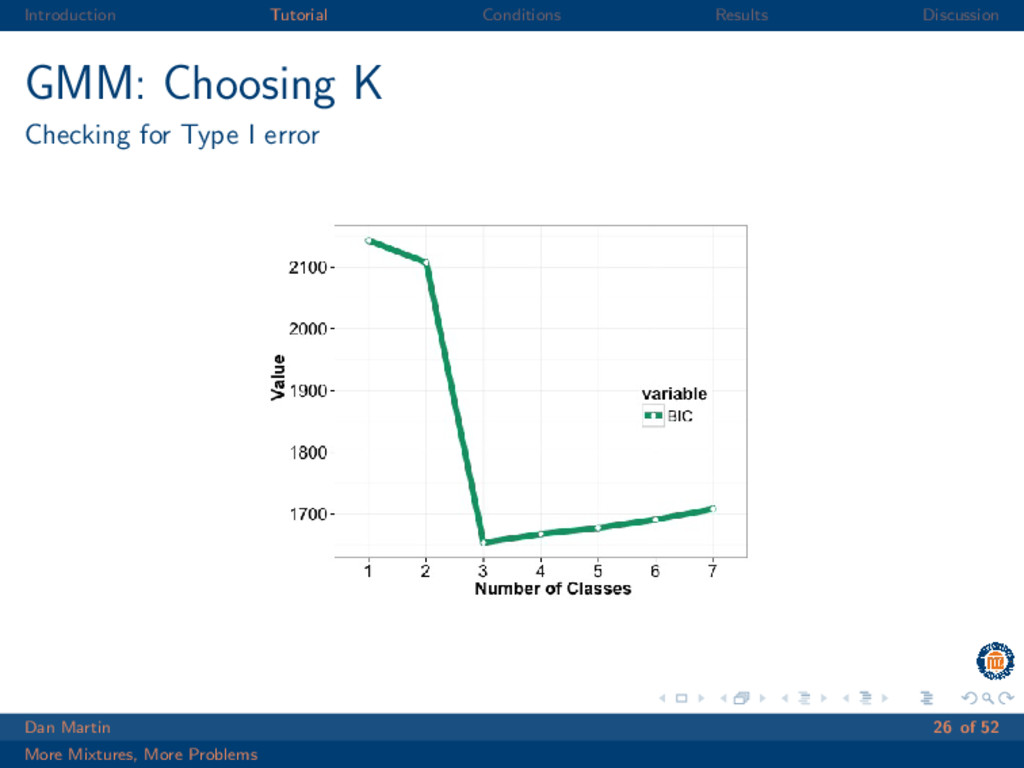
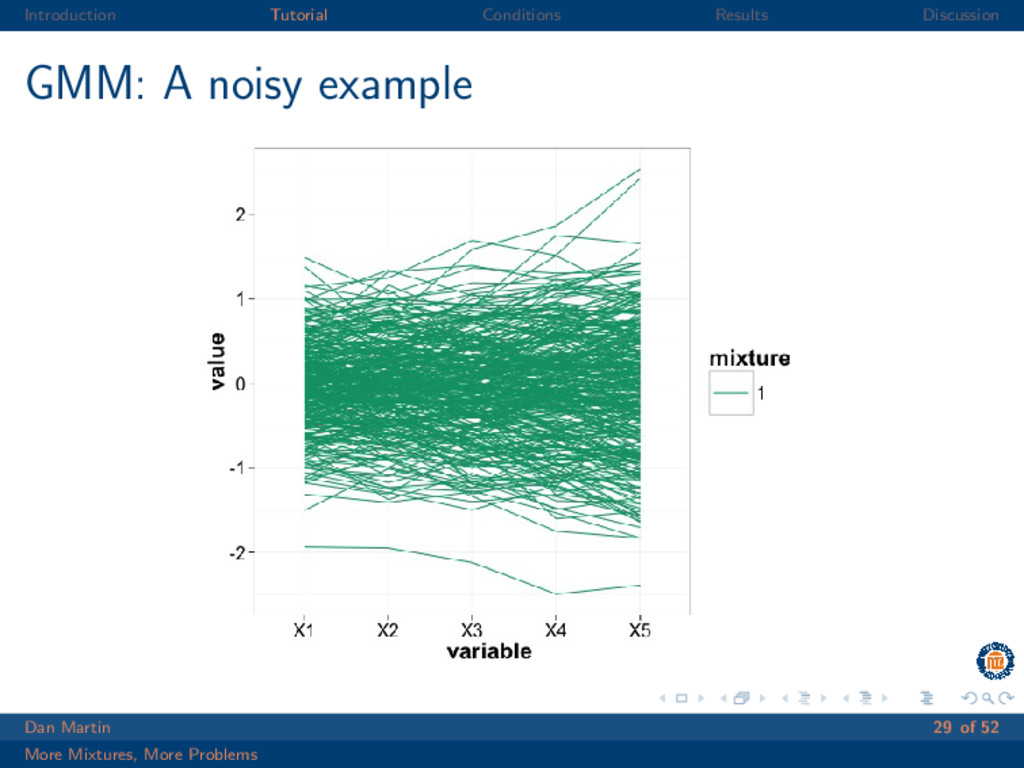
  21. Introduction Tutorial Conditions Results Discussion GMM: Choosing K Checking for

    Type I error Dan Martin 26 of 52 More Mixtures, More Problems
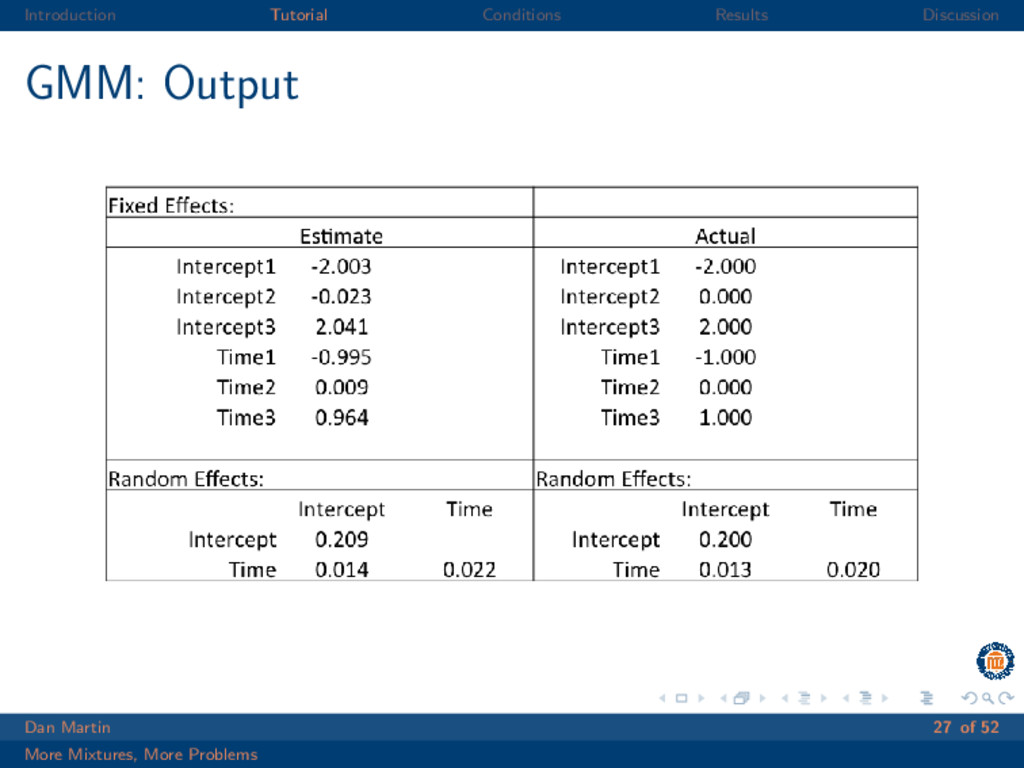
  22. Introduction Tutorial Conditions Results Discussion GMM: Overall Results Choose a-priori

    clusters correctly? YES Cluster classification? 100% Dan Martin 28 of 52 More Mixtures, More Problems
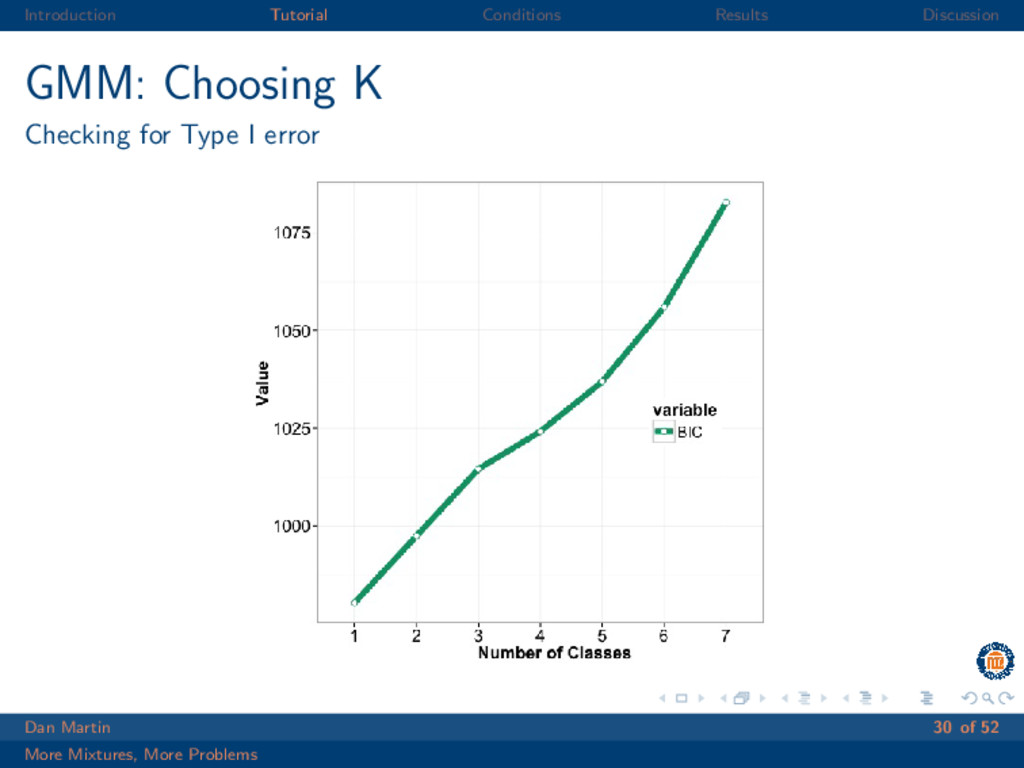
  23. Introduction Tutorial Conditions Results Discussion GMM: Choosing K Checking for

    Type I error Dan Martin 30 of 52 More Mixtures, More Problems
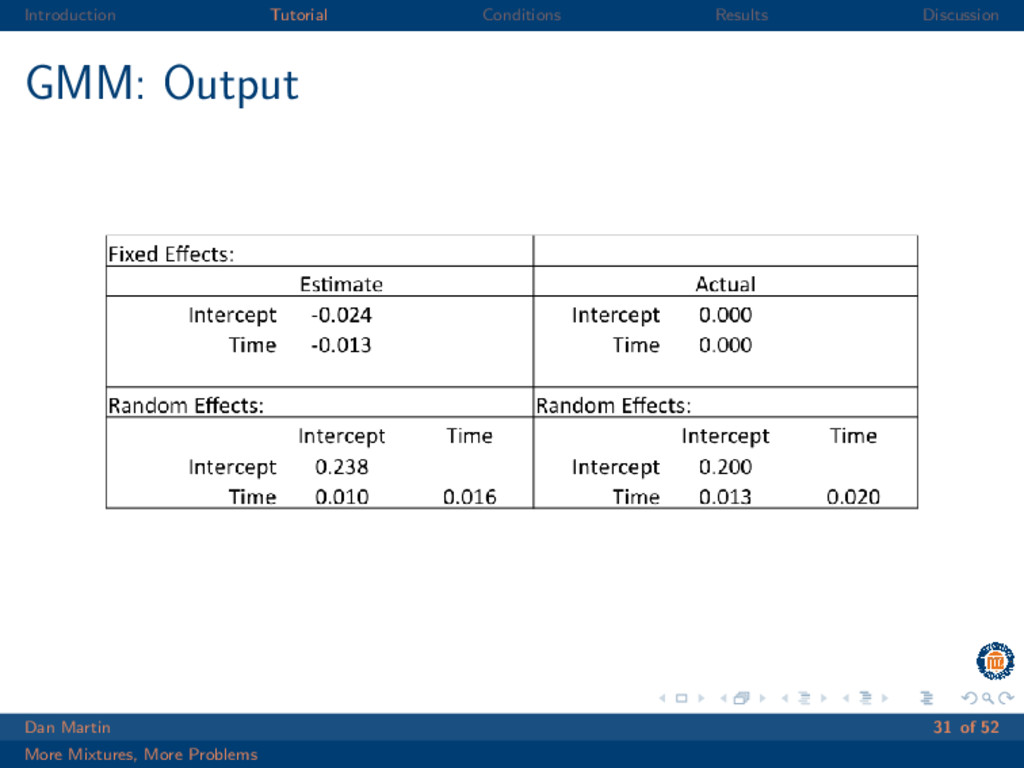
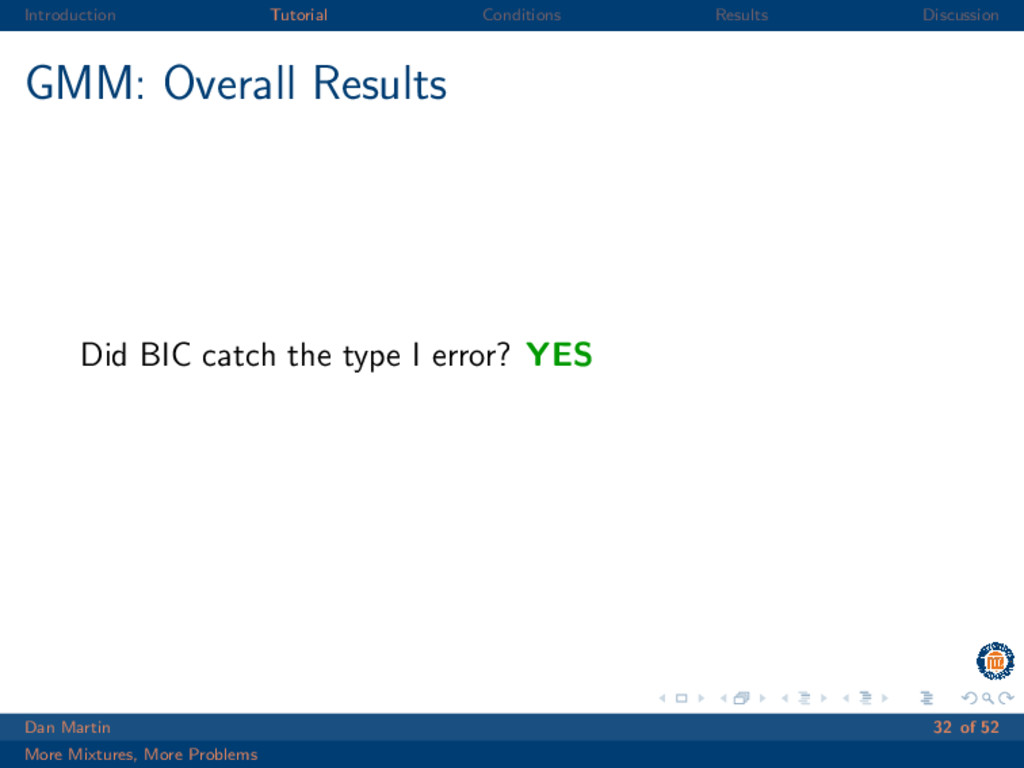
  24. Introduction Tutorial Conditions Results Discussion GMM: Overall Results Did BIC

    catch the type I error? YES Dan Martin 32 of 52 More Mixtures, More Problems
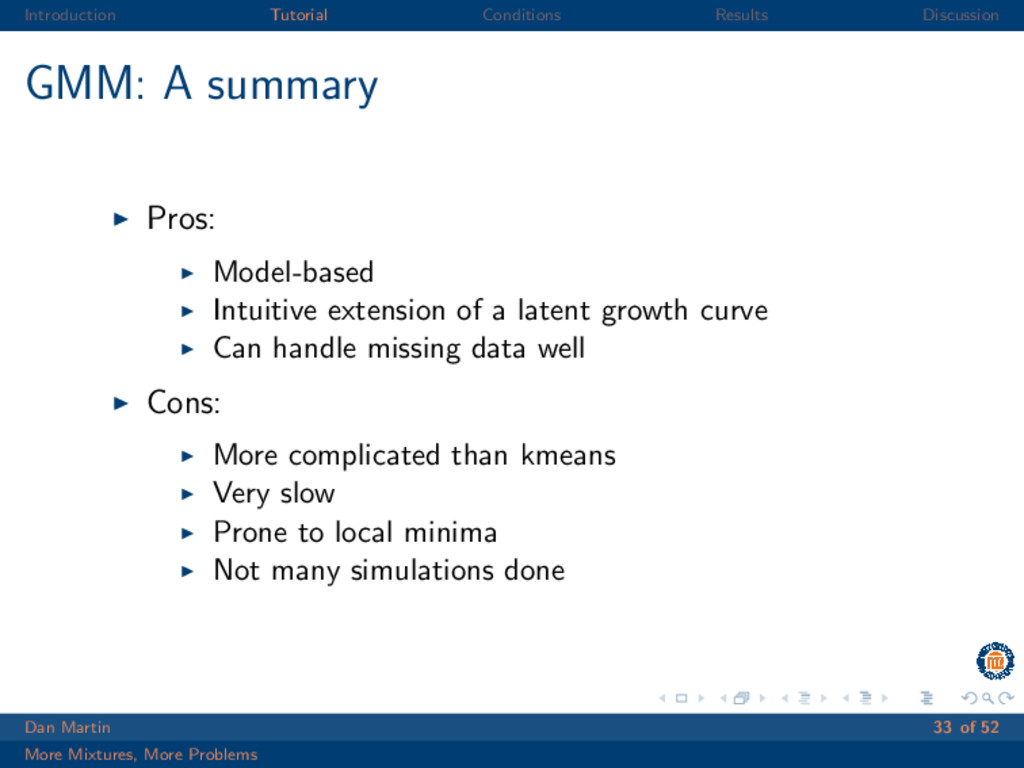
  25. Introduction Tutorial Conditions Results Discussion GMM: A summary Pros: Model-based

    Intuitive extension of a latent growth curve Can handle missing data well Cons: More complicated than kmeans Very slow Prone to local minima Not many simulations done Dan Martin 33 of 52 More Mixtures, More Problems
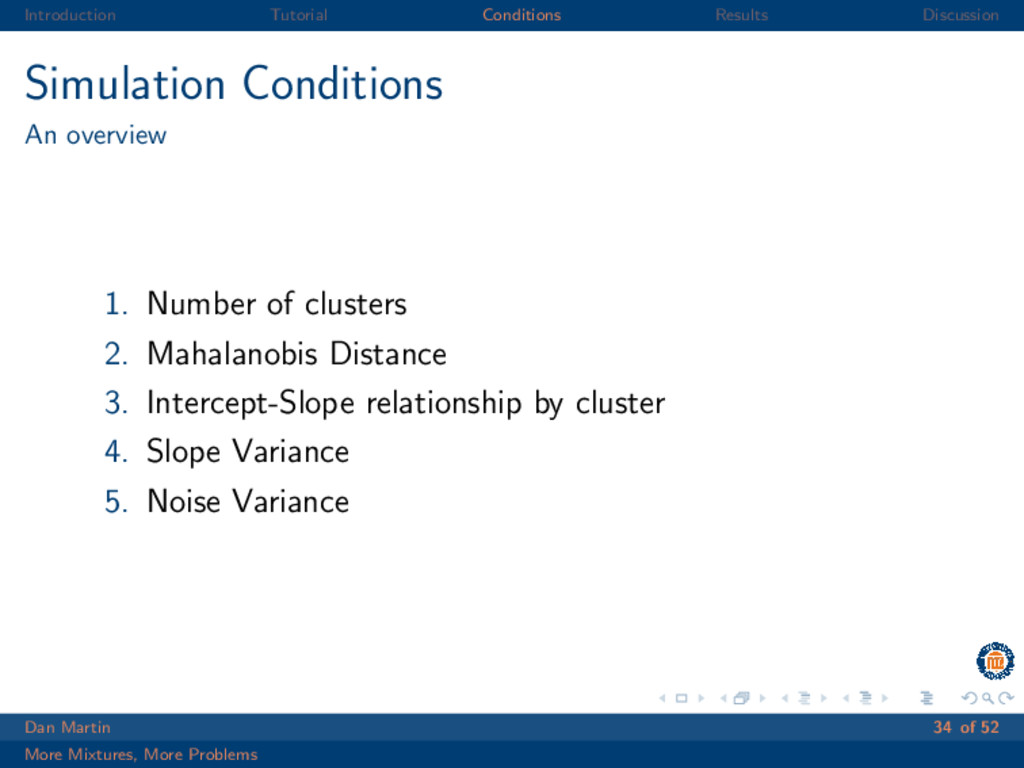
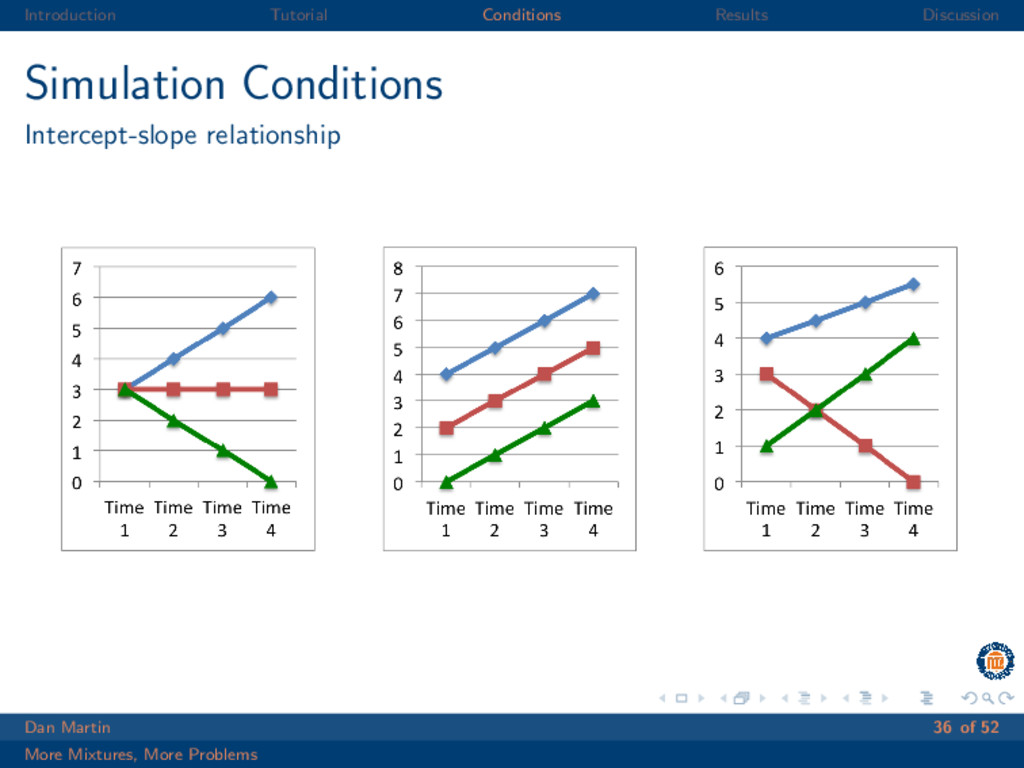
  26. Introduction Tutorial Conditions Results Discussion Simulation Conditions An overview 1.

    Number of clusters 2. Mahalanobis Distance 3. Intercept-Slope relationship by cluster 4. Slope Variance 5. Noise Variance Dan Martin 34 of 52 More Mixtures, More Problems
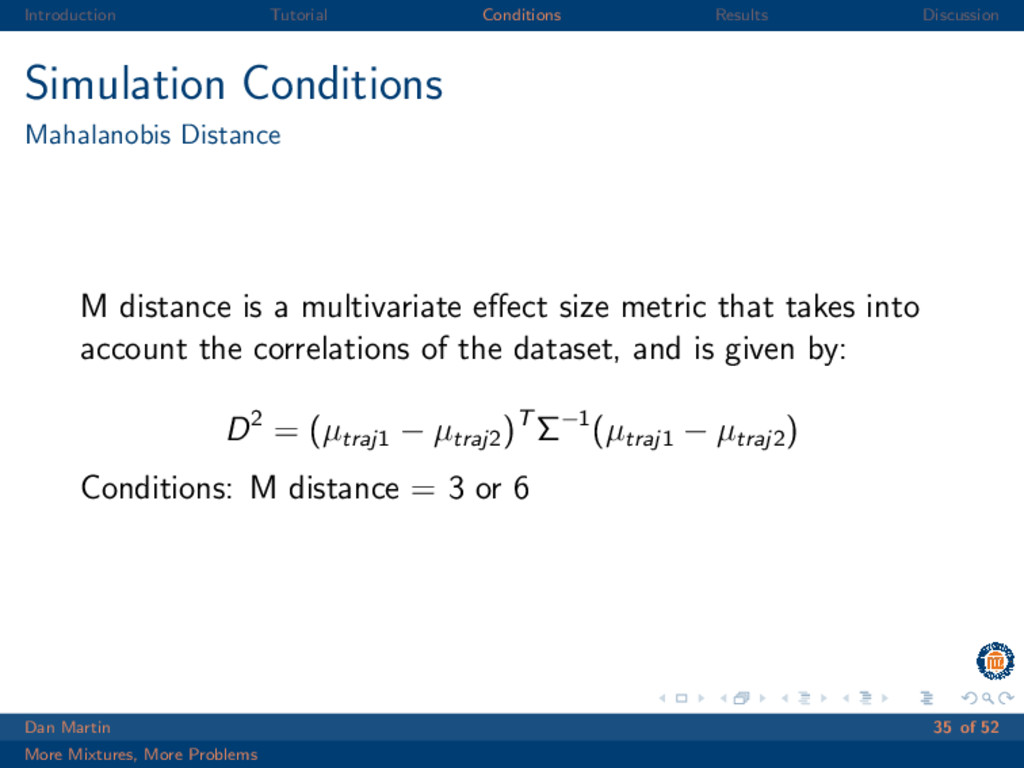
  27. Introduction Tutorial Conditions Results Discussion Simulation Conditions Mahalanobis Distance M

    distance is a multivariate effect size metric that takes into account the correlations of the dataset, and is given by: D2 = (µtraj1 − µtraj2 )T Σ−1(µtraj1 − µtraj2 ) Conditions: M distance = 3 or 6 Dan Martin 35 of 52 More Mixtures, More Problems
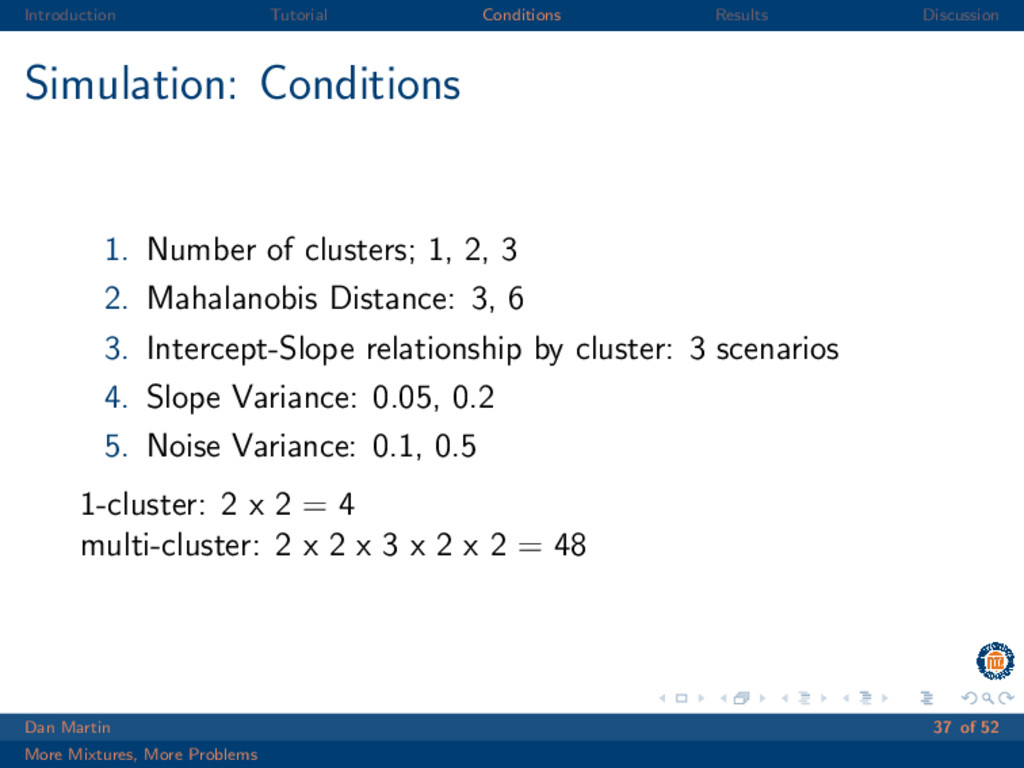
  28. Introduction Tutorial Conditions Results Discussion Simulation: Conditions 1. Number of

    clusters; 1, 2, 3 2. Mahalanobis Distance: 3, 6 3. Intercept-Slope relationship by cluster: 3 scenarios 4. Slope Variance: 0.05, 0.2 5. Noise Variance: 0.1, 0.5 1-cluster: 2 x 2 = 4 multi-cluster: 2 x 2 x 3 x 2 x 2 = 48 Dan Martin 37 of 52 More Mixtures, More Problems
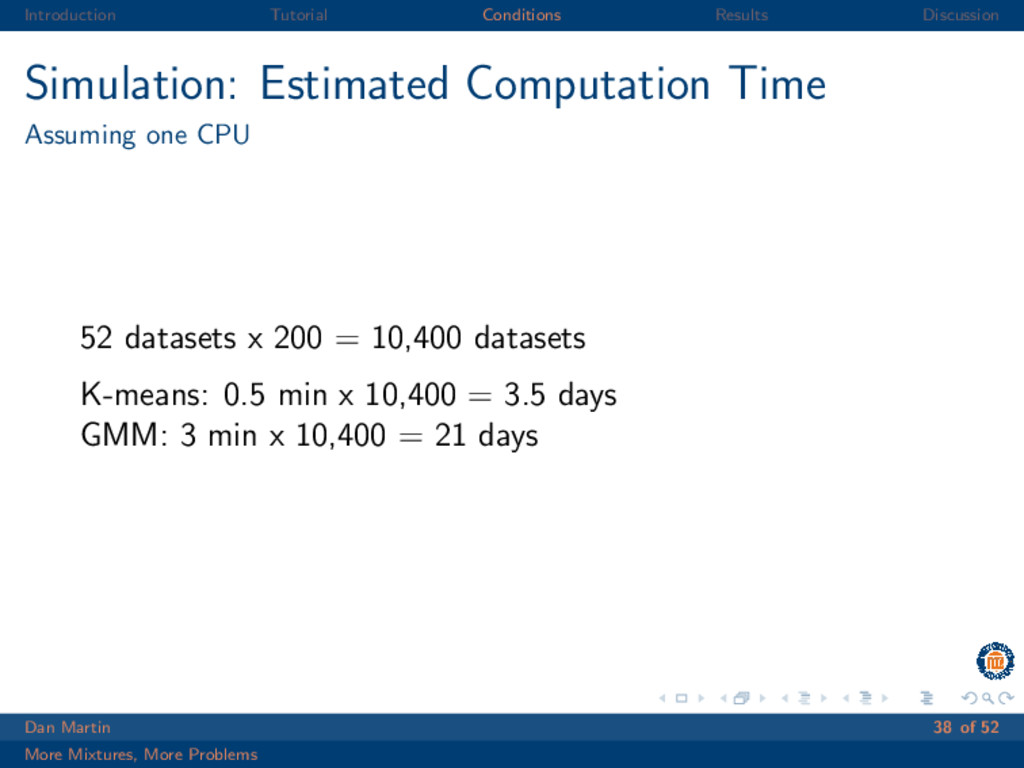
  29. Introduction Tutorial Conditions Results Discussion Simulation: Estimated Computation Time Assuming

    one CPU 52 datasets x 200 = 10,400 datasets K-means: 0.5 min x 10,400 = 3.5 days GMM: 3 min x 10,400 = 21 days Dan Martin 38 of 52 More Mixtures, More Problems
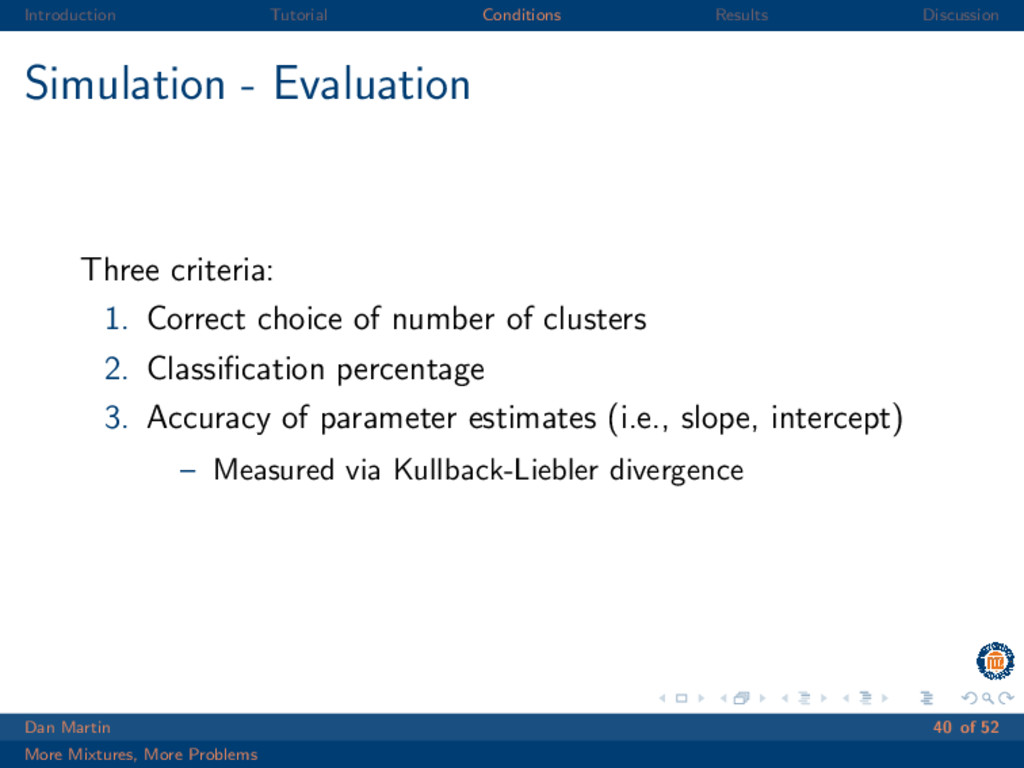
  30. Introduction Tutorial Conditions Results Discussion Simulation - Evaluation Three criteria:

    1. Correct choice of number of clusters 2. Classification percentage 3. Accuracy of parameter estimates (i.e., slope, intercept) – Measured via Kullback-Liebler divergence Dan Martin 40 of 52 More Mixtures, More Problems
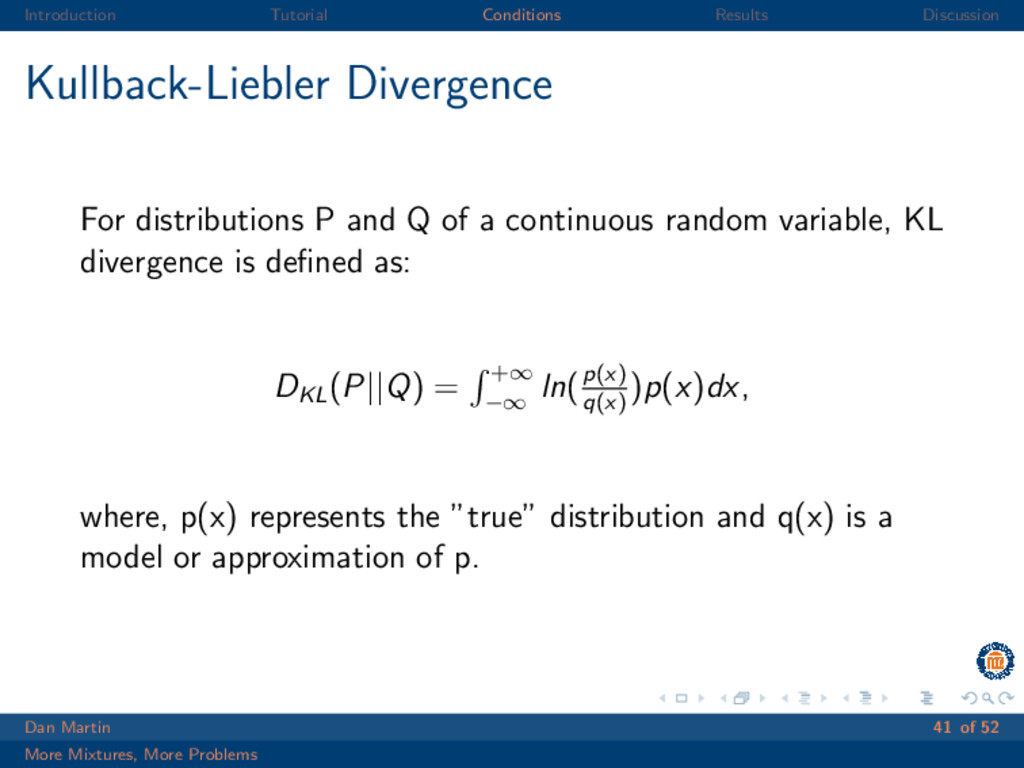
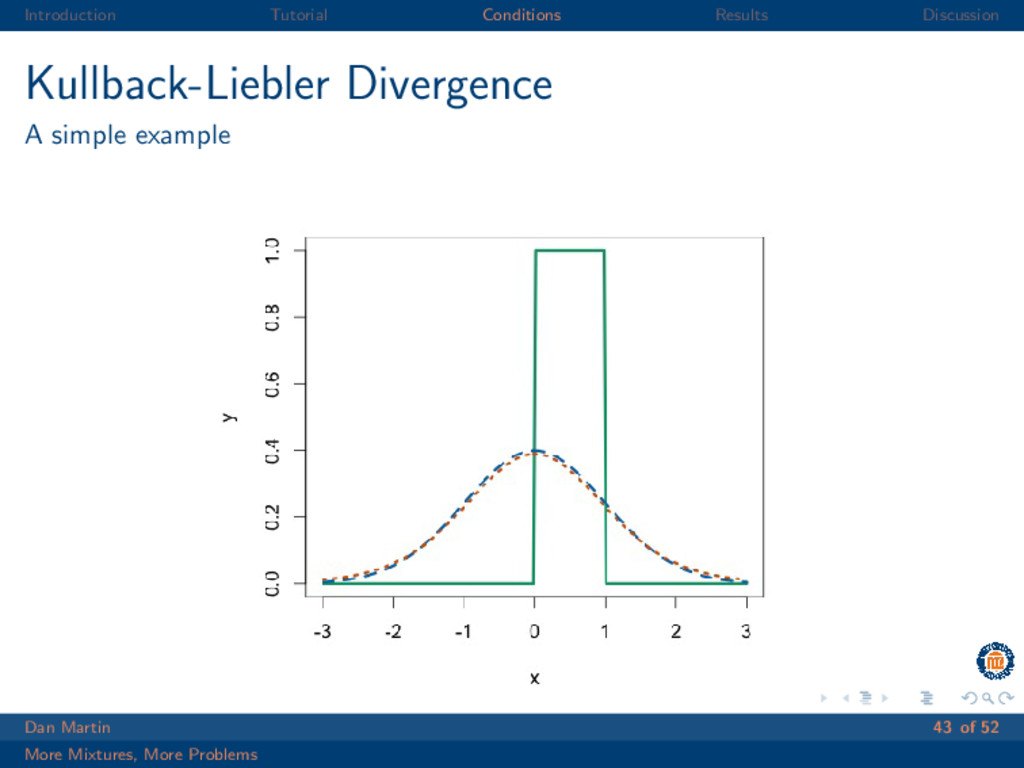
  31. Introduction Tutorial Conditions Results Discussion Kullback-Liebler Divergence For distributions P

    and Q of a continuous random variable, KL divergence is defined as: DKL (P||Q) = +∞ −∞ ln(p(x) q(x) )p(x)dx, where, p(x) represents the ”true” distribution and q(x) is a model or approximation of p. Dan Martin 41 of 52 More Mixtures, More Problems
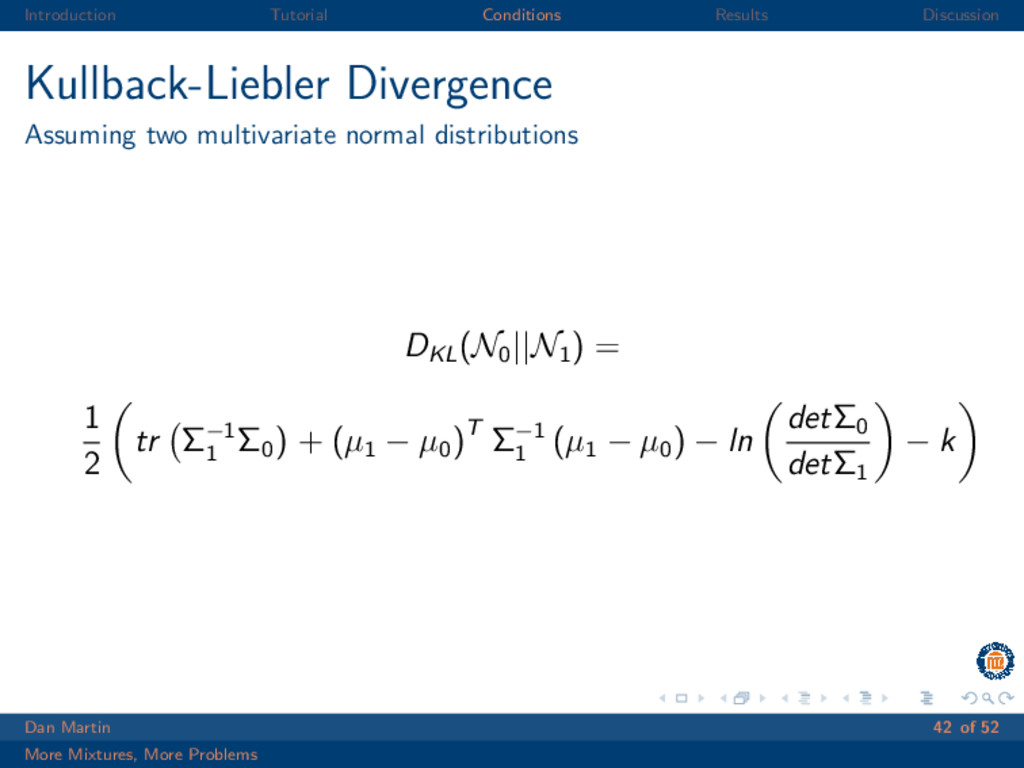
  32. Introduction Tutorial Conditions Results Discussion Kullback-Liebler Divergence Assuming two multivariate

    normal distributions DKL (N0 ||N1 ) = 1 2 tr Σ−1 1 Σ0 ) + (µ1 − µ0 )T Σ−1 1 (µ1 − µ0 ) − ln detΣ0 detΣ1 − k Dan Martin 42 of 52 More Mixtures, More Problems
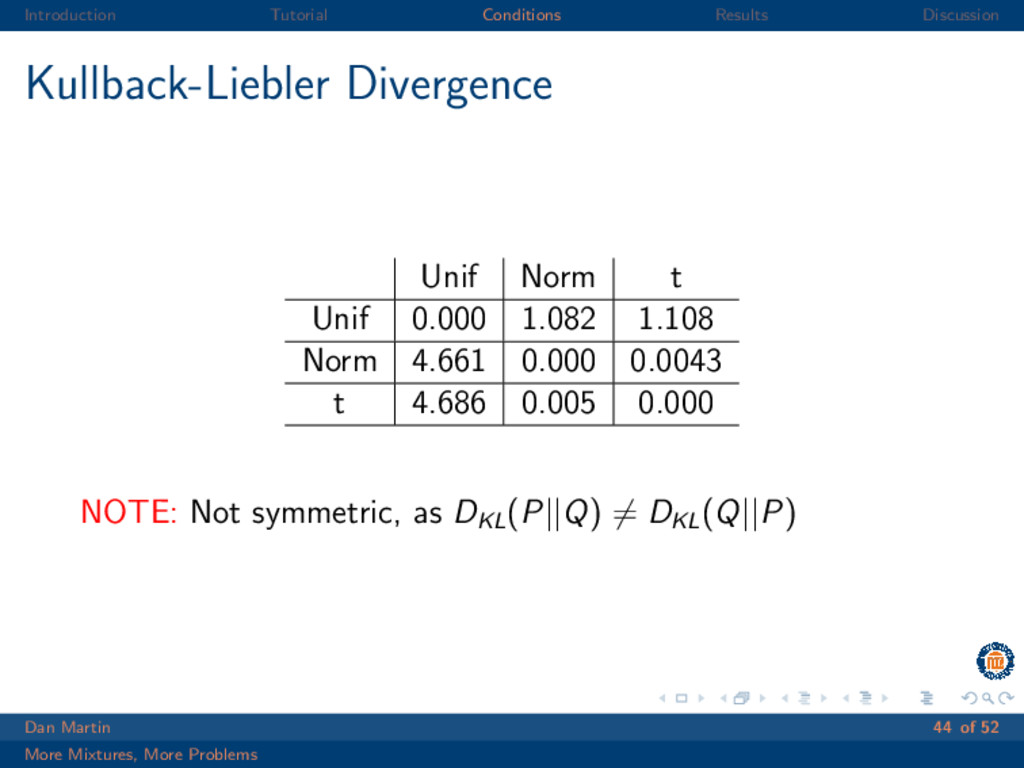
  33. Introduction Tutorial Conditions Results Discussion Kullback-Liebler Divergence Unif Norm t

    Unif 0.000 1.082 1.108 Norm 4.661 0.000 0.0043 t 4.686 0.005 0.000 NOTE: Not symmetric, as DKL (P||Q) = DKL (Q||P) Dan Martin 44 of 52 More Mixtures, More Problems
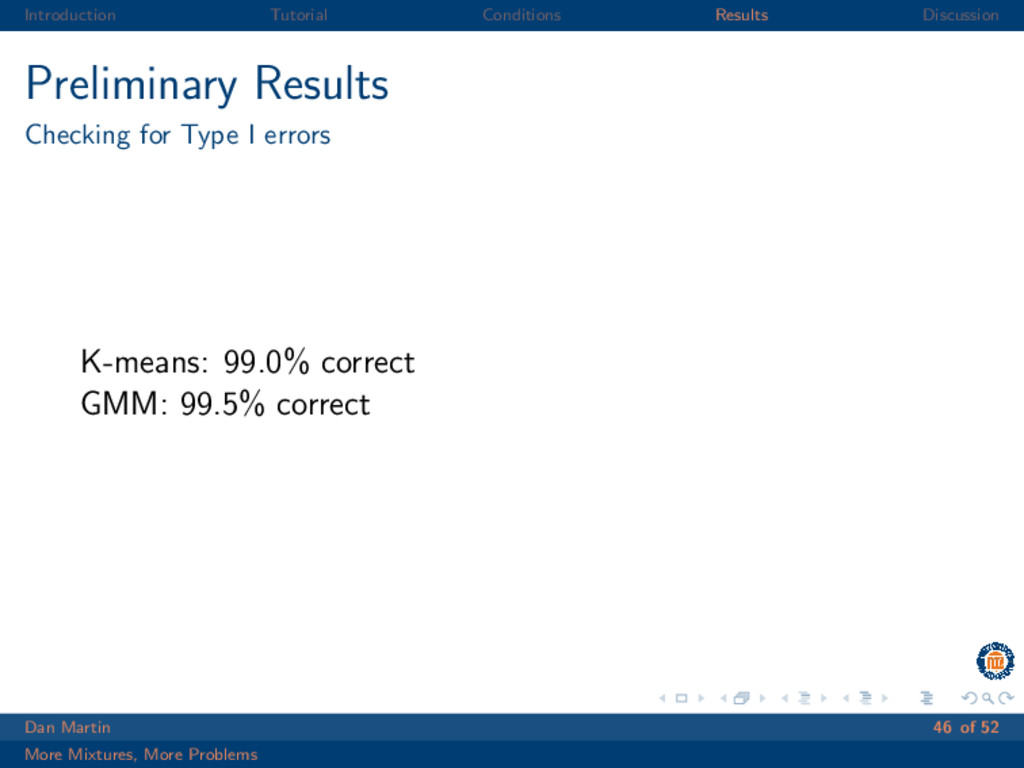
  34. Introduction Tutorial Conditions Results Discussion Preliminary Results Checking for Type

    I errors K-means: 99.0% correct GMM: 99.5% correct Dan Martin 46 of 52 More Mixtures, More Problems
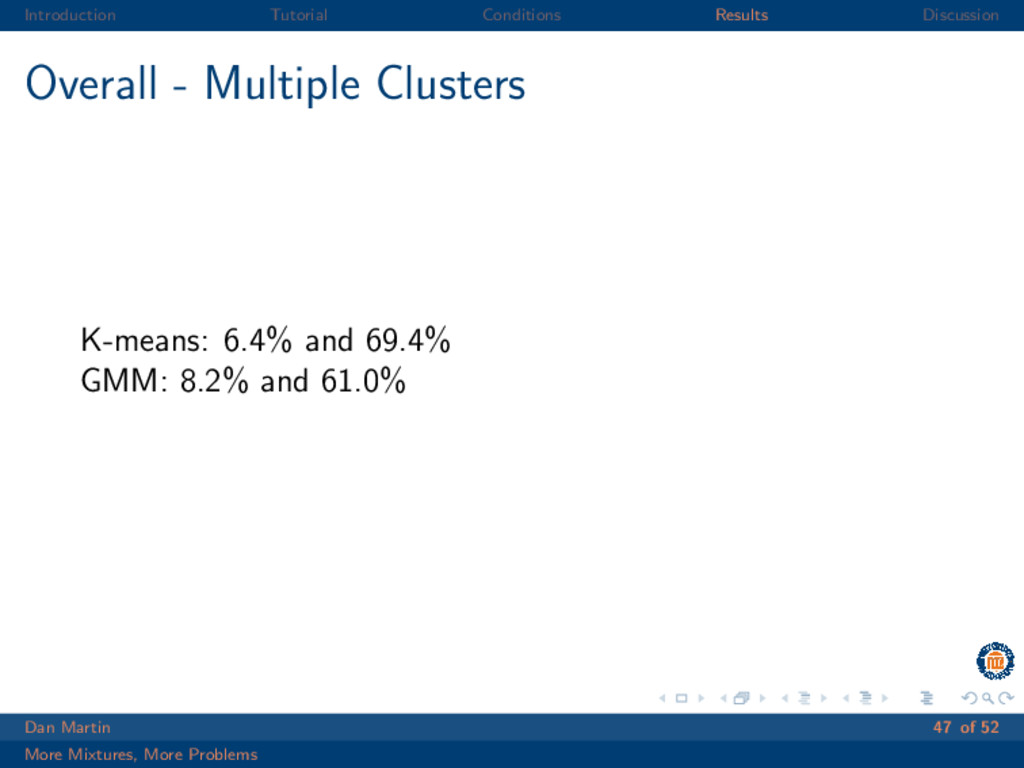
  35. Introduction Tutorial Conditions Results Discussion Overall - Multiple Clusters K-means:

    6.4% and 69.4% GMM: 8.2% and 61.0% Dan Martin 47 of 52 More Mixtures, More Problems
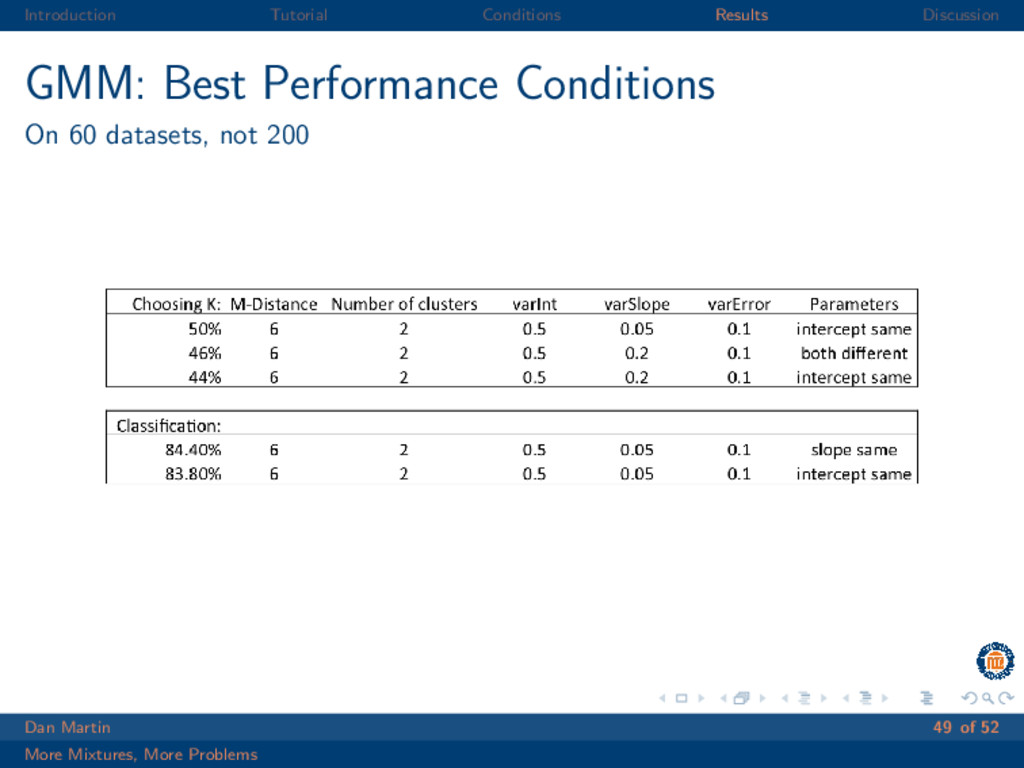
  36. Introduction Tutorial Conditions Results Discussion GMM: Best Performance Conditions On

    60 datasets, not 200 Dan Martin 49 of 52 More Mixtures, More Problems
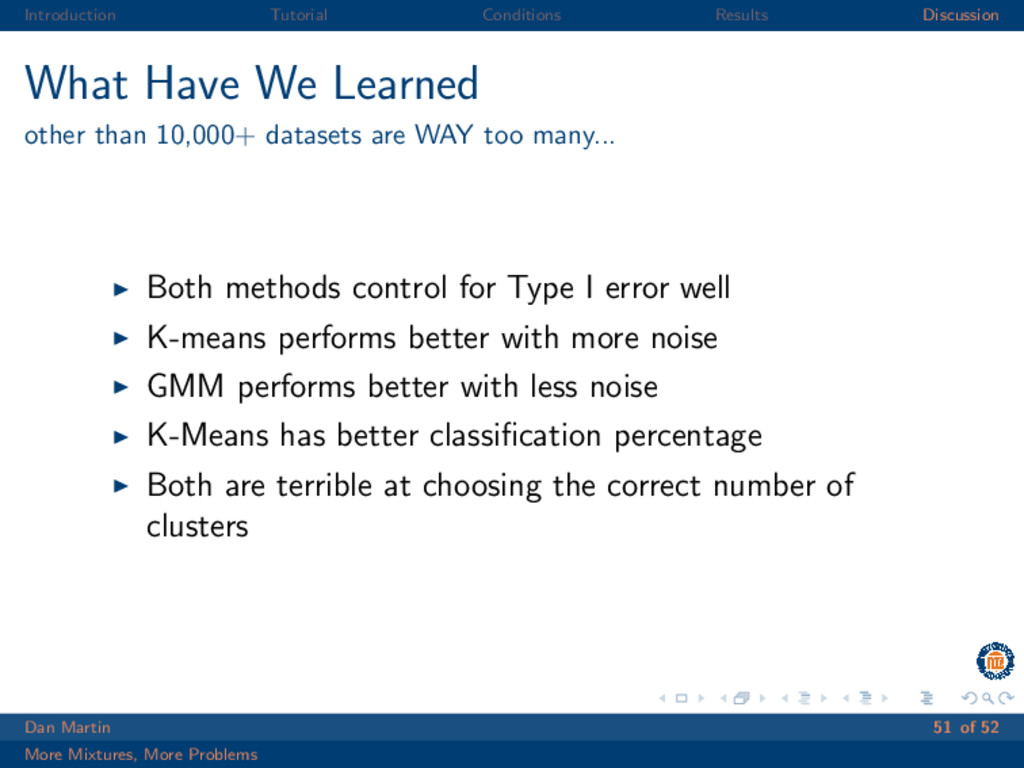
  37. Introduction Tutorial Conditions Results Discussion What Have We Learned other

    than 10,000+ datasets are WAY too many... Both methods control for Type I error well K-means performs better with more noise GMM performs better with less noise K-Means has better classification percentage Both are terrible at choosing the correct number of clusters Dan Martin 51 of 52 More Mixtures, More Problems
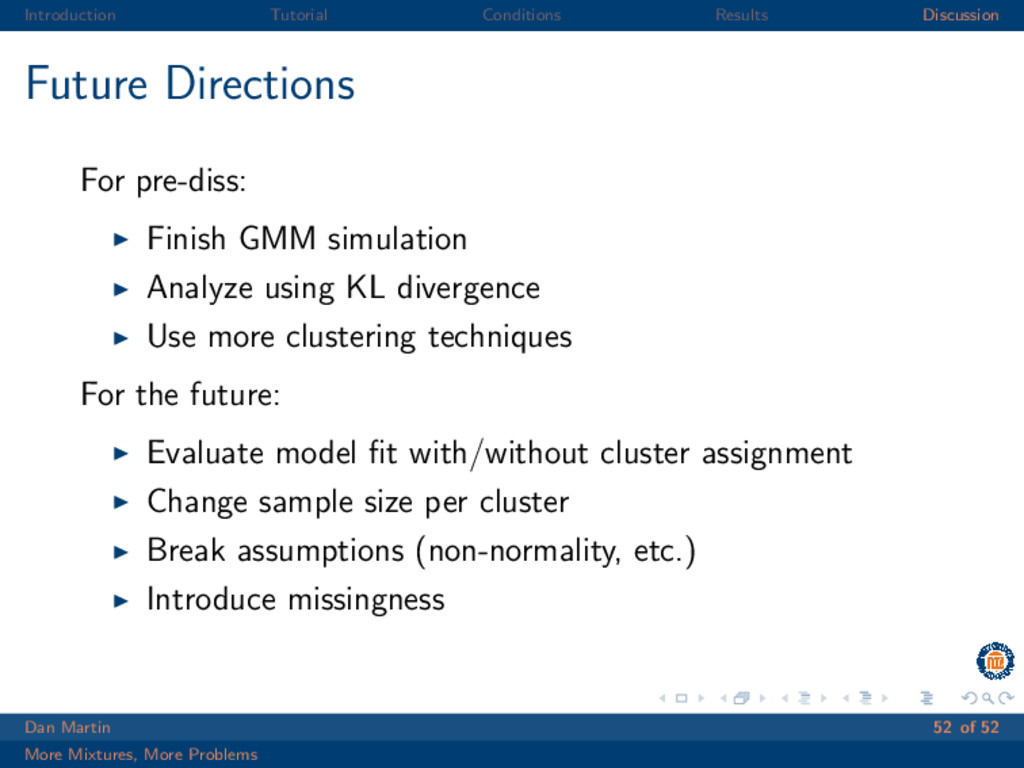
  38. Introduction Tutorial Conditions Results Discussion Future Directions For pre-diss: Finish

    GMM simulation Analyze using KL divergence Use more clustering techniques For the future: Evaluate model fit with/without cluster assignment Change sample size per cluster Break assumptions (non-normality, etc.) Introduce missingness Dan Martin 52 of 52 More Mixtures, More Problems