Upgrade to Pro — share decks privately, control downloads, hide ads and more …

Harder, Better, Faster, Stronger? Growth Mixtur...

Avatar for Dan Dan
November 07, 2013
81

Harder, Better, Faster, Stronger? Growth Mixture models outperform hard, computationally quicker clustering algorithms when detecting longitudinal heterogeneity

Avatar for Dan

Dan

November 07, 2013

Transcript

  1. Introduction Analytic Methods Simulation Conditions Results Conclusion Harder, Better, Faster,

    Stronger? Growth mixture models outperform hard, computationally quicker clustering algorithms when detecting longitudinal heterogeneity Dan Martin University of Virginia Design and Data Analysis November 7, 2013 Dan Martin 1 of 45 Harder, Better, Faster, Stronger?
  2. Introduction Analytic Methods Simulation Conditions Results Conclusion Acknowledgements Timo von

    Oertzen and the Math Psy lab Steve Boker IES Dan Martin 2 of 45 Harder, Better, Faster, Stronger?
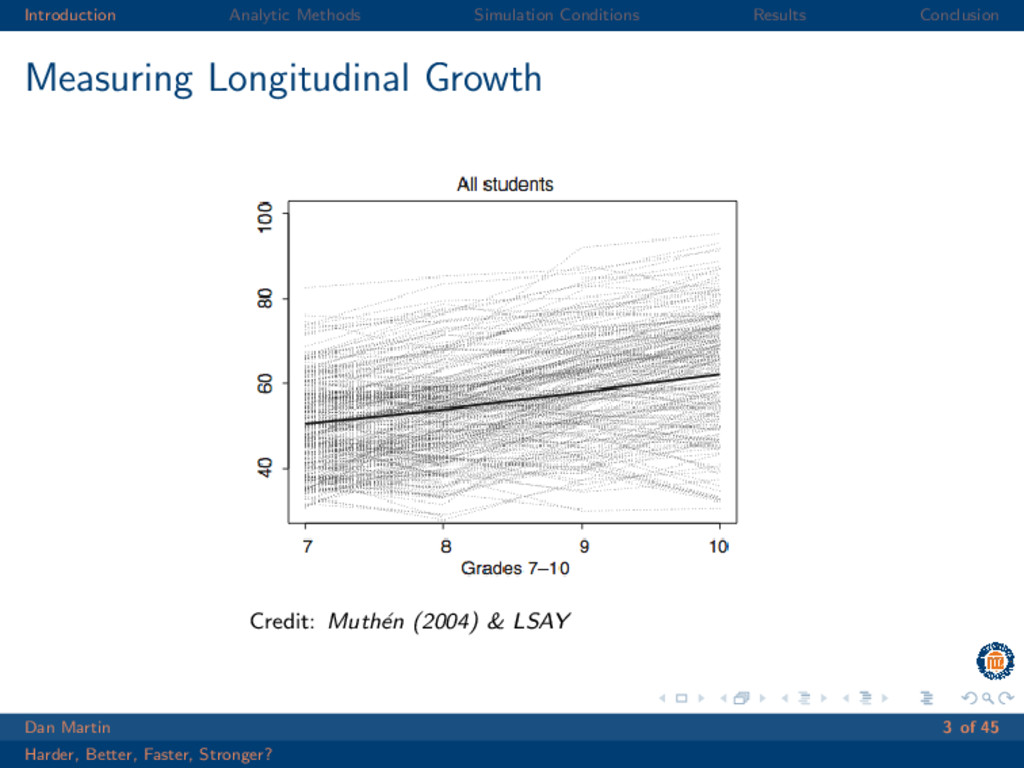
  3. Introduction Analytic Methods Simulation Conditions Results Conclusion Measuring Longitudinal Growth

    Credit: Muth´ en (2004) & LSAY Dan Martin 3 of 45 Harder, Better, Faster, Stronger?
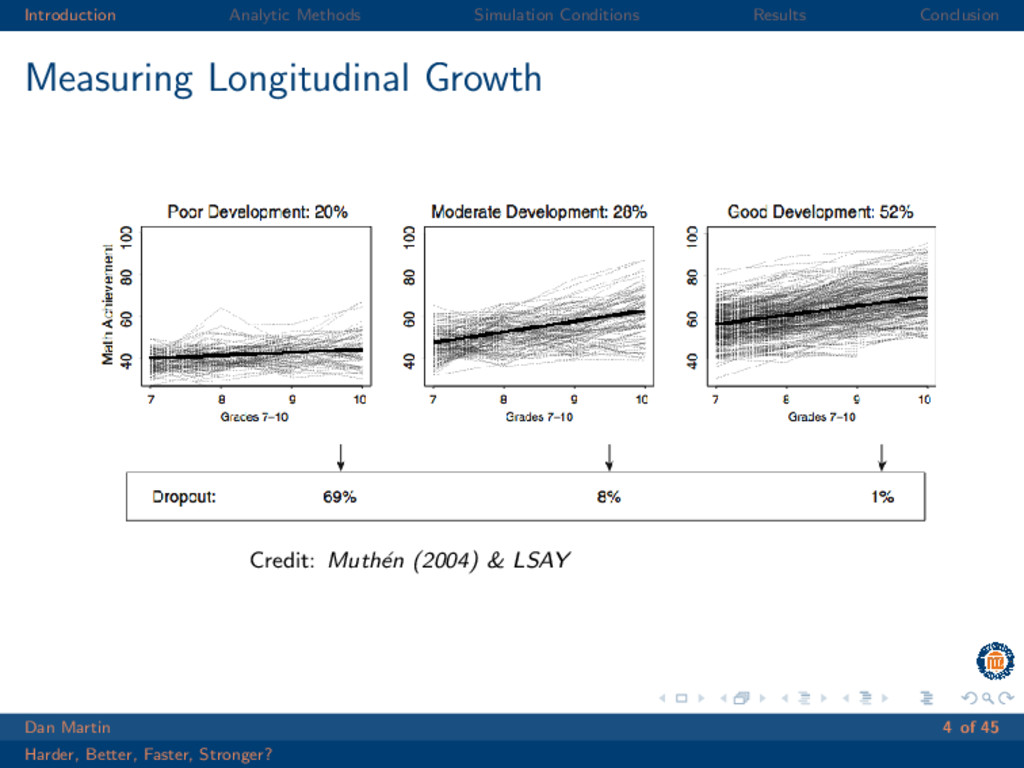
  4. Introduction Analytic Methods Simulation Conditions Results Conclusion Measuring Longitudinal Growth

    Credit: Muth´ en (2004) & LSAY Dan Martin 4 of 45 Harder, Better, Faster, Stronger?
  5. Introduction Analytic Methods Simulation Conditions Results Conclusion Using Growth Mixture

    Modeling Growth Mixture Models (GMMs) are seen in various areas of research including: Psychology (Muth´ en & Muth´ en, 2000) Sociology (Witkiewitz & Masyn, 2008) Education (Bradshaw, Buckley, & Ialongo, 2008) Popularity increase could be due to increased availability in popular statistical programs (i.e., MPlus, SAS Proc Traj) Dan Martin 5 of 45 Harder, Better, Faster, Stronger?
  6. Introduction Analytic Methods Simulation Conditions Results Conclusion Evaluating GMM Performance

    Simulation research on GMMs leave a lot to be desired Majority focused on choosing classes (Nylund et al., 2007; Peugh & Fan, 2012) Cluster misfit analyzed at the parameter level (Depaoli, 2013) “Weaker” performance for small N (Kim, 2012) Longitudinal clustering is not a recent idea (Tucker, 1966) Dan Martin 6 of 45 Harder, Better, Faster, Stronger?
  7. Introduction Analytic Methods Simulation Conditions Results Conclusion Posing a New

    Research Question Analytic methods K-Means clustering (MacQueen, 1967) Finite Mixture Modeling (Day, 1969) Growth Mixture Modeling (Muth´ en & Shedden, 1999) Which method performs best? Dan Martin 7 of 45 Harder, Better, Faster, Stronger?
  8. Introduction Analytic Methods Simulation Conditions Results Conclusion Posing a New

    Research Question Evaluation Criteria Correct cluster choice Cluster solution misfit (measured via Kullback-Leibler divergence) Dan Martin 8 of 45 Harder, Better, Faster, Stronger?
  9. Introduction Analytic Methods Simulation Conditions Results Conclusion K-Means MacQueen (1967)

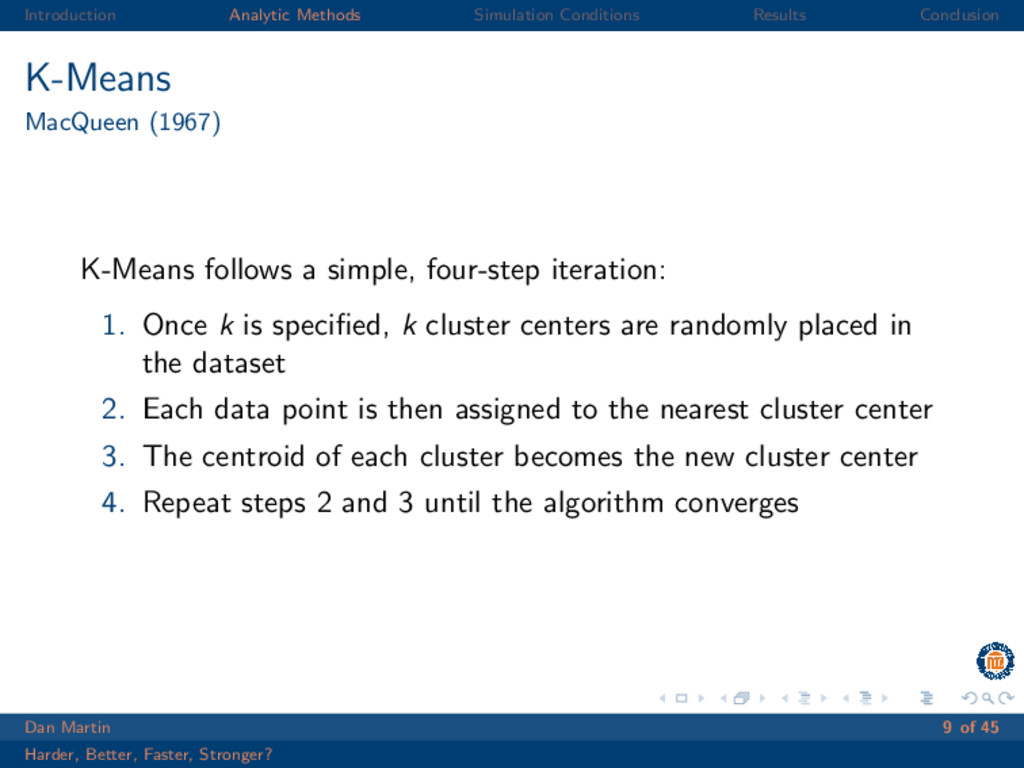
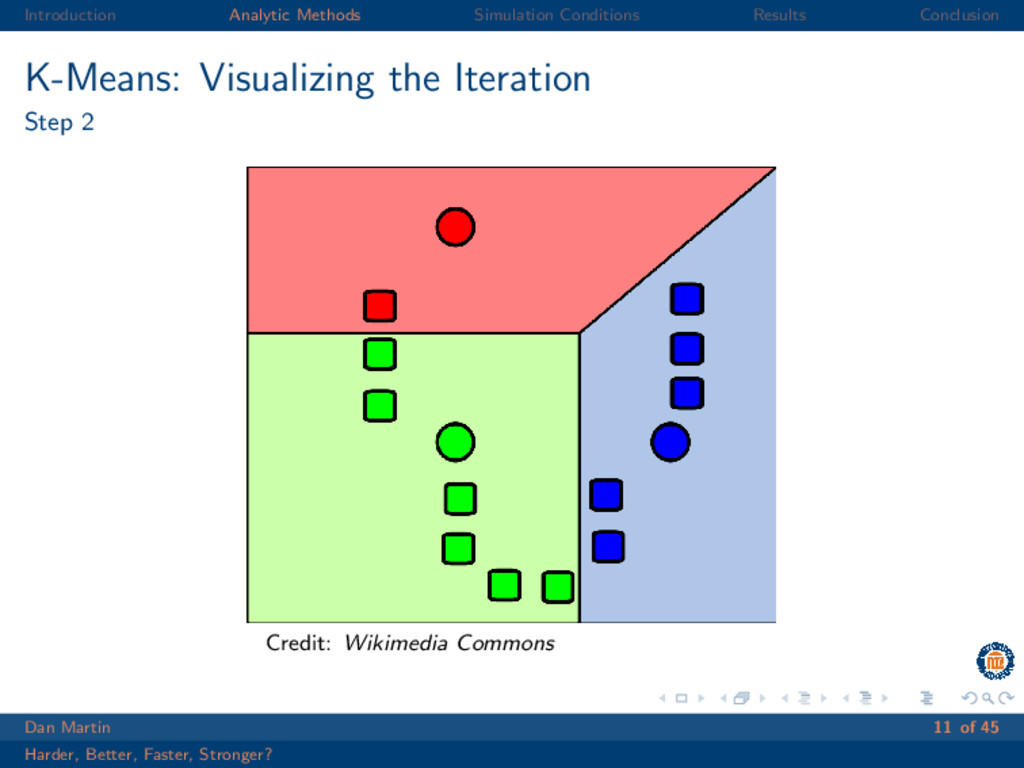
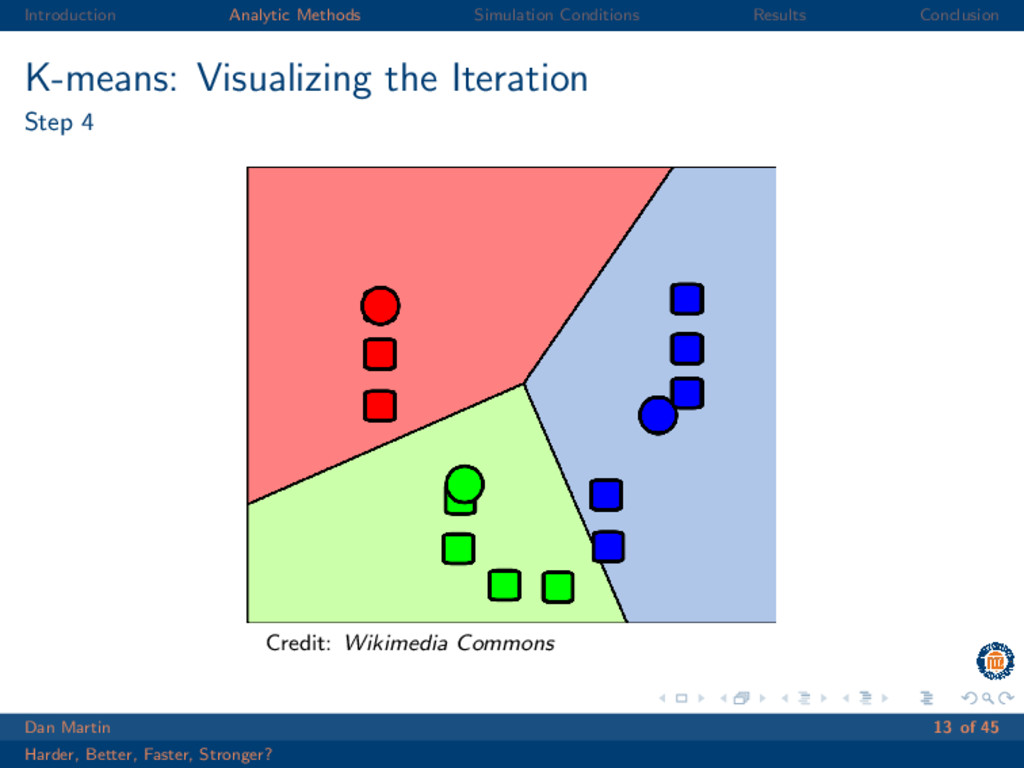
    K-Means follows a simple, four-step iteration: 1. Once k is specified, k cluster centers are randomly placed in the dataset 2. Each data point is then assigned to the nearest cluster center 3. The centroid of each cluster becomes the new cluster center 4. Repeat steps 2 and 3 until the algorithm converges Dan Martin 9 of 45 Harder, Better, Faster, Stronger?
  10. Introduction Analytic Methods Simulation Conditions Results Conclusion K-Means: Visualizing the

    Iteration Step 1 Credit: Wikimedia Commons Dan Martin 10 of 45 Harder, Better, Faster, Stronger?
  11. Introduction Analytic Methods Simulation Conditions Results Conclusion K-Means: Visualizing the

    Iteration Step 2 Credit: Wikimedia Commons Dan Martin 11 of 45 Harder, Better, Faster, Stronger?
  12. Introduction Analytic Methods Simulation Conditions Results Conclusion K-means: Visualizing the

    Iteration Step 3 Credit: Wikimedia Commons Dan Martin 12 of 45 Harder, Better, Faster, Stronger?
  13. Introduction Analytic Methods Simulation Conditions Results Conclusion K-means: Visualizing the

    Iteration Step 4 Credit: Wikimedia Commons Dan Martin 13 of 45 Harder, Better, Faster, Stronger?
  14. Introduction Analytic Methods Simulation Conditions Results Conclusion K-Means - Choosing

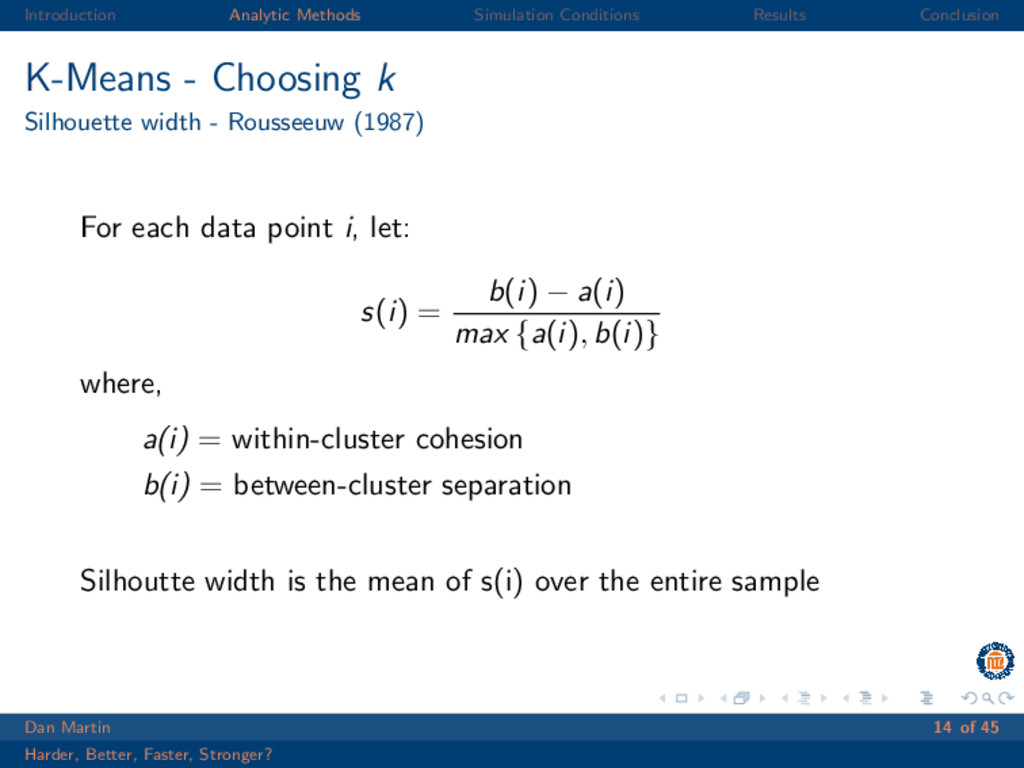
    k Silhouette width - Rousseeuw (1987) For each data point i, let: s(i) = b(i) − a(i) max {a(i), b(i)} where, a(i) = within-cluster cohesion b(i) = between-cluster separation Silhoutte width is the mean of s(i) over the entire sample Dan Martin 14 of 45 Harder, Better, Faster, Stronger?
  15. Introduction Analytic Methods Simulation Conditions Results Conclusion K-means: A summary

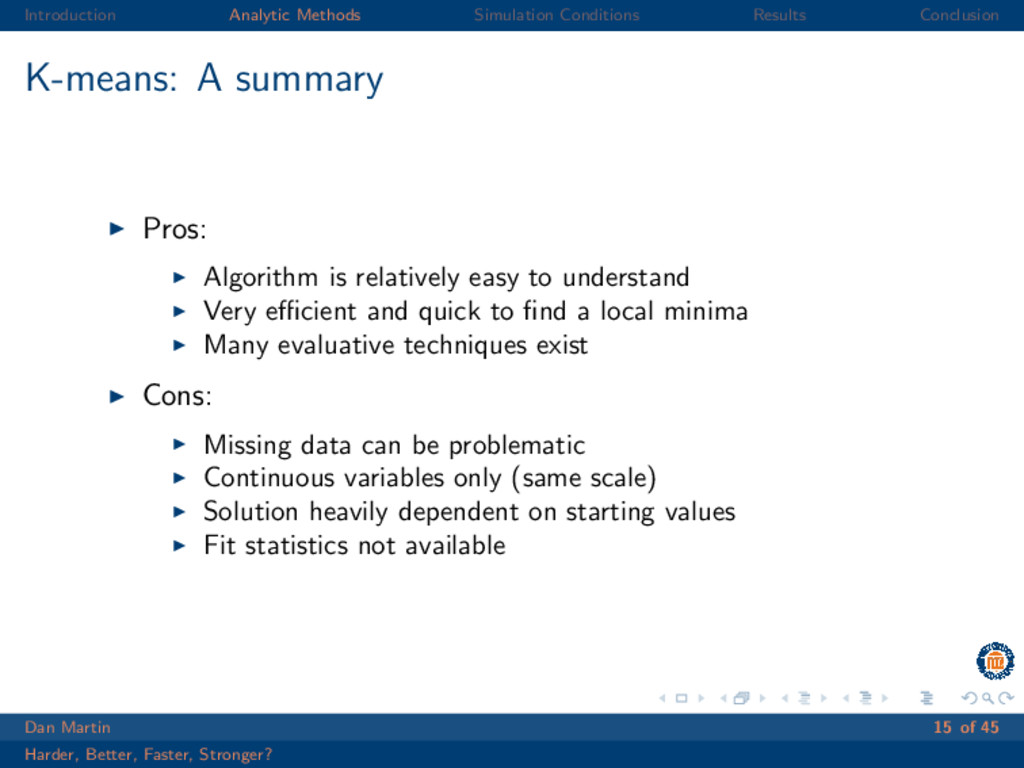
    Pros: Algorithm is relatively easy to understand Very efficient and quick to find a local minima Many evaluative techniques exist Cons: Missing data can be problematic Continuous variables only (same scale) Solution heavily dependent on starting values Fit statistics not available Dan Martin 15 of 45 Harder, Better, Faster, Stronger?
  16. Introduction Analytic Methods Simulation Conditions Results Conclusion Finite Mixture Model

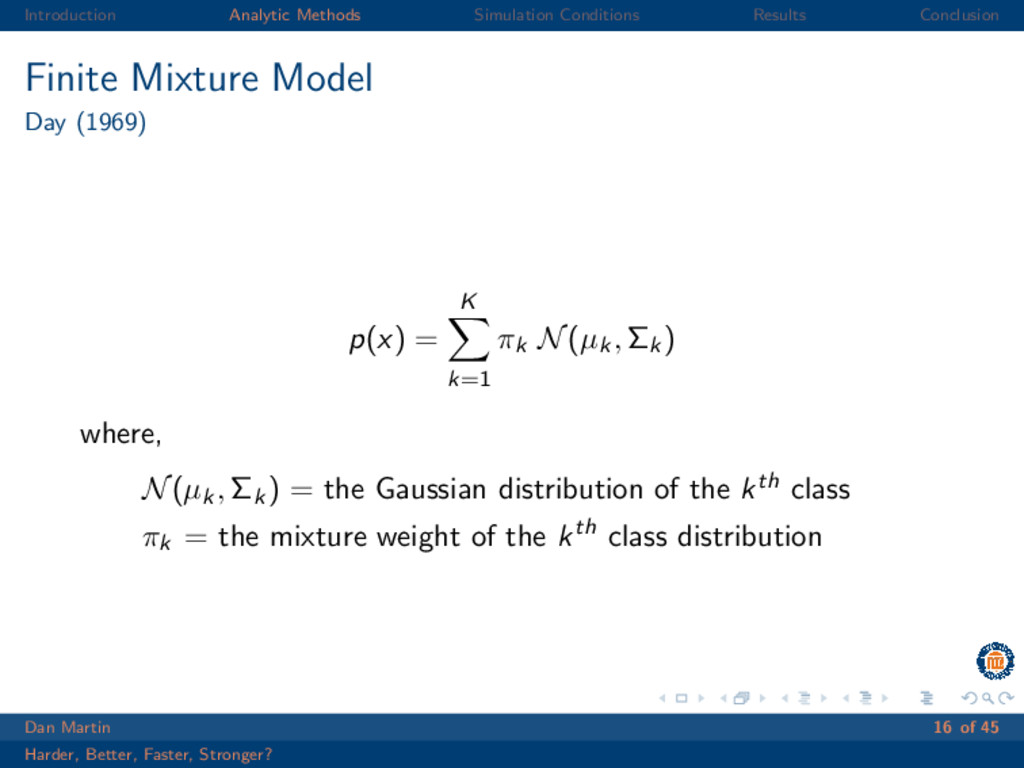
    Day (1969) p(x) = K k=1 πk N(µk, Σk) where, N(µk, Σk) = the Gaussian distribution of the kth class πk = the mixture weight of the kth class distribution Dan Martin 16 of 45 Harder, Better, Faster, Stronger?
  17. Introduction Analytic Methods Simulation Conditions Results Conclusion Finite Mixture Model

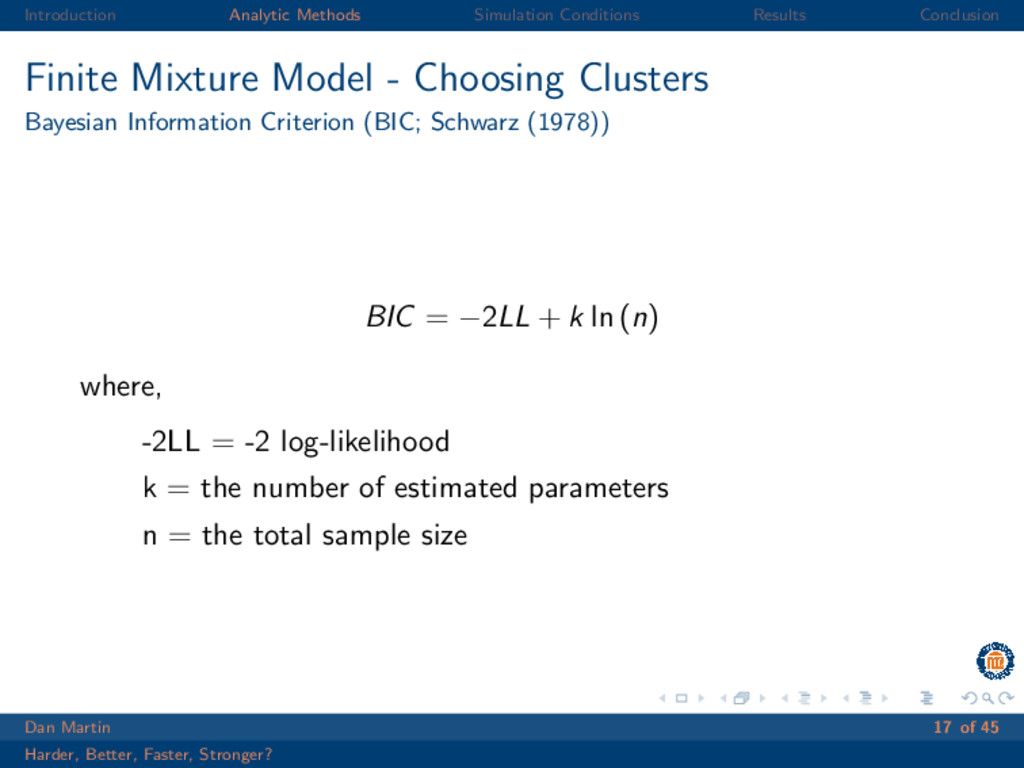
    - Choosing Clusters Bayesian Information Criterion (BIC; Schwarz (1978)) BIC = −2LL + k ln (n) where, -2LL = -2 log-likelihood k = the number of estimated parameters n = the total sample size Dan Martin 17 of 45 Harder, Better, Faster, Stronger?
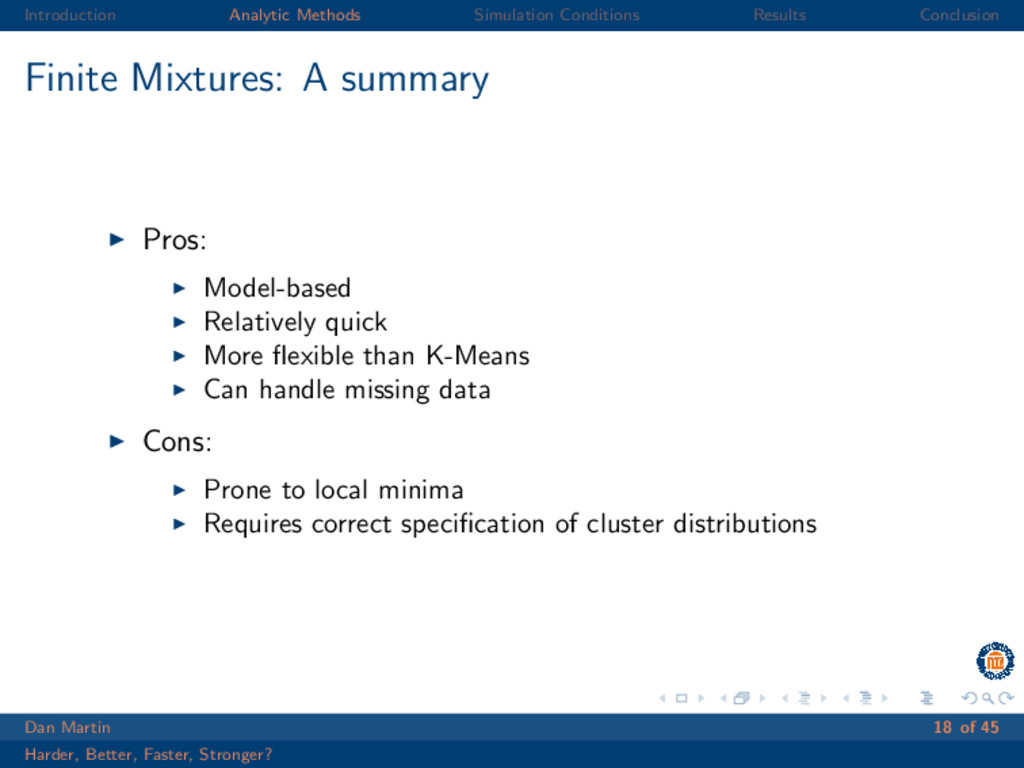
  18. Introduction Analytic Methods Simulation Conditions Results Conclusion Finite Mixtures: A

    summary Pros: Model-based Relatively quick More flexible than K-Means Can handle missing data Cons: Prone to local minima Requires correct specification of cluster distributions Dan Martin 18 of 45 Harder, Better, Faster, Stronger?
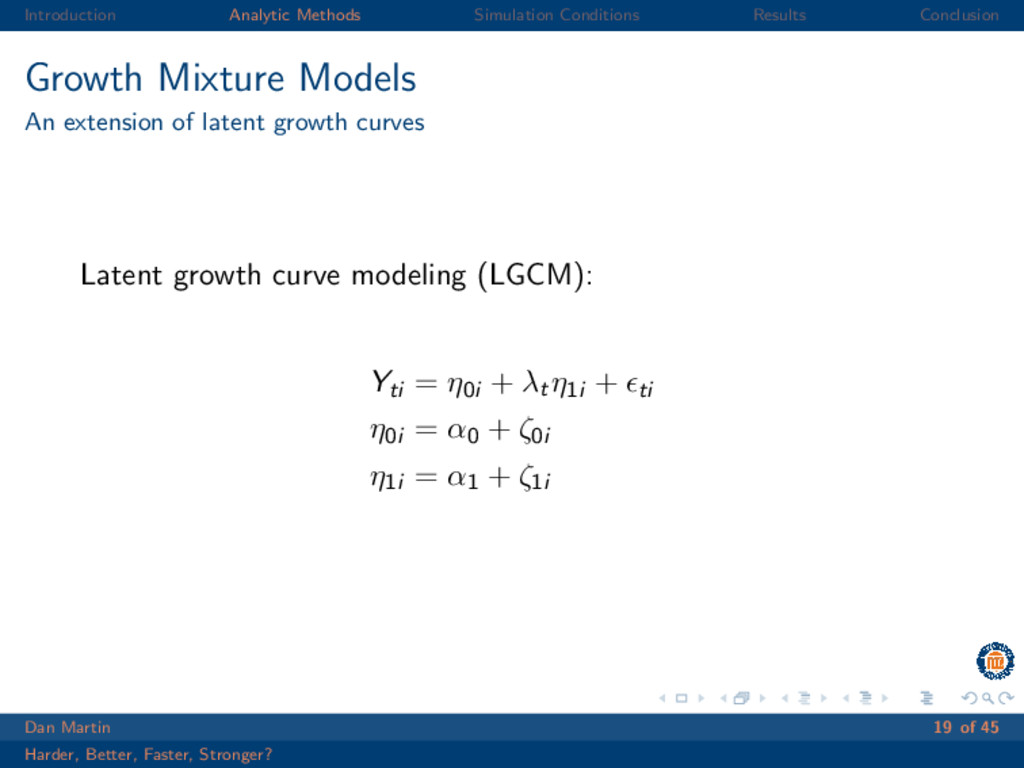
  19. Introduction Analytic Methods Simulation Conditions Results Conclusion Growth Mixture Models

    An extension of latent growth curves Latent growth curve modeling (LGCM): Yti = η0i + λtη1i + ti η0i = α0 + ζ0i η1i = α1 + ζ1i Dan Martin 19 of 45 Harder, Better, Faster, Stronger?
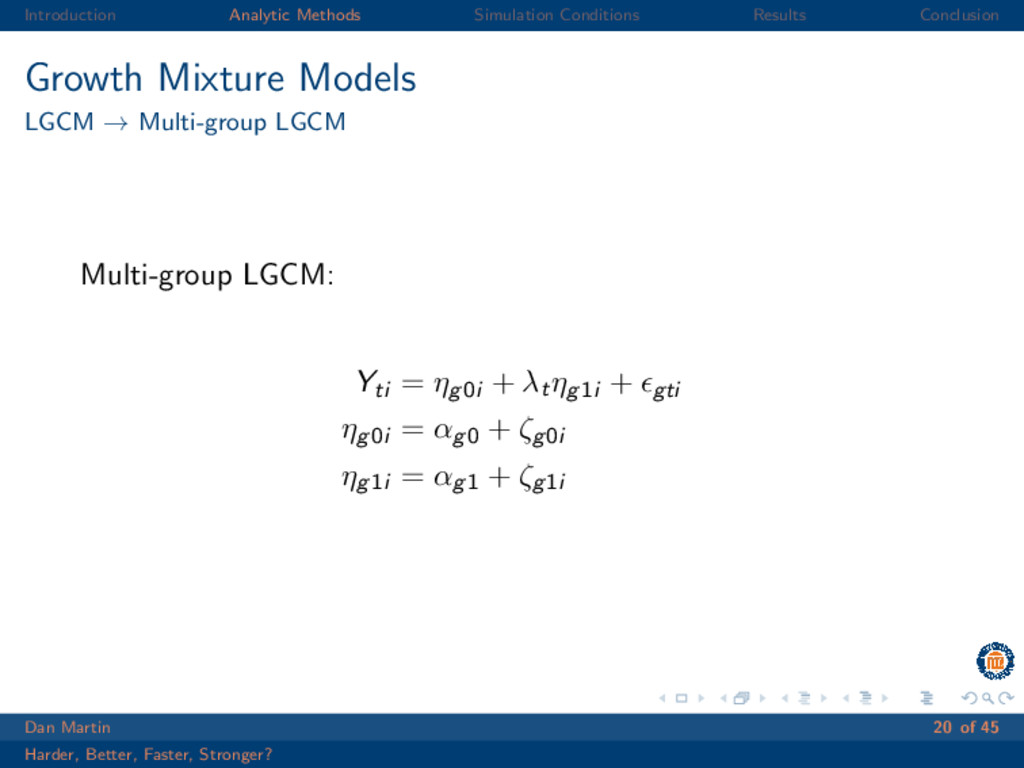
  20. Introduction Analytic Methods Simulation Conditions Results Conclusion Growth Mixture Models

    LGCM → Multi-group LGCM Multi-group LGCM: Yti = ηg0i + λtηg1i + gti ηg0i = αg0 + ζg0i ηg1i = αg1 + ζg1i Dan Martin 20 of 45 Harder, Better, Faster, Stronger?
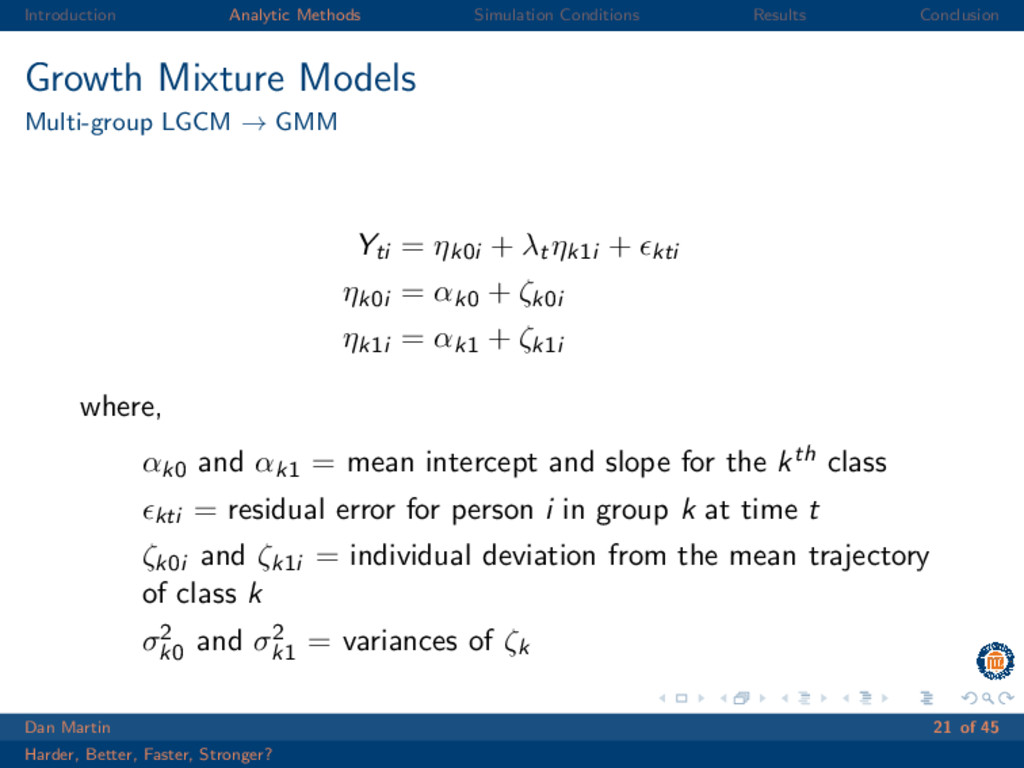
  21. Introduction Analytic Methods Simulation Conditions Results Conclusion Growth Mixture Models

    Multi-group LGCM → GMM Yti = ηk0i + λtηk1i + kti ηk0i = αk0 + ζk0i ηk1i = αk1 + ζk1i where, αk0 and αk1 = mean intercept and slope for the kth class kti = residual error for person i in group k at time t ζk0i and ζk1i = individual deviation from the mean trajectory of class k σ2 k0 and σ2 k1 = variances of ζk Dan Martin 21 of 45 Harder, Better, Faster, Stronger?
  22. Introduction Analytic Methods Simulation Conditions Results Conclusion Growth Mixture Model

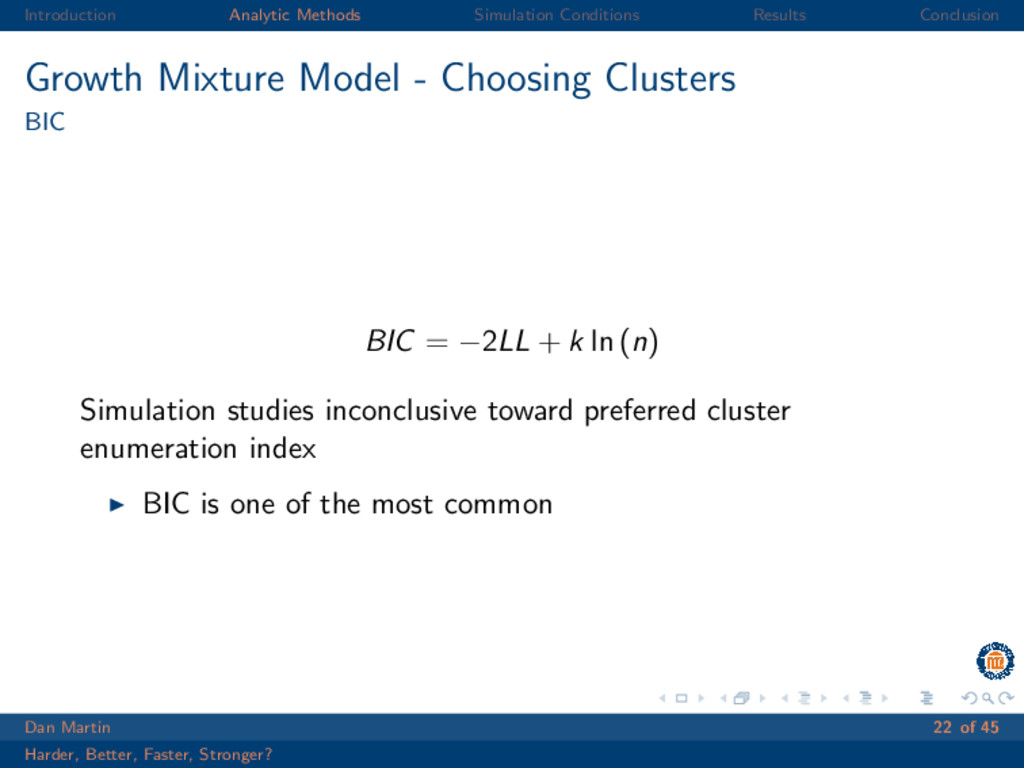
    - Choosing Clusters BIC BIC = −2LL + k ln (n) Simulation studies inconclusive toward preferred cluster enumeration index BIC is one of the most common Dan Martin 22 of 45 Harder, Better, Faster, Stronger?
  23. Introduction Analytic Methods Simulation Conditions Results Conclusion GMMs: A summary

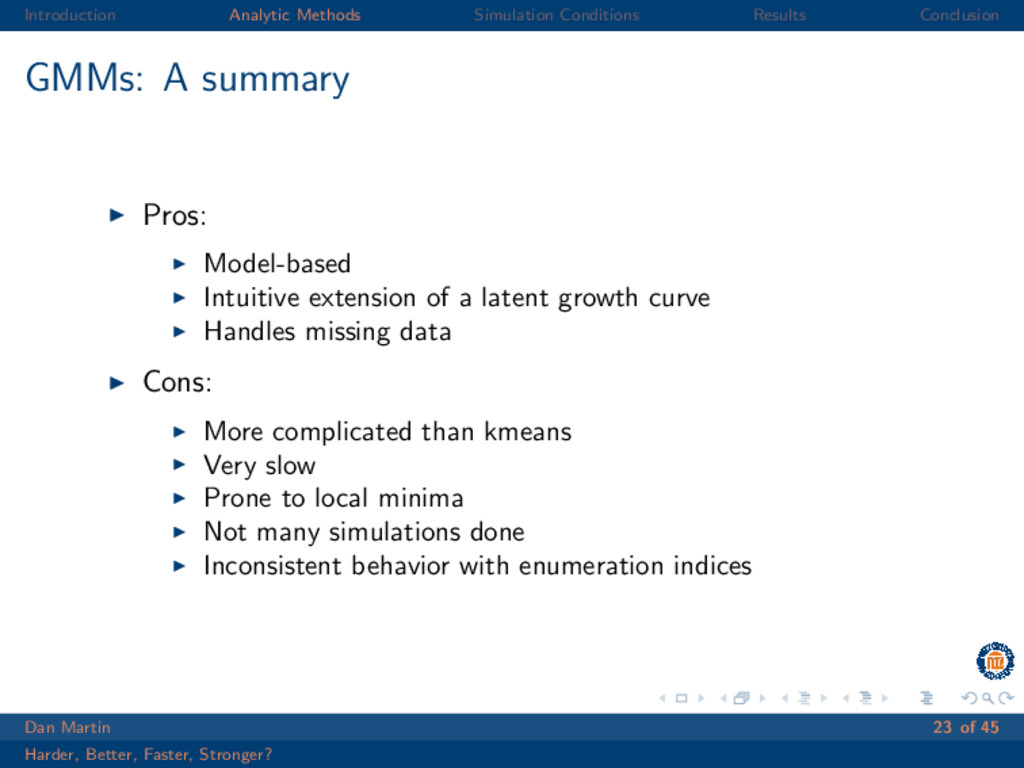
    Pros: Model-based Intuitive extension of a latent growth curve Handles missing data Cons: More complicated than kmeans Very slow Prone to local minima Not many simulations done Inconsistent behavior with enumeration indices Dan Martin 23 of 45 Harder, Better, Faster, Stronger?
  24. Introduction Analytic Methods Simulation Conditions Results Conclusion Simulation Conditions An

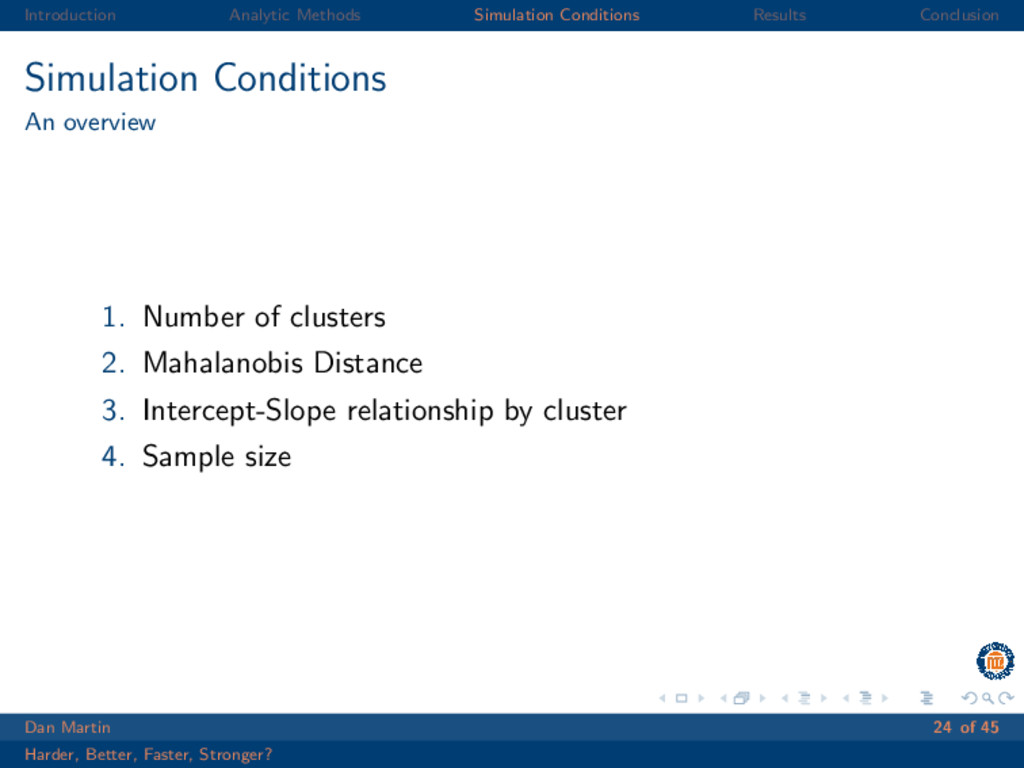
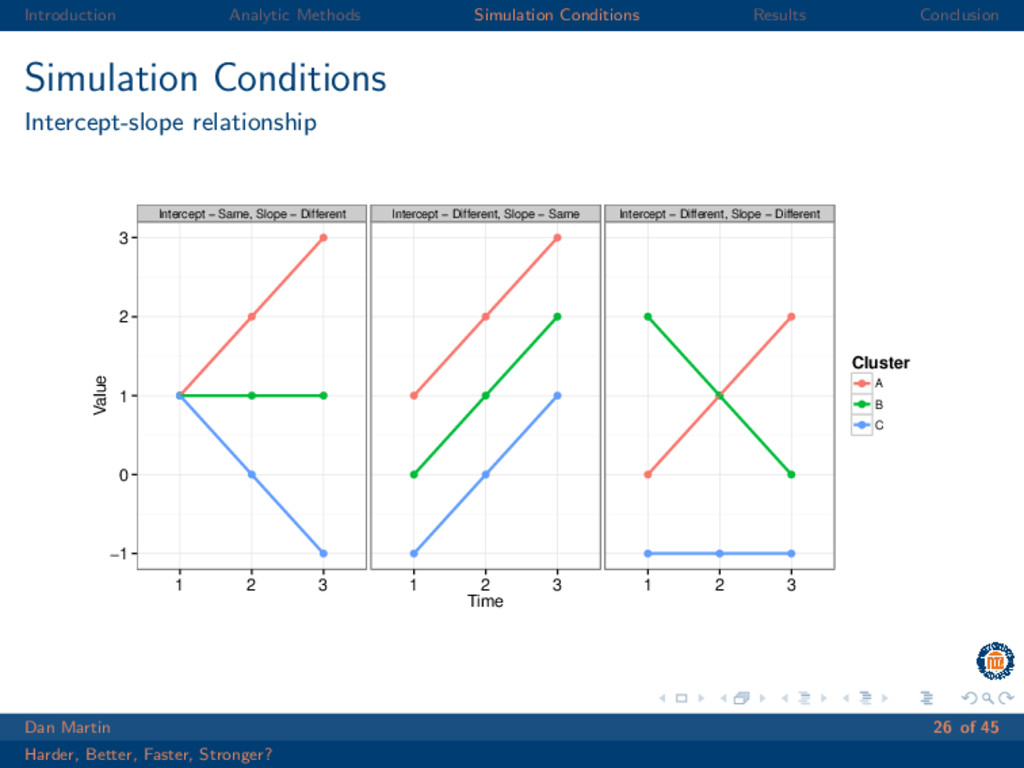
    overview 1. Number of clusters 2. Mahalanobis Distance 3. Intercept-Slope relationship by cluster 4. Sample size Dan Martin 24 of 45 Harder, Better, Faster, Stronger?
  25. Introduction Analytic Methods Simulation Conditions Results Conclusion Simulation Conditions Mahalanobis

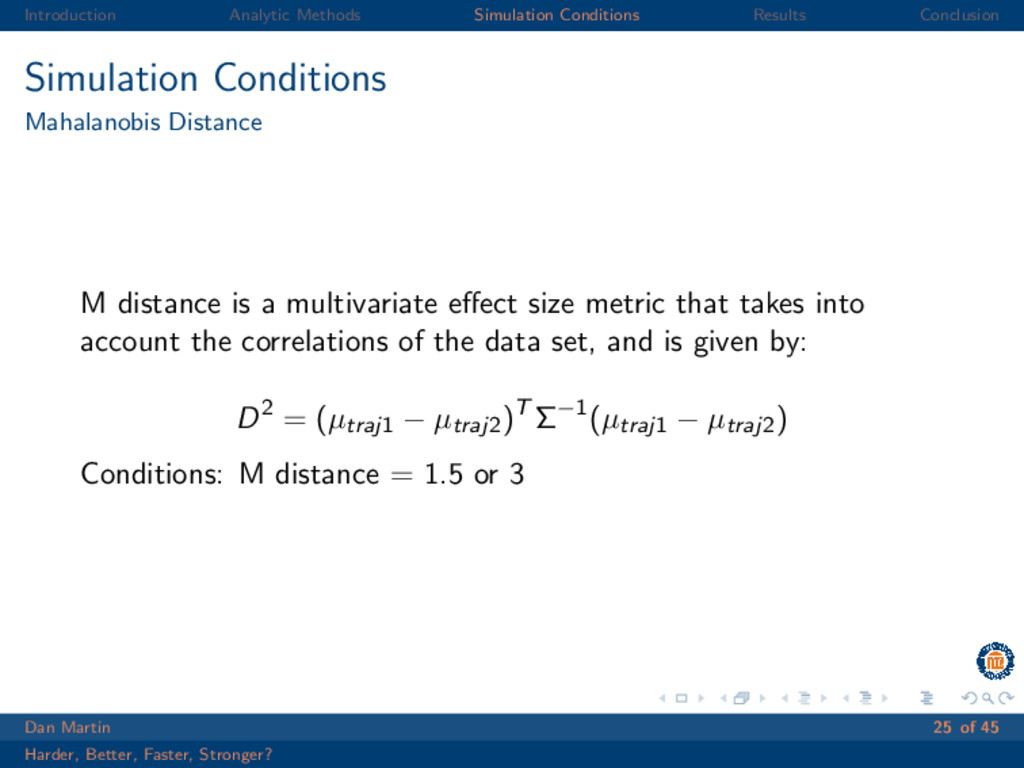
    Distance M distance is a multivariate effect size metric that takes into account the correlations of the data set, and is given by: D2 = (µtraj1 − µtraj2)T Σ−1(µtraj1 − µtraj2) Conditions: M distance = 1.5 or 3 Dan Martin 25 of 45 Harder, Better, Faster, Stronger?
  26. Introduction Analytic Methods Simulation Conditions Results Conclusion Simulation Conditions Intercept-slope

    relationship Intercept − Same, Slope − Different Intercept − Different, Slope − Same Intercept − Different, Slope − Different −1 0 1 2 3 1 2 3 1 2 3 1 2 3 Time Value Cluster A B C Dan Martin 26 of 45 Harder, Better, Faster, Stronger?
  27. Introduction Analytic Methods Simulation Conditions Results Conclusion Simulation: Conditions 1.

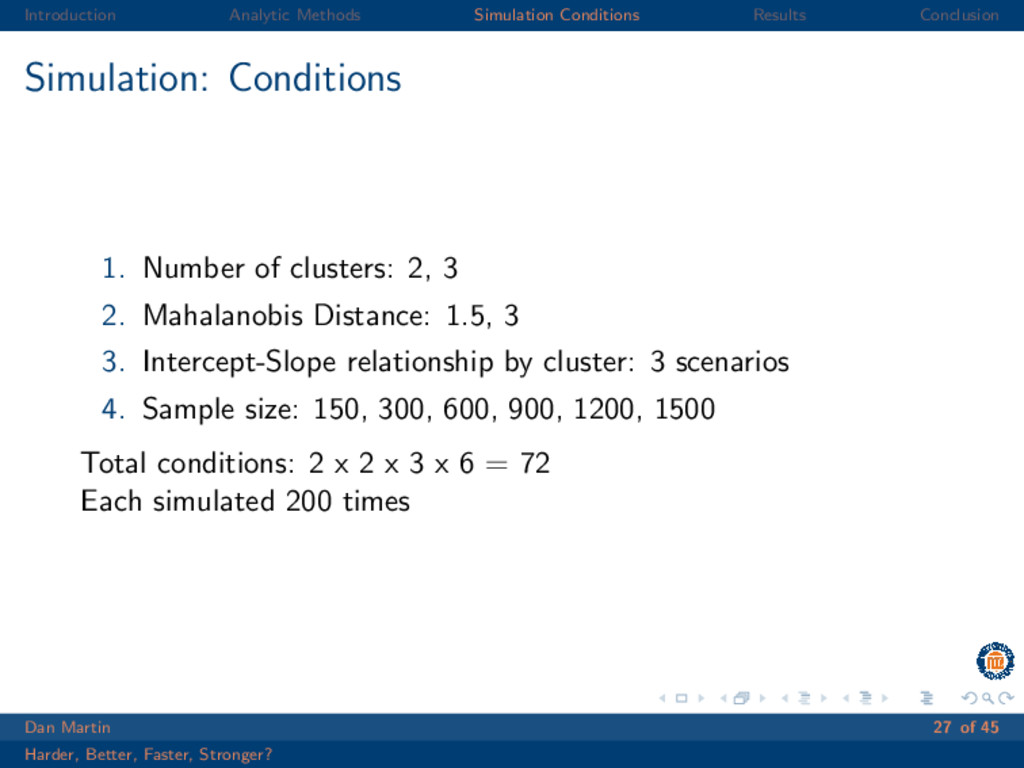
    Number of clusters: 2, 3 2. Mahalanobis Distance: 1.5, 3 3. Intercept-Slope relationship by cluster: 3 scenarios 4. Sample size: 150, 300, 600, 900, 1200, 1500 Total conditions: 2 x 2 x 3 x 6 = 72 Each simulated 200 times Dan Martin 27 of 45 Harder, Better, Faster, Stronger?
  28. Introduction Analytic Methods Simulation Conditions Results Conclusion Evaluation Criteria 1.

    Correct cluster choice 2. Cluster solution misfit (measured via Kullback-Leibler divergence) Dan Martin 28 of 45 Harder, Better, Faster, Stronger?
  29. Introduction Analytic Methods Simulation Conditions Results Conclusion Kullback-Leibler Divergence For

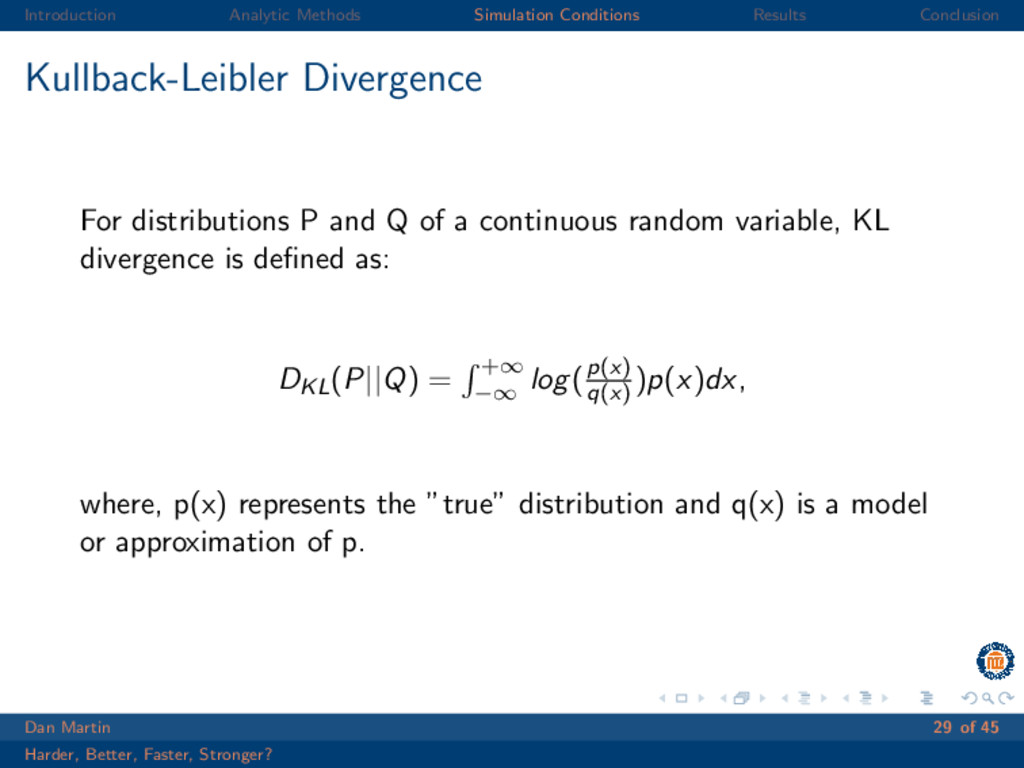
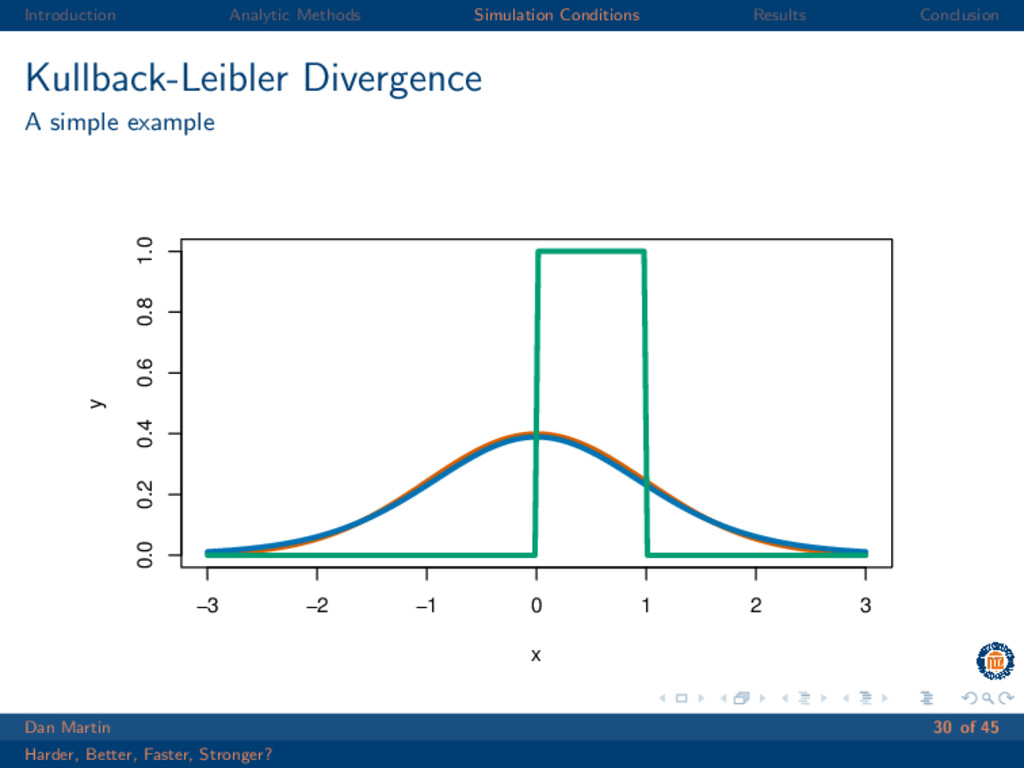
    distributions P and Q of a continuous random variable, KL divergence is defined as: DKL(P||Q) = +∞ −∞ log(p(x) q(x) )p(x)dx, where, p(x) represents the ”true” distribution and q(x) is a model or approximation of p. Dan Martin 29 of 45 Harder, Better, Faster, Stronger?
  30. Introduction Analytic Methods Simulation Conditions Results Conclusion Kullback-Leibler Divergence A

    simple example −3 −2 −1 0 1 2 3 0.0 0.2 0.4 0.6 0.8 1.0 x y Dan Martin 30 of 45 Harder, Better, Faster, Stronger?
  31. Introduction Analytic Methods Simulation Conditions Results Conclusion Kullback-Leibler Divergence A

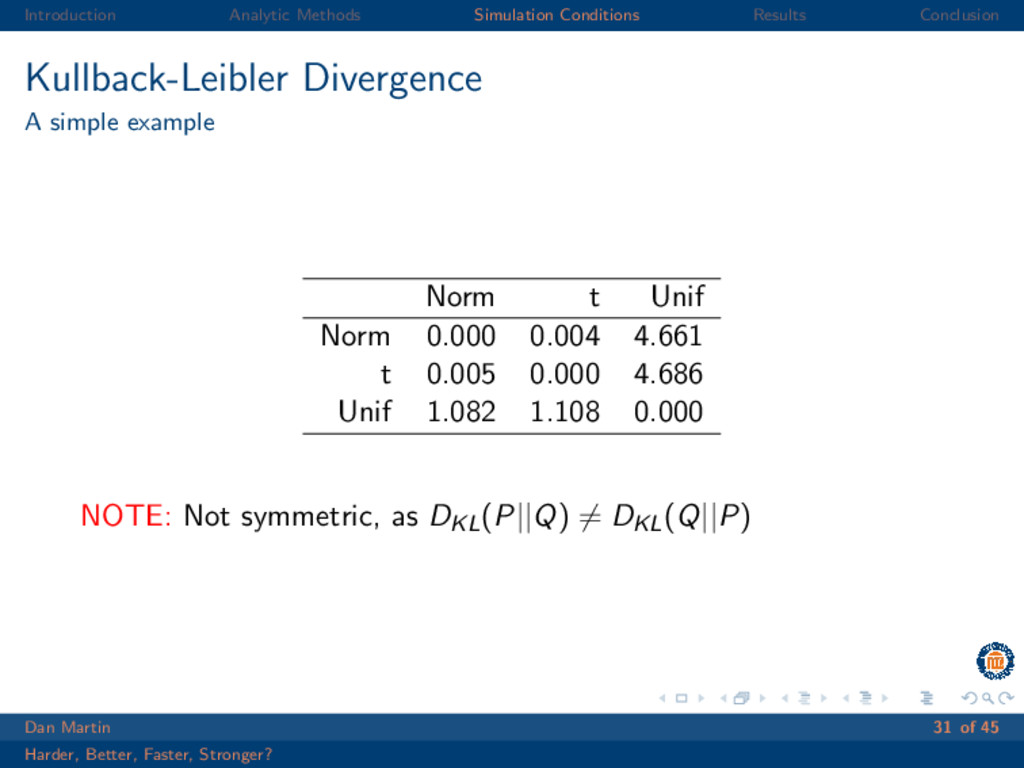
    simple example Norm t Unif Norm 0.000 0.004 4.661 t 0.005 0.000 4.686 Unif 1.082 1.108 0.000 NOTE: Not symmetric, as DKL(P||Q) = DKL(Q||P) Dan Martin 31 of 45 Harder, Better, Faster, Stronger?
  32. Introduction Analytic Methods Simulation Conditions Results Conclusion Kullback-Leibler Divergence The

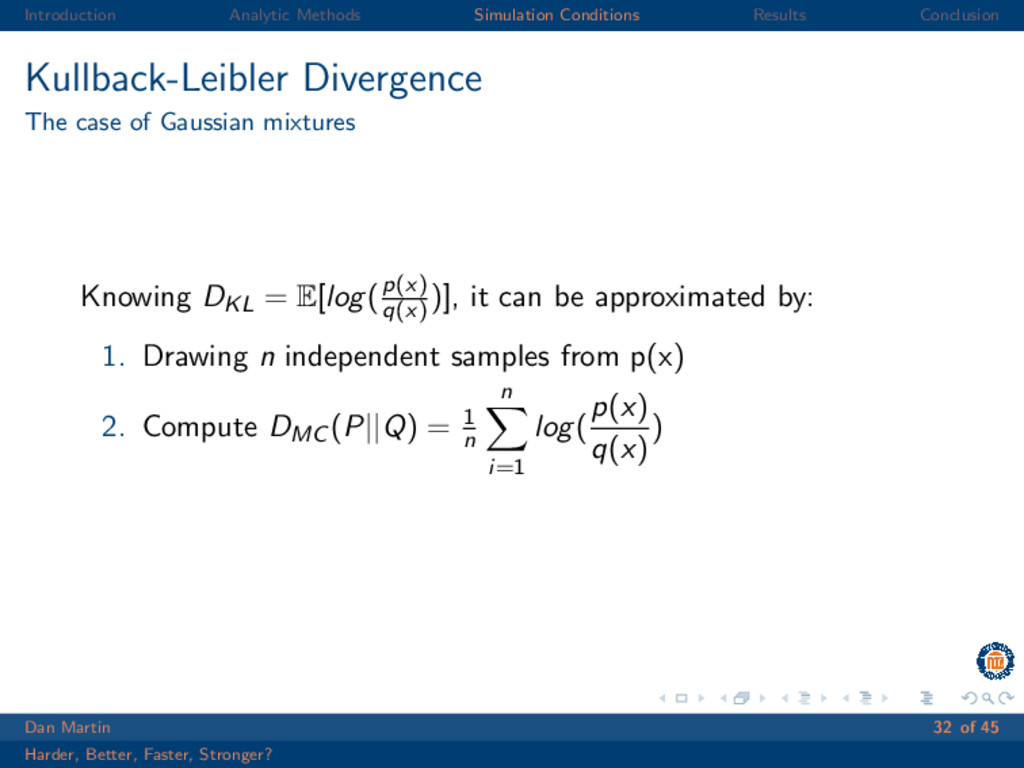
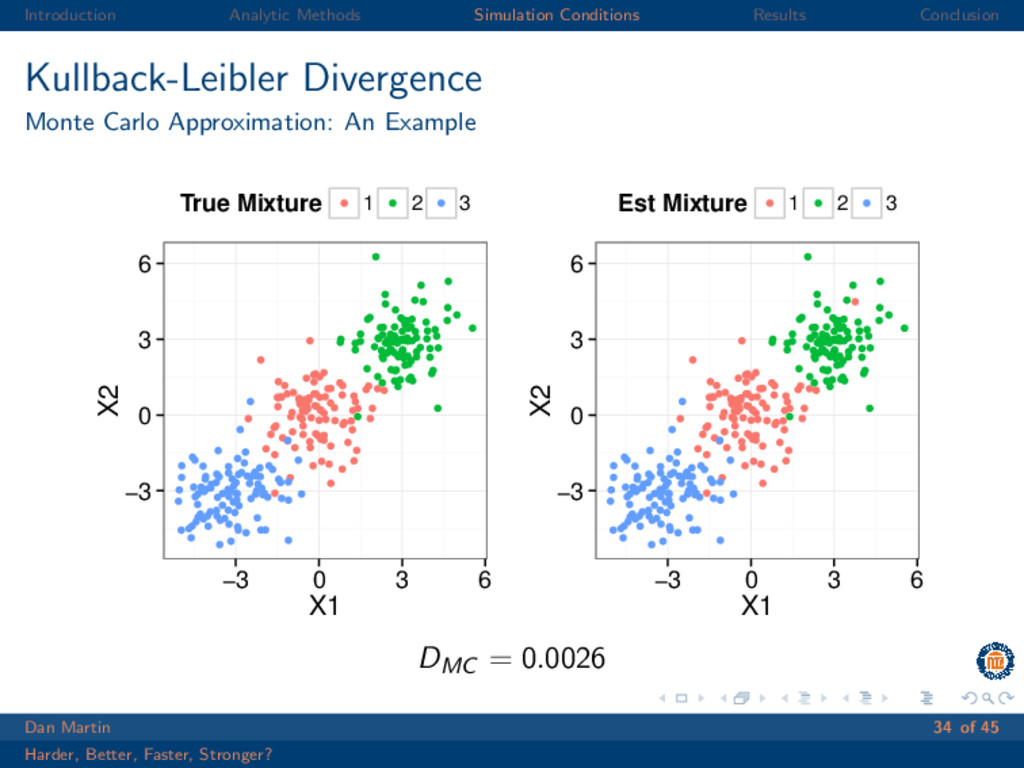
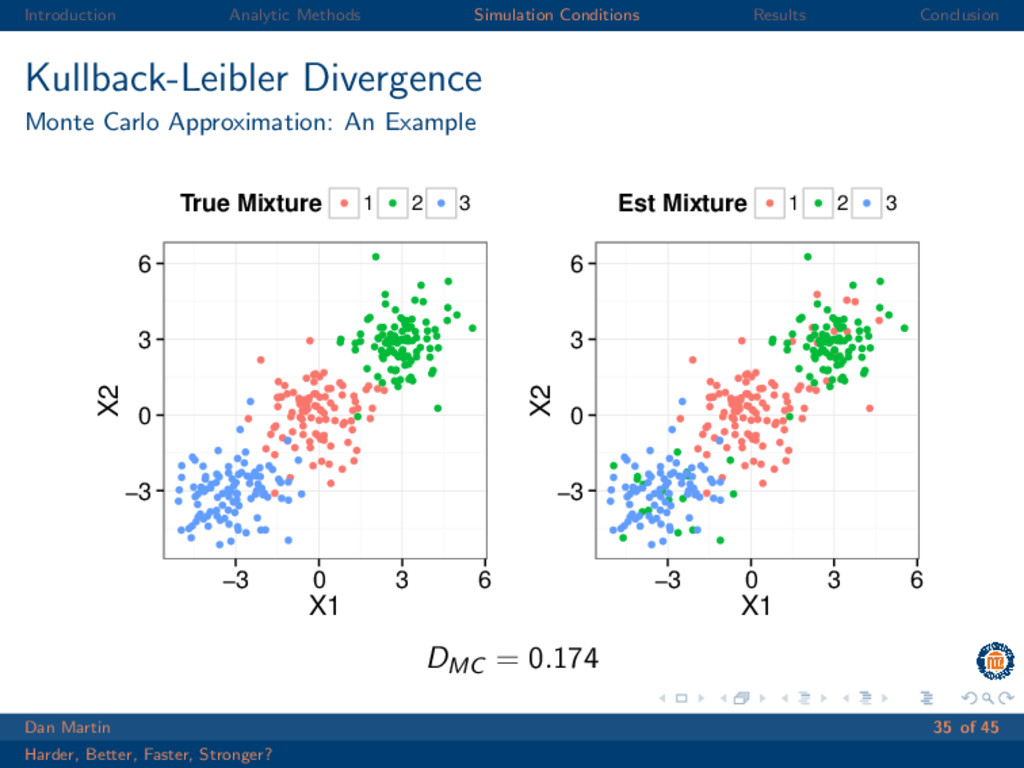
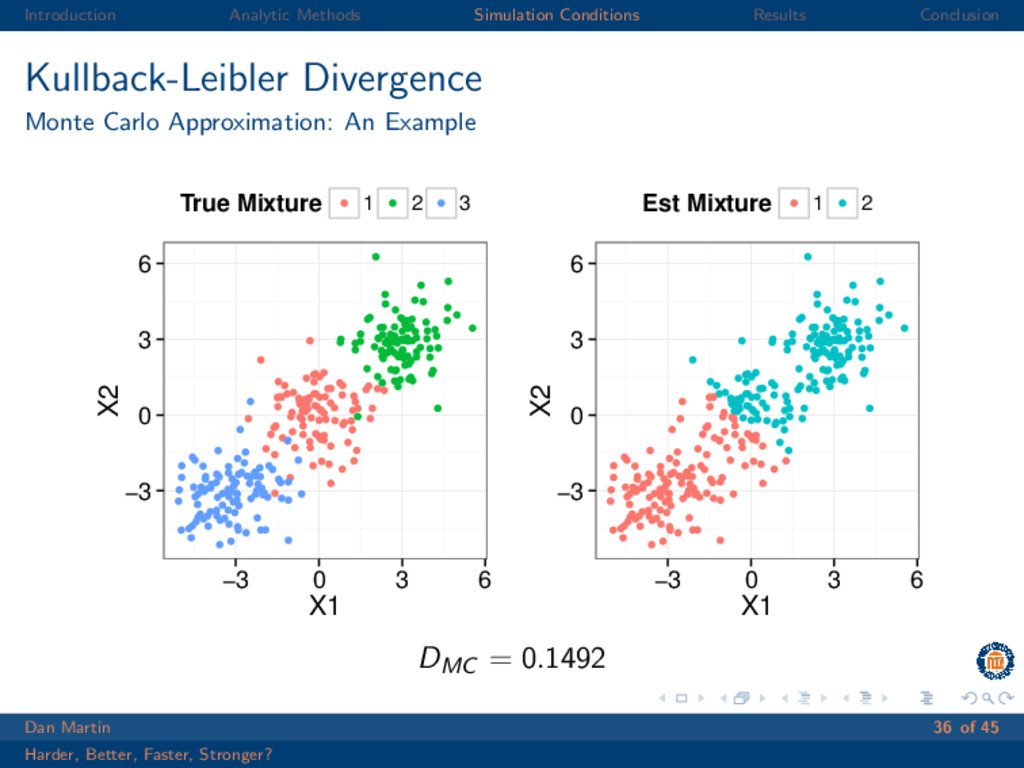
    case of Gaussian mixtures Knowing DKL = E[log(p(x) q(x) )], it can be approximated by: 1. Drawing n independent samples from p(x) 2. Compute DMC (P||Q) = 1 n n i=1 log( p(x) q(x) ) Dan Martin 32 of 45 Harder, Better, Faster, Stronger?
  33. Introduction Analytic Methods Simulation Conditions Results Conclusion Kullback-Leibler Divergence Monte

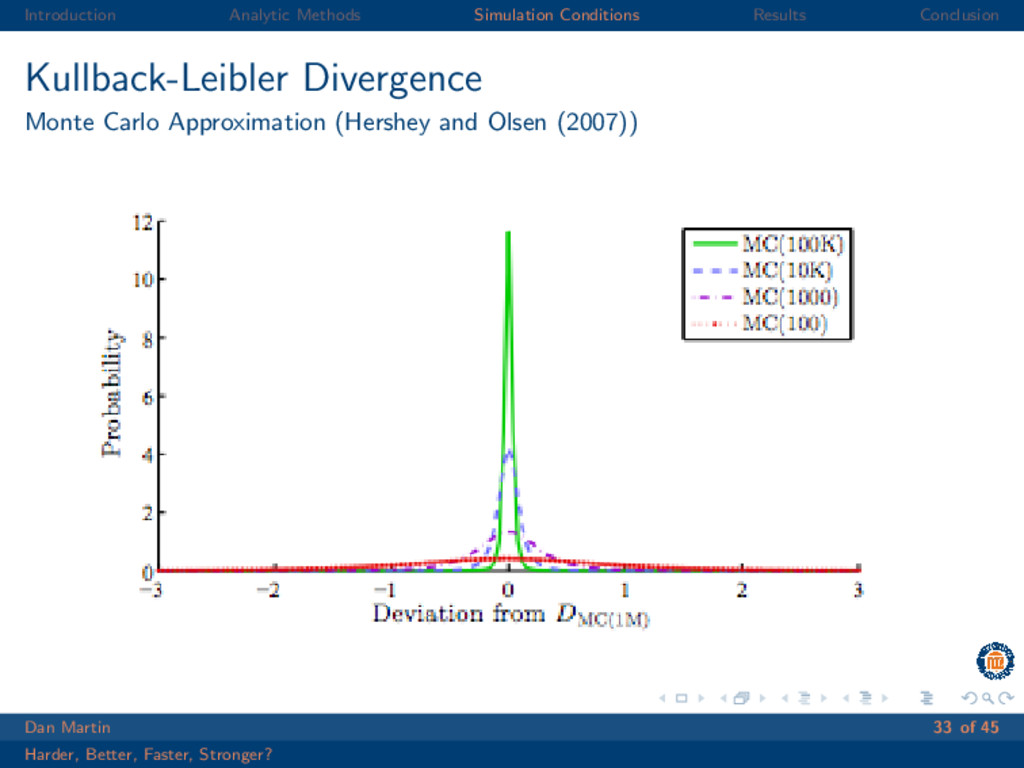
    Carlo Approximation (Hershey and Olsen (2007)) Dan Martin 33 of 45 Harder, Better, Faster, Stronger?
  34. Introduction Analytic Methods Simulation Conditions Results Conclusion Kullback-Leibler Divergence Monte

    Carlo Approximation: An Example −3 0 3 6 −3 0 3 6 X1 X2 True Mixture 1 2 3 −3 0 3 6 −3 0 3 6 X1 X2 Est Mixture 1 2 3 DMC = 0.0026 Dan Martin 34 of 45 Harder, Better, Faster, Stronger?
  35. Introduction Analytic Methods Simulation Conditions Results Conclusion Kullback-Leibler Divergence Monte

    Carlo Approximation: An Example −3 0 3 6 −3 0 3 6 X1 X2 True Mixture 1 2 3 −3 0 3 6 −3 0 3 6 X1 X2 Est Mixture 1 2 3 DMC = 0.174 Dan Martin 35 of 45 Harder, Better, Faster, Stronger?
  36. Introduction Analytic Methods Simulation Conditions Results Conclusion Kullback-Leibler Divergence Monte

    Carlo Approximation: An Example −3 0 3 6 −3 0 3 6 X1 X2 True Mixture 1 2 3 −3 0 3 6 −3 0 3 6 X1 X2 Est Mixture 1 2 DMC = 0.1492 Dan Martin 36 of 45 Harder, Better, Faster, Stronger?
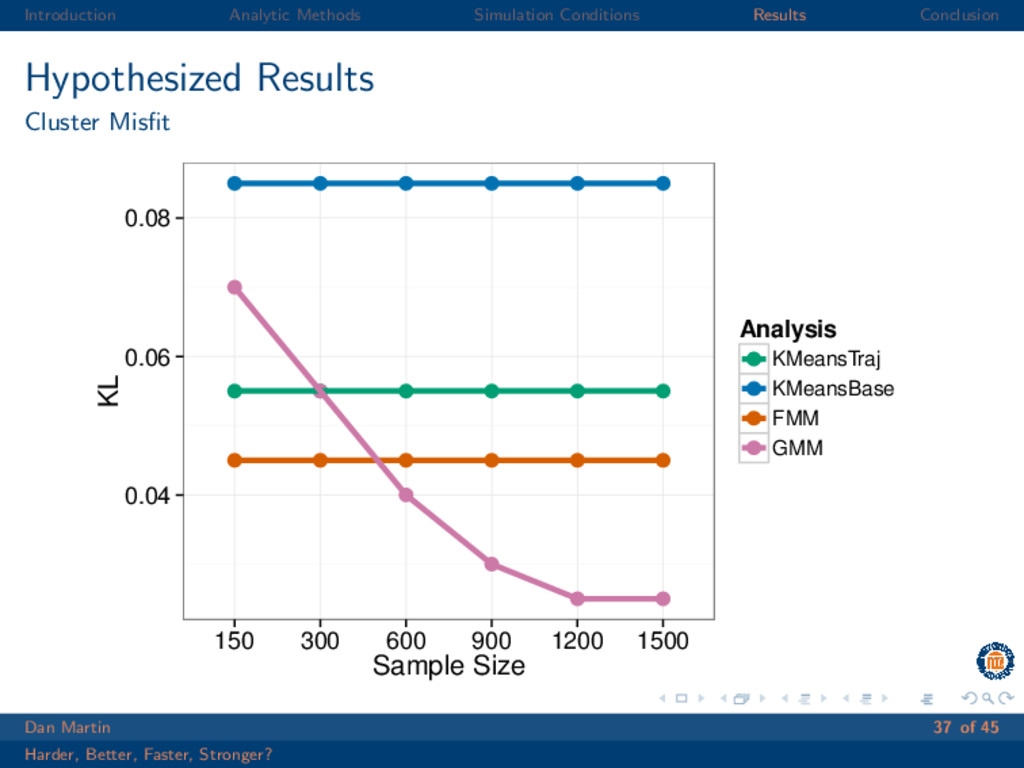
  37. Introduction Analytic Methods Simulation Conditions Results Conclusion Hypothesized Results Cluster

    Misfit 0.04 0.06 0.08 150 300 600 900 1200 1500 Sample Size KL Analysis KMeansTraj KMeansBase FMM GMM Dan Martin 37 of 45 Harder, Better, Faster, Stronger?
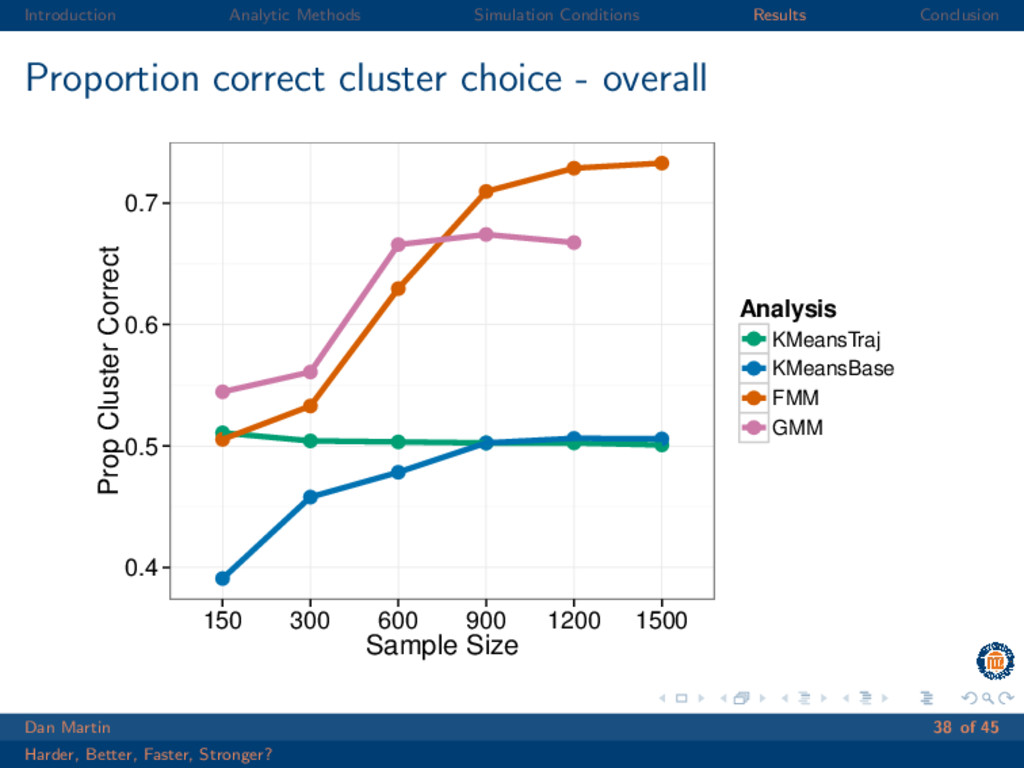
  38. Introduction Analytic Methods Simulation Conditions Results Conclusion Proportion correct cluster

    choice - overall 0.4 0.5 0.6 0.7 150 300 600 900 1200 1500 Sample Size Prop Cluster Correct Analysis KMeansTraj KMeansBase FMM GMM Dan Martin 38 of 45 Harder, Better, Faster, Stronger?
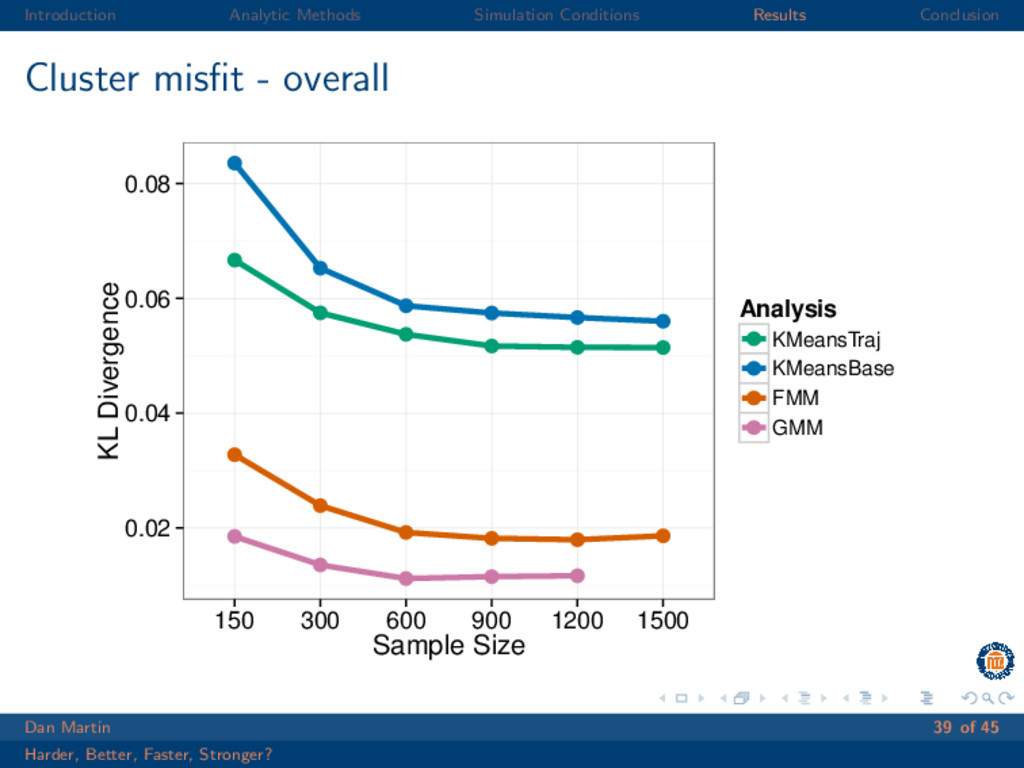
  39. Introduction Analytic Methods Simulation Conditions Results Conclusion Cluster misfit -

    overall 0.02 0.04 0.06 0.08 150 300 600 900 1200 1500 Sample Size KL Divergence Analysis KMeansTraj KMeansBase FMM GMM Dan Martin 39 of 45 Harder, Better, Faster, Stronger?
  40. Introduction Analytic Methods Simulation Conditions Results Conclusion Proportion correct cluster

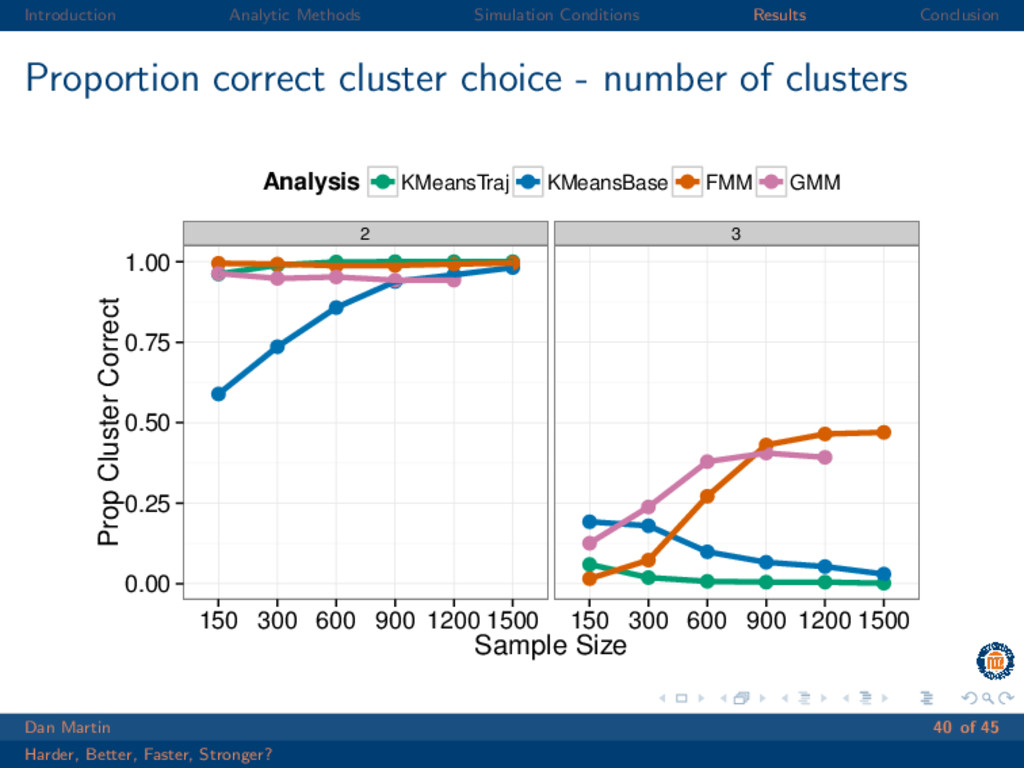
    choice - number of clusters 2 3 0.00 0.25 0.50 0.75 1.00 150 300 600 900 1200 1500 150 300 600 900 1200 1500 Sample Size Prop Cluster Correct Analysis KMeansTraj KMeansBase FMM GMM Dan Martin 40 of 45 Harder, Better, Faster, Stronger?
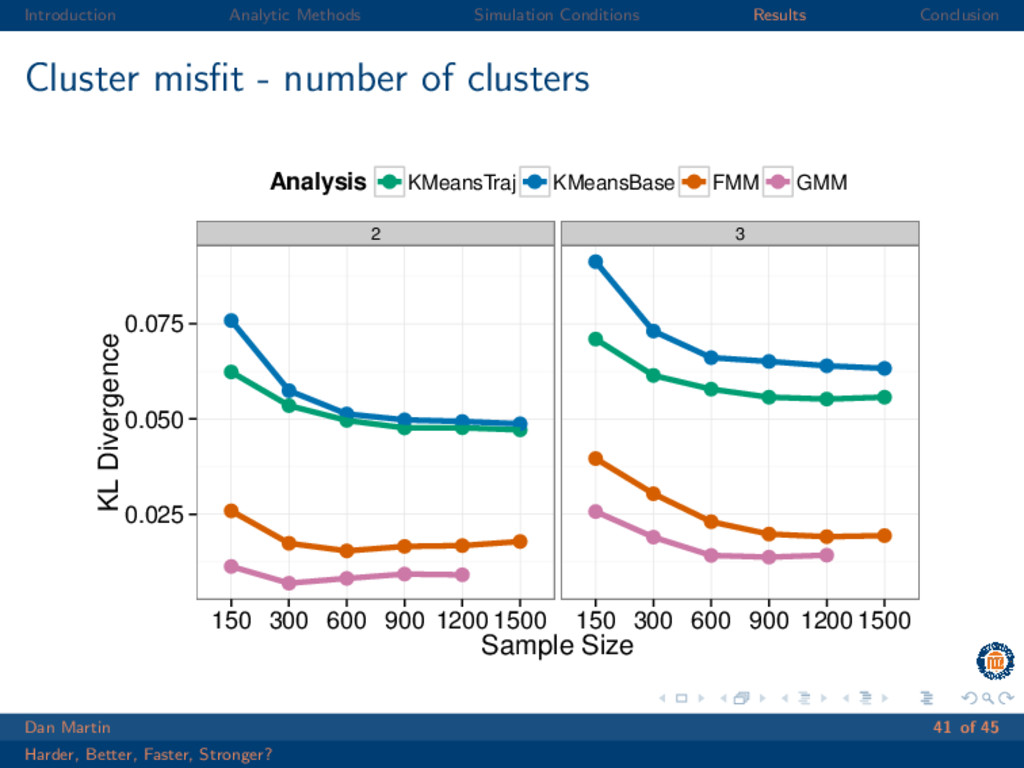
  41. Introduction Analytic Methods Simulation Conditions Results Conclusion Cluster misfit -

    number of clusters 2 3 0.025 0.050 0.075 150 300 600 900 1200 1500 150 300 600 900 1200 1500 Sample Size KL Divergence Analysis KMeansTraj KMeansBase FMM GMM Dan Martin 41 of 45 Harder, Better, Faster, Stronger?
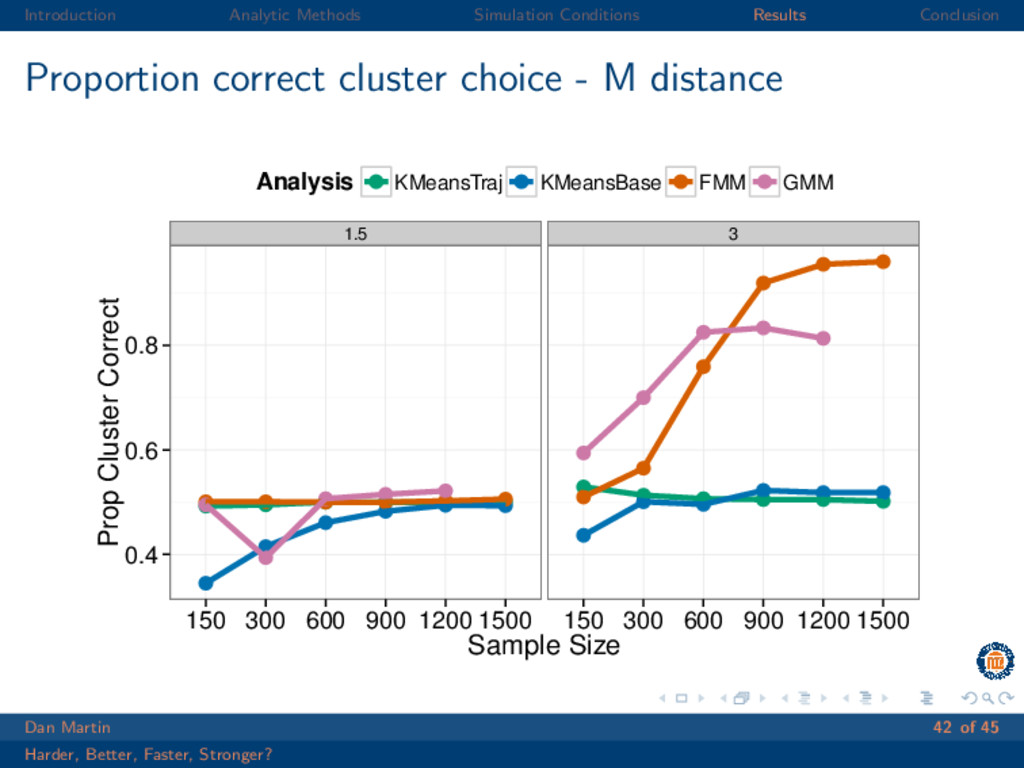
  42. Introduction Analytic Methods Simulation Conditions Results Conclusion Proportion correct cluster

    choice - M distance 1.5 3 0.4 0.6 0.8 150 300 600 900 1200 1500 150 300 600 900 1200 1500 Sample Size Prop Cluster Correct Analysis KMeansTraj KMeansBase FMM GMM Dan Martin 42 of 45 Harder, Better, Faster, Stronger?
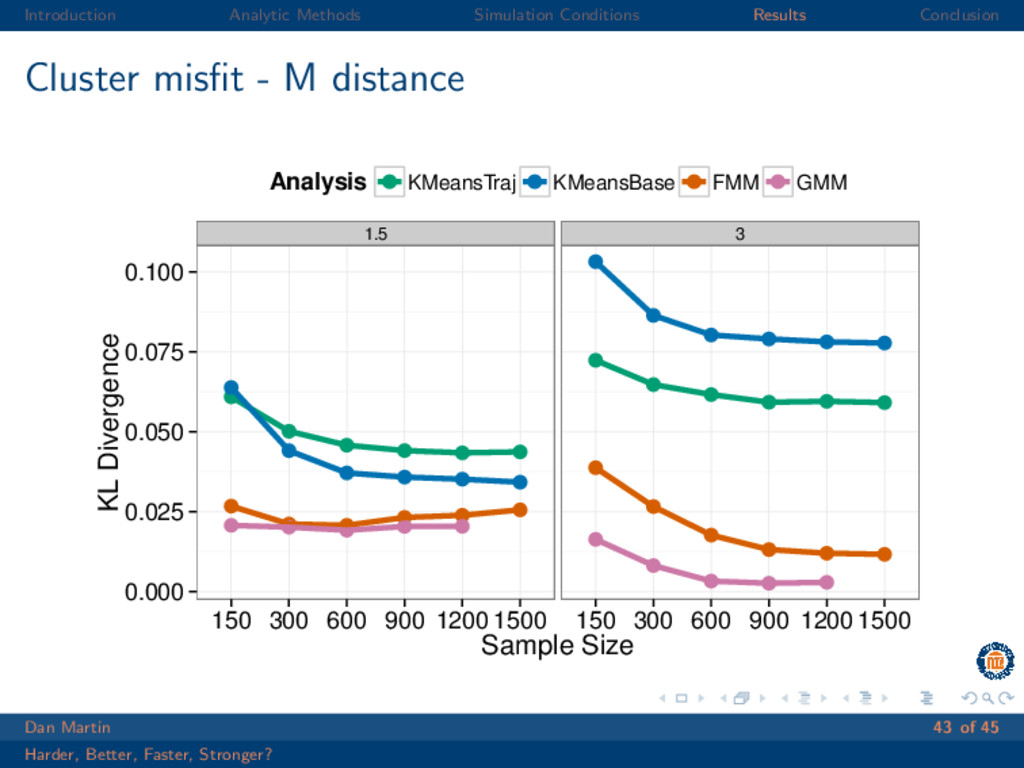
  43. Introduction Analytic Methods Simulation Conditions Results Conclusion Cluster misfit -

    M distance 1.5 3 0.000 0.025 0.050 0.075 0.100 150 300 600 900 1200 1500 150 300 600 900 1200 1500 Sample Size KL Divergence Analysis KMeansTraj KMeansBase FMM GMM Dan Martin 43 of 45 Harder, Better, Faster, Stronger?
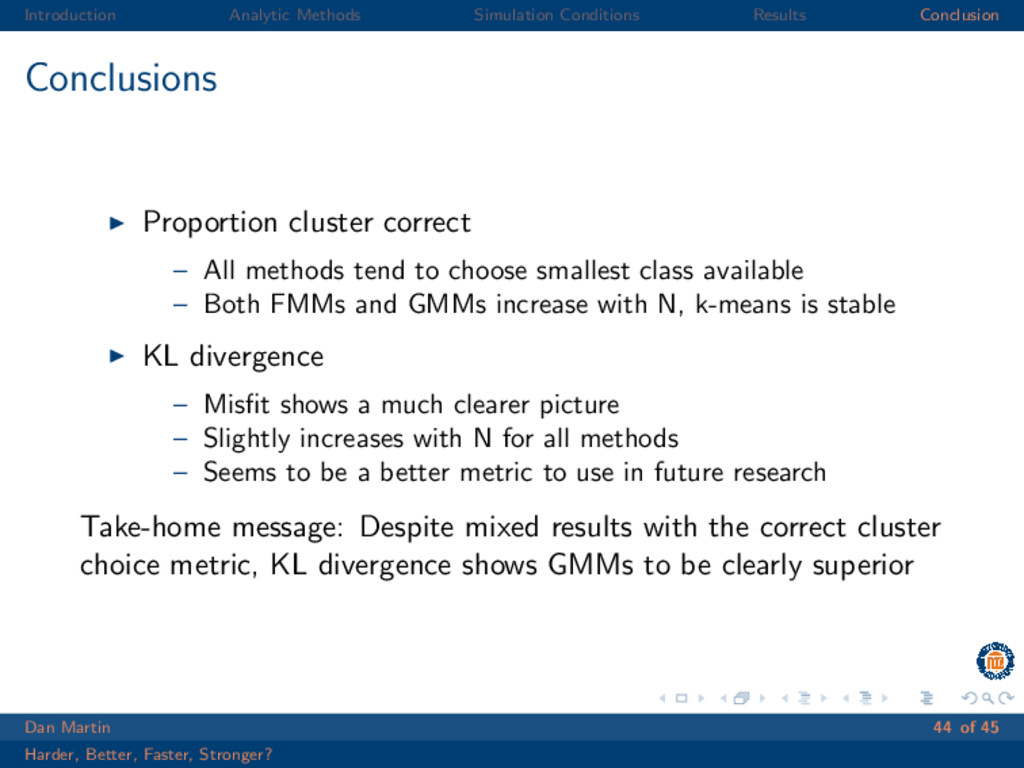
  44. Introduction Analytic Methods Simulation Conditions Results Conclusion Conclusions Proportion cluster

    correct – All methods tend to choose smallest class available – Both FMMs and GMMs increase with N, k-means is stable KL divergence – Misfit shows a much clearer picture – Slightly increases with N for all methods – Seems to be a better metric to use in future research Take-home message: Despite mixed results with the correct cluster choice metric, KL divergence shows GMMs to be clearly superior Dan Martin 44 of 45 Harder, Better, Faster, Stronger?