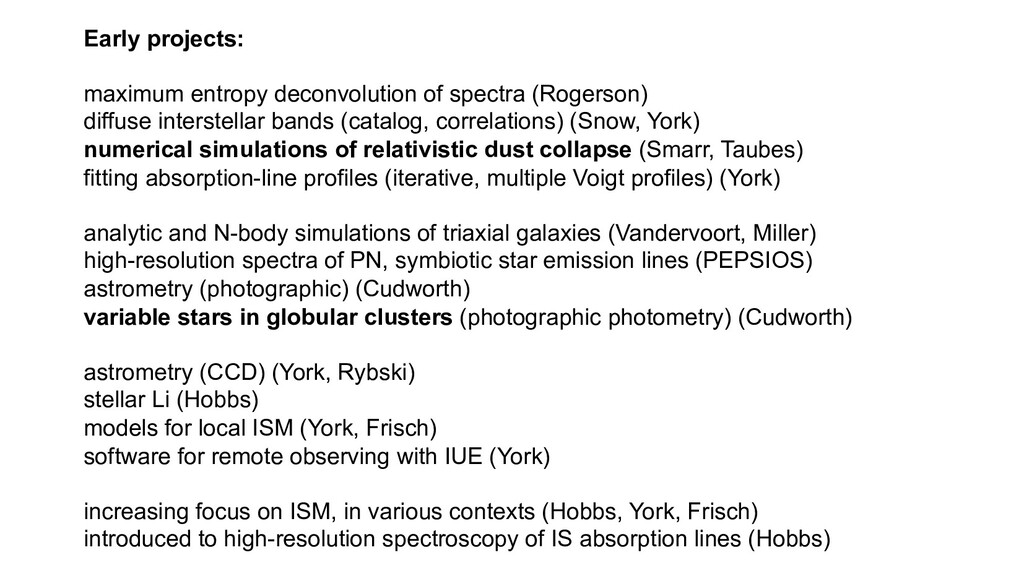
bands (catalog, correlations) (Snow, York) numerical simulations of relativistic dust collapse (Smarr, Taubes) fitting absorption-line profiles (iterative, multiple Voigt profiles) (York) analytic and N-body simulations of triaxial galaxies (Vandervoort, Miller) high-resolution spectra of PN, symbiotic star emission lines (PEPSIOS) astrometry (photographic) (Cudworth) variable stars in globular clusters (photographic photometry) (Cudworth) astrometry (CCD) (York, Rybski) stellar Li (Hobbs) models for local ISM (York, Frisch) software for remote observing with IUE (York) increasing focus on ISM, in various contexts (Hobbs, York, Frisch) introduced to high-resolution spectroscopy of IS absorption lines (Hobbs)
of optical interstellar absorption lines (R > 100000) database of atomic & molecular column densities (MW, MC, DLA) detailed studies of individual sight lines (optical + UV) comparing diagnostics (e.g., for T, n H , n e ) translucent clouds (1 < A V < 5) local ISM (d < 100 pc) high-velocity gas small-scale spatial & temporal variations in absorption heavy elements (Sn, Pb) diffuse interstellar bands extend these to Magellanic Clouds (implications for DLAs) we see that the ISM is not as simple as sometimes thought ...
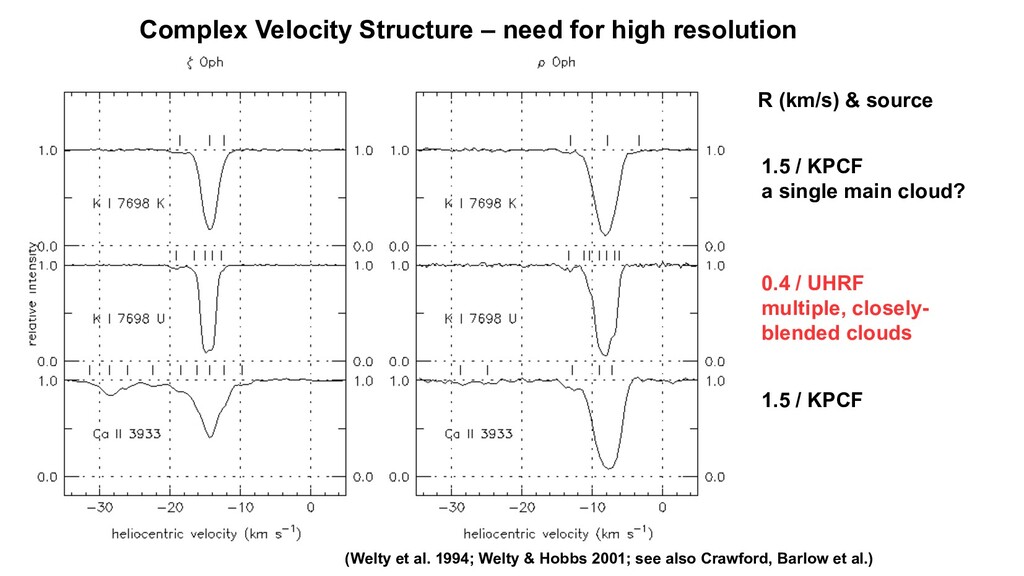
al. 1994; Welty & Hobbs 2001; see also Crawford, Barlow et al.) 1.5 / KPCF a single main cloud? 0.4 / UHRF multiple, closely- blended clouds 1.5 / KPCF R (km/s) & source
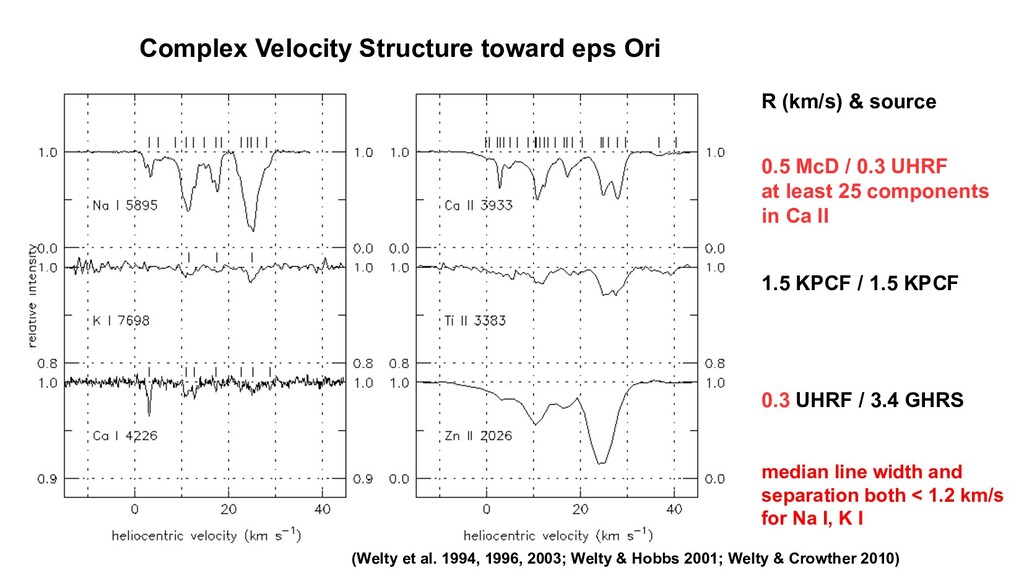
1996, 2003; Welty & Hobbs 2001; Welty & Crowther 2010) 0.5 McD / 0.3 UHRF at least 25 components in Ca II 1.5 KPCF / 1.5 KPCF 0.3 UHRF / 3.4 GHRS R (km/s) & source median line width and separation both < 1.2 km/s for Na I, K I
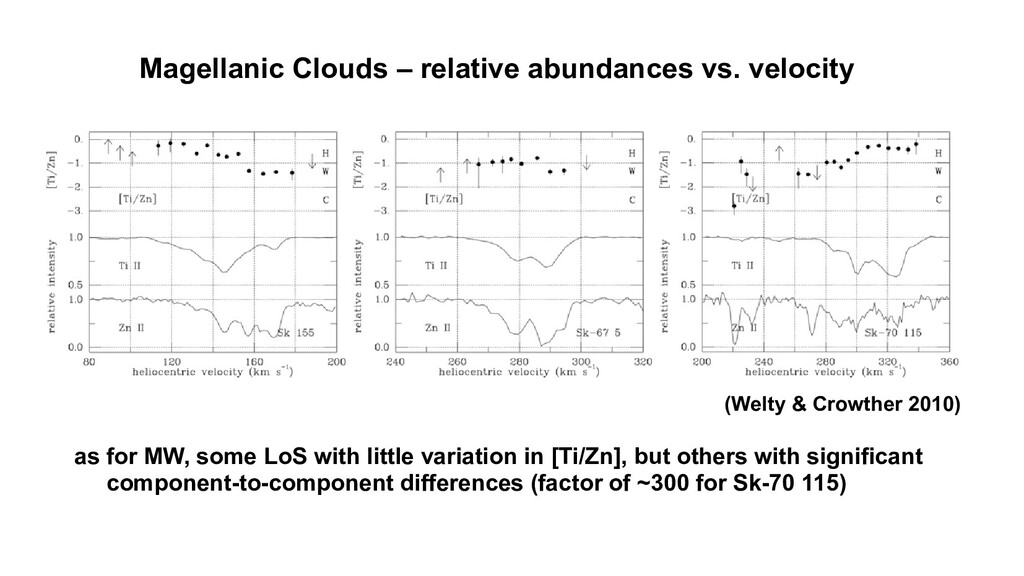
have factor of 30 variations in [Ti/Zn] within 10 km/s LoS averages tend to mask those variations -- obscuring both the most and least severe depletions but those extremes can aid understanding of connection between gas and dust
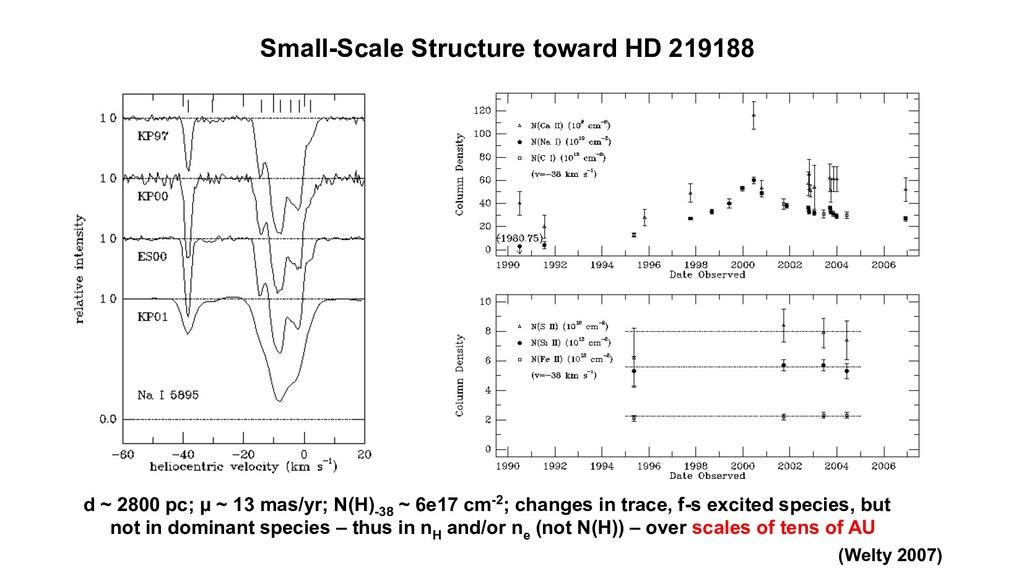
~ 13 mas/yr; N(H) -38 ~ 6e17 cm-2; changes in trace, f-s excited species, but not in dominant species – thus in n H and/or n e (not N(H)) – over scales of tens of AU (Welty 2007)
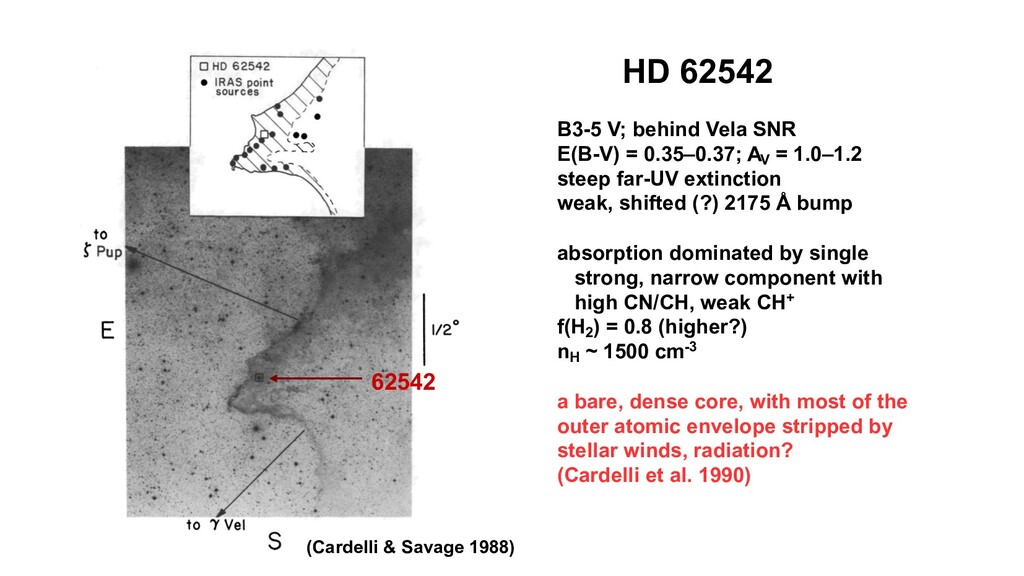
AV = 1.0–1.2 steep far-UV extinction weak, shifted (?) 2175 Å bump absorption dominated by single strong, narrow component with high CN/CH, weak CH+ f(H2 ) = 0.8 (higher?) nH ~ 1500 cm-3 a bare, dense core, with most of the outer atomic envelope stripped by stellar winds, radiation? (Cardelli et al. 1990) (Cardelli & Savage 1988) 62542
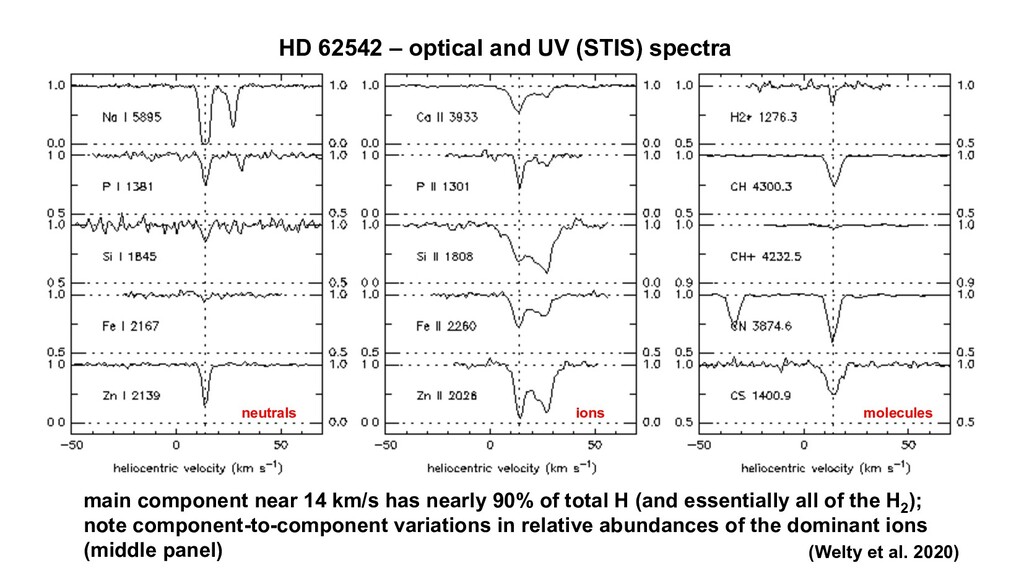
near 14 km/s has nearly 90% of total H (and essentially all of the H2 ); note component-to-component variations in relative abundances of the dominant ions (middle panel) (Welty et al. 2020) neutrals ions molecules
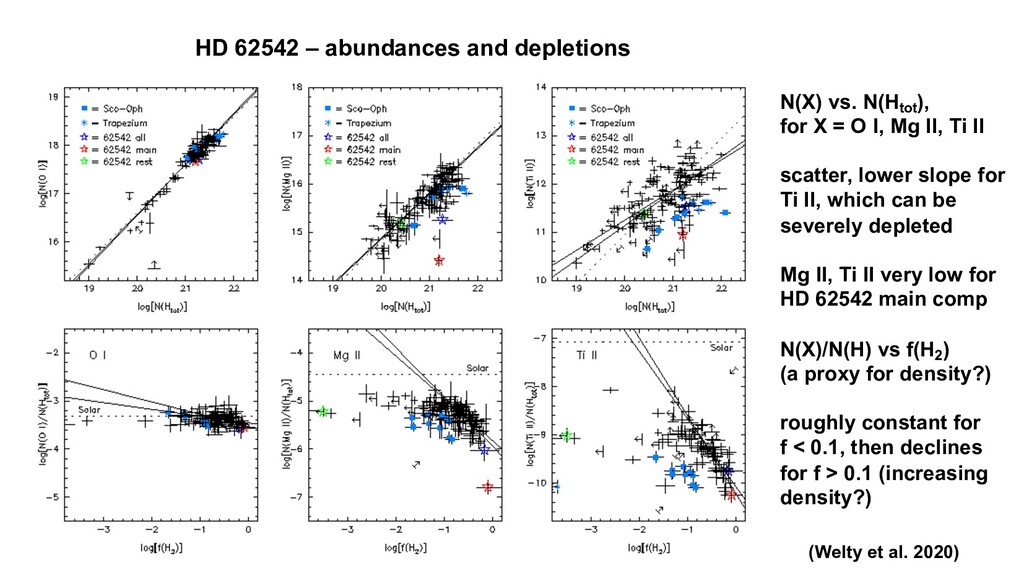
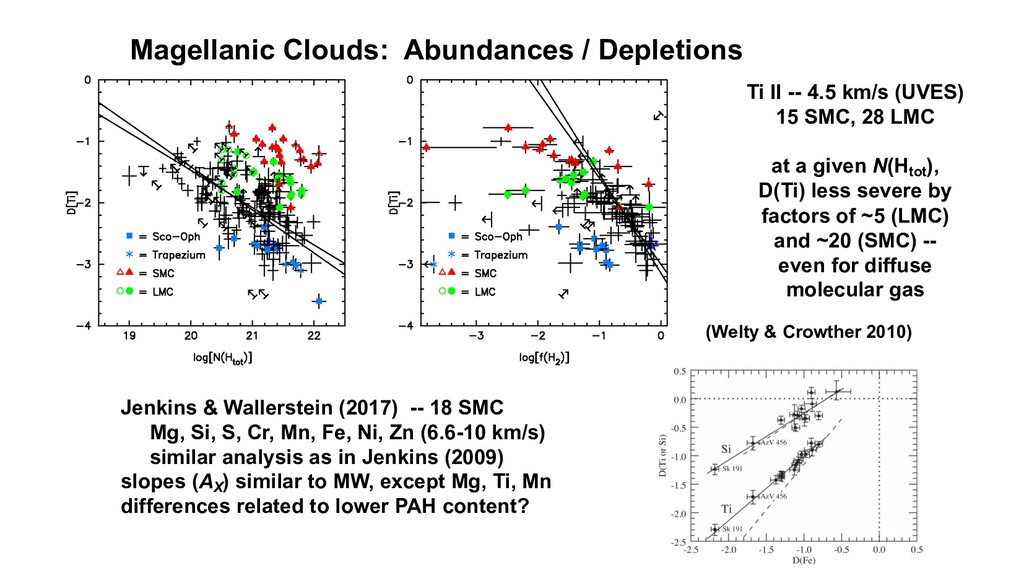
N(X) vs. N(Htot ), for X = O I, Mg II, Ti II scatter, lower slope for Ti II, which can be severely depleted Mg II, Ti II very low for HD 62542 main comp N(X)/N(H) vs f(H2 ) (a proxy for density?) roughly constant for f < 0.1, then declines for f > 0.1 (increasing density?)
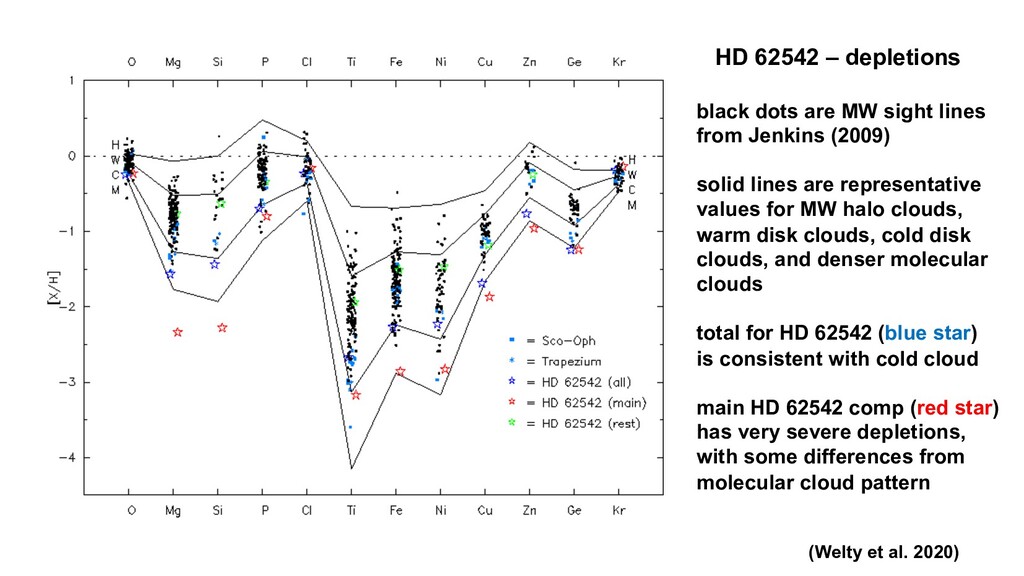
are MW sight lines from Jenkins (2009) solid lines are representative values for MW halo clouds, warm disk clouds, cold disk clouds, and denser molecular clouds total for HD 62542 (blue star) is consistent with cold cloud main HD 62542 comp (red star) has very severe depletions, with some differences from molecular cloud pattern
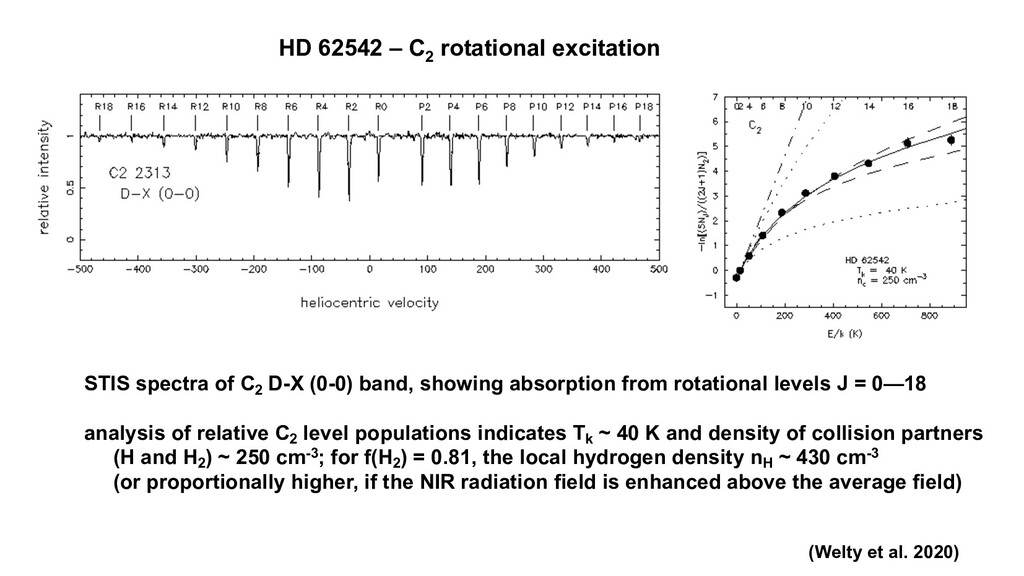
2020) STIS spectra of C2 D-X (0-0) band, showing absorption from rotational levels J = 0—18 analysis of relative C2 level populations indicates Tk ~ 40 K and density of collision partners (H and H2 ) ~ 250 cm-3; for f(H2 ) = 0.81, the local hydrogen density nH ~ 430 cm-3 (or proportionally higher, if the NIR radiation field is enhanced above the average field)
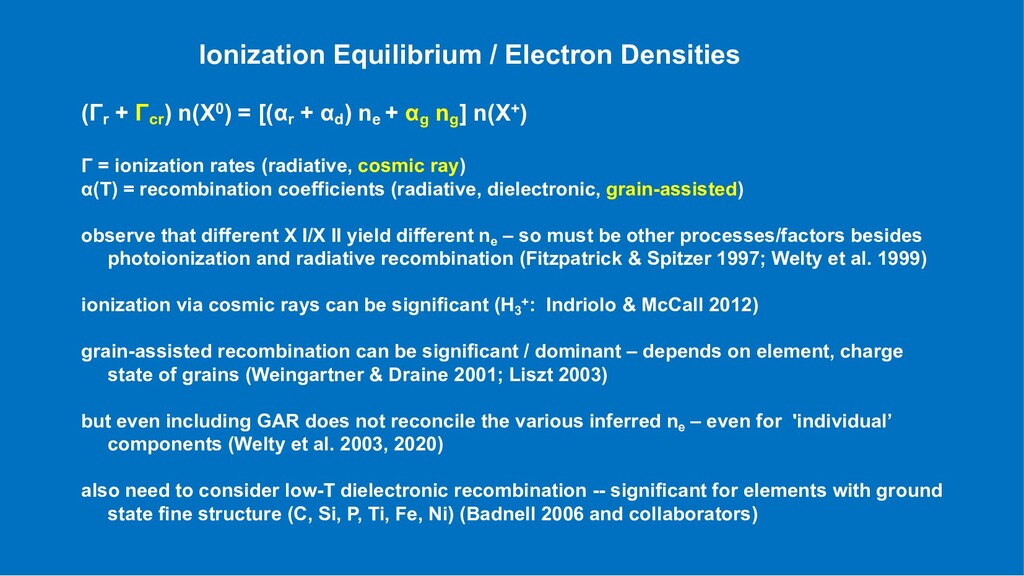
= [(αr + αd ) ne + αg ng ] n(X+) Γ = ionization rates (radiative, cosmic ray) α(T) = recombination coefficients (radiative, dielectronic, grain-assisted) observe that different X I/X II yield different ne – so must be other processes/factors besides photoionization and radiative recombination (Fitzpatrick & Spitzer 1997; Welty et al. 1999) ionization via cosmic rays can be significant (H3 +: Indriolo & McCall 2012) grain-assisted recombination can be significant / dominant – depends on element, charge state of grains (Weingartner & Draine 2001; Liszt 2003) but even including GAR does not reconcile the various inferred ne – even for 'individual’ components (Welty et al. 2003, 2020) also need to consider low-T dielectronic recombination -- significant for elements with ground state fine structure (C, Si, P, Ti, Fe, Ni) (Badnell 2006 and collaborators)
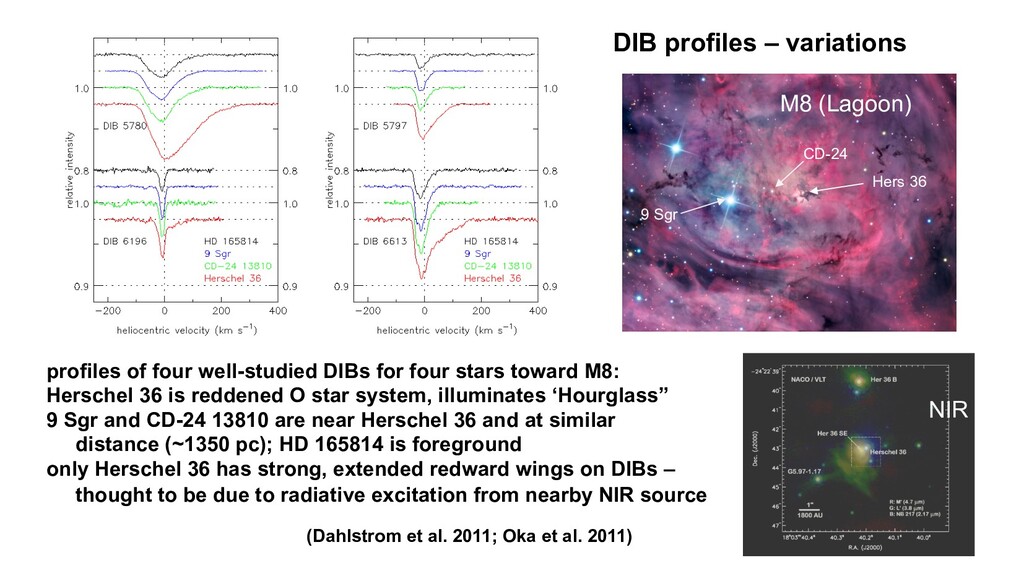
well-studied DIBs for four stars toward M8: Herschel 36 is reddened O star system, illuminates ‘Hourglass” 9 Sgr and CD-24 13810 are near Herschel 36 and at similar distance (~1350 pc); HD 165814 is foreground only Herschel 36 has strong, extended redward wings on DIBs – thought to be due to radiative excitation from nearby NIR source (Dahlstrom et al. 2011; Oka et al. 2011) Hers 36 9 Sgr CD-24
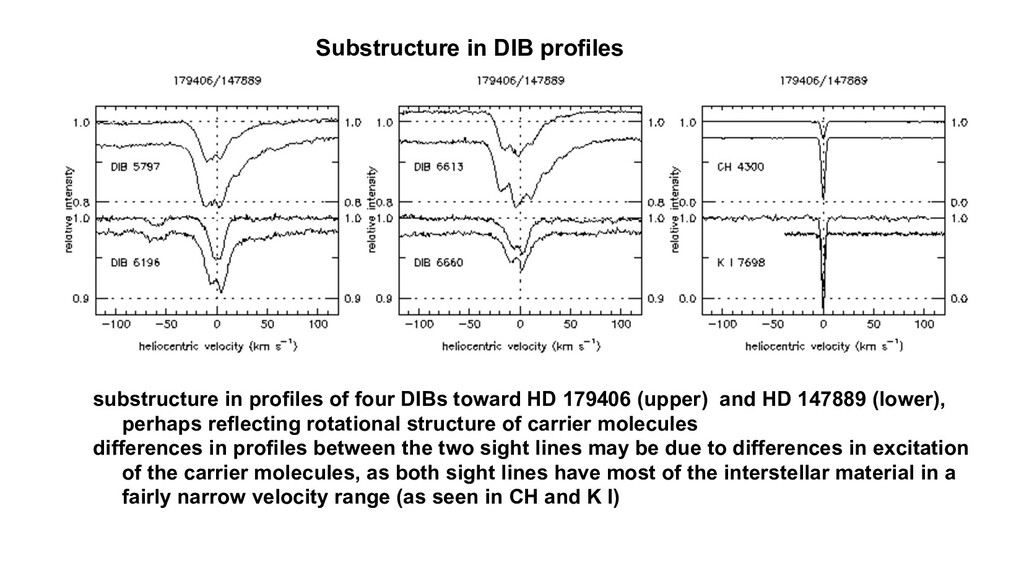
toward HD 179406 (upper) and HD 147889 (lower), perhaps reflecting rotational structure of carrier molecules differences in profiles between the two sight lines may be due to differences in excitation of the carrier molecules, as both sight lines have most of the interstellar material in a fairly narrow velocity range (as seen in CH and K I)
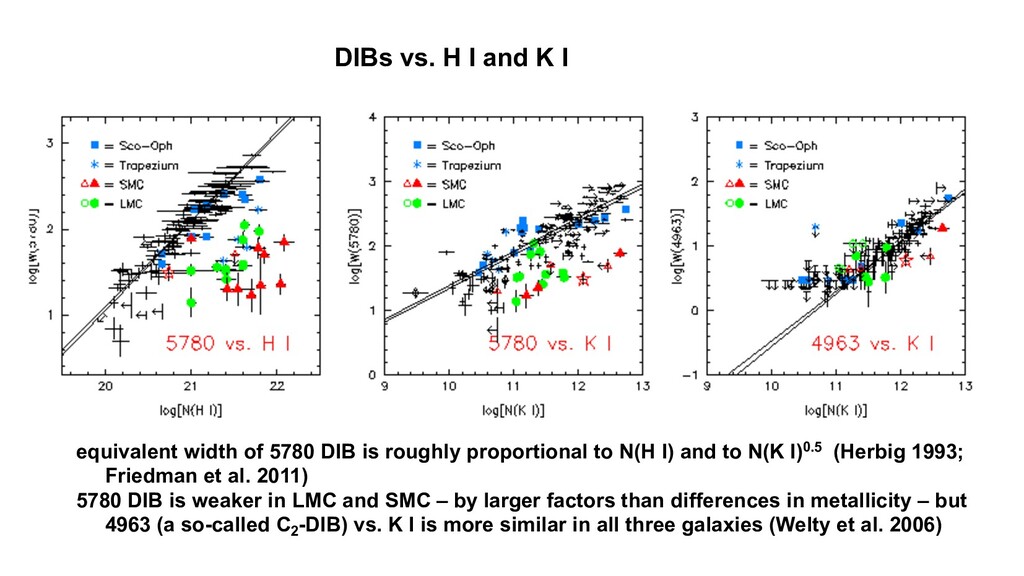
5780 DIB is roughly proportional to N(H I) and to N(K I)0.5 (Herbig 1993; Friedman et al. 2011) 5780 DIB is weaker in LMC and SMC – by larger factors than differences in metallicity – but 4963 (a so-called C2 -DIB) vs. K I is more similar in all three galaxies (Welty et al. 2006)
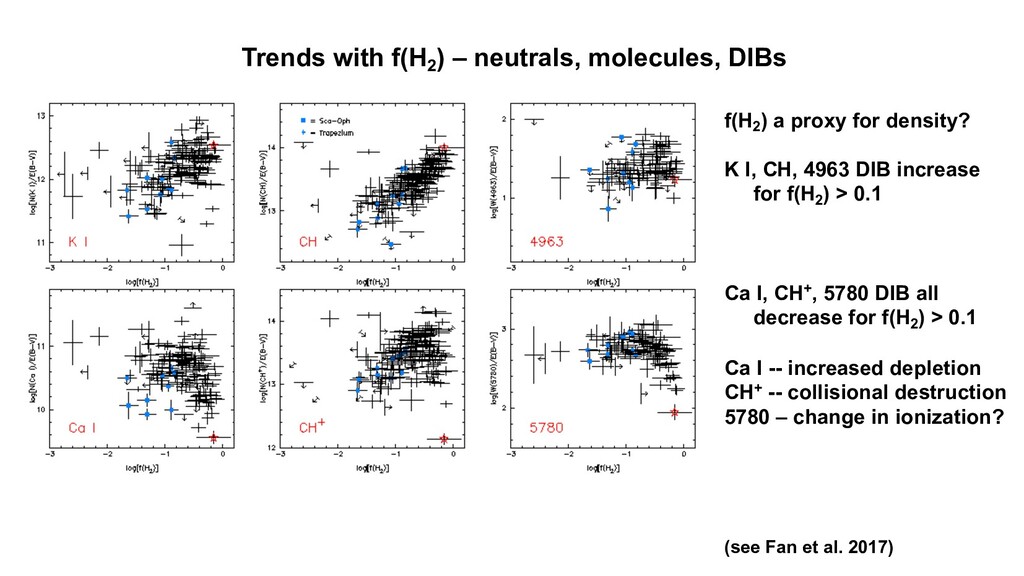
a proxy for density? K I, CH, 4963 DIB increase for f(H2 ) > 0.1 Ca I, CH+, 5780 DIB all decrease for f(H2 ) > 0.1 Ca I -- increased depletion CH+ -- collisional destruction 5780 – change in ionization? (see Fan et al. 2017)
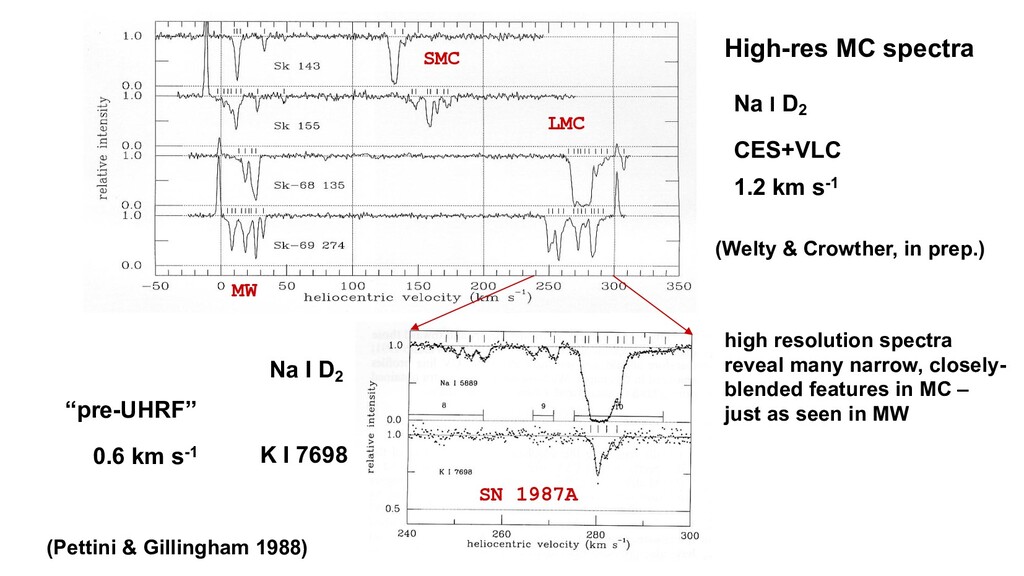
CES+VLC 1.2 km s-1 MW (Welty & Crowther, in prep.) SN 1987A Na I D2 K I 7698 “pre-UHRF” 0.6 km s-1 (Pettini & Gillingham 1988) High-res MC spectra high resolution spectra reveal many narrow, closely- blended features in MC – just as seen in MW
2010) as for MW, some LoS with little variation in [Ti/Zn], but others with significant component-to-component differences (factor of ~300 for Sk-70 115)
(UVES) 15 SMC, 28 LMC at a given N(Htot ), D(Ti) less severe by factors of ~5 (LMC) and ~20 (SMC) -- even for diffuse molecular gas (Welty & Crowther 2010) Jenkins & Wallerstein (2017) -- 18 SMC Mg, Si, S, Cr, Mn, Fe, Ni, Zn (6.6-10 km/s) similar analysis as in Jenkins (2009) slopes (AX ) similar to MW, except Mg, Ti, Mn differences related to lower PAH content?
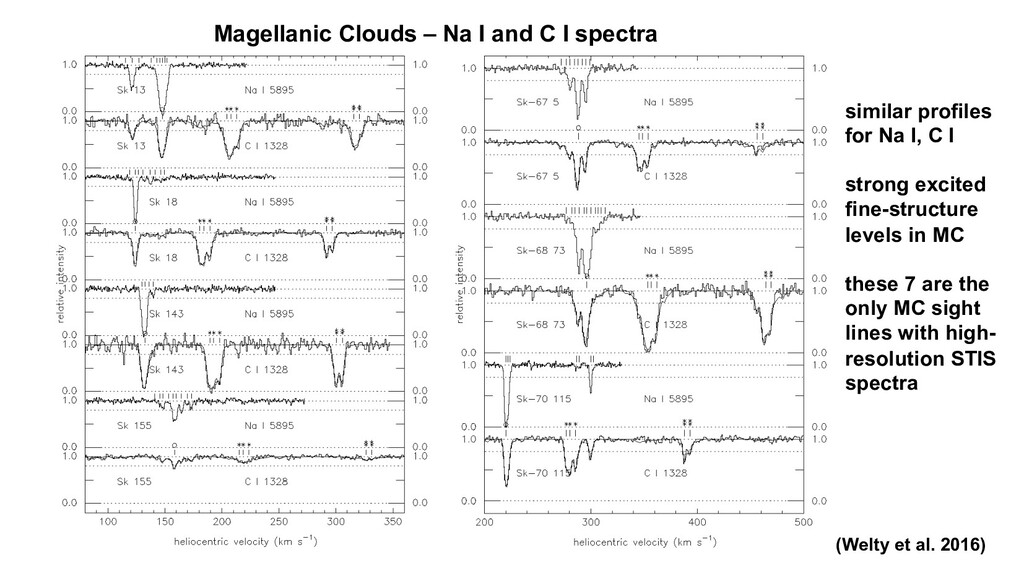
profiles for Na I, C I strong excited fine-structure levels in MC these 7 are the only MC sight lines with high- resolution STIS spectra (Welty et al. 2016)
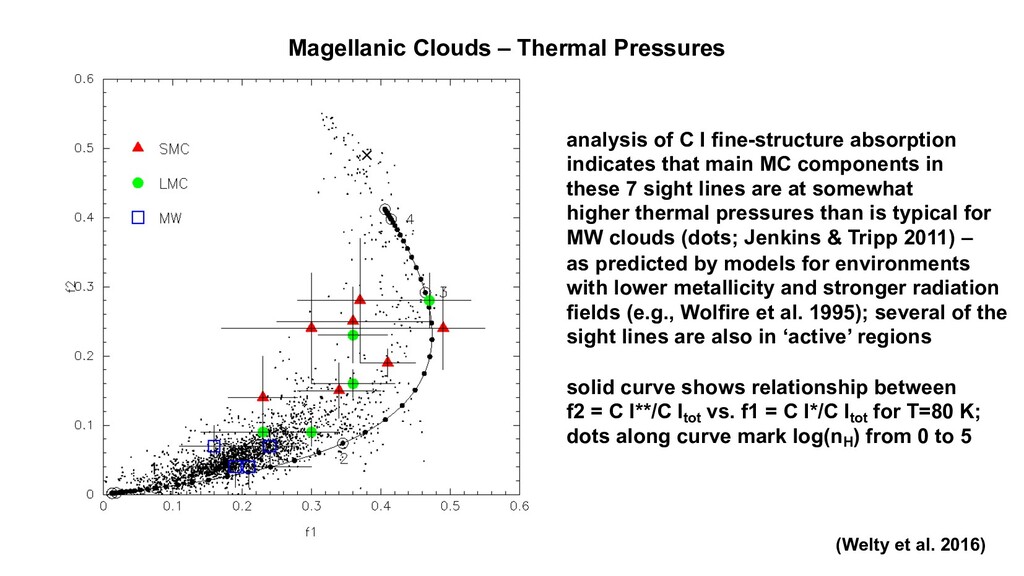
of C I fine-structure absorption indicates that main MC components in these 7 sight lines are at somewhat higher thermal pressures than is typical for MW clouds (dots; Jenkins & Tripp 2011) – as predicted by models for environments with lower metallicity and stronger radiation fields (e.g., Wolfire et al. 1995); several of the sight lines are also in ‘active’ regions solid curve shows relationship between f2 = C I**/C Itot vs. f1 = C I*/C Itot for T=80 K; dots along curve mark log(nH ) from 0 to 5
![Relative Abundances [Ti/Zn] vs. Velocity (Welty & Crowther 2010) can](https://files.speakerdeck.com/presentations/1d79518d824a4812826c7ea24e9d4320/slide_7.jpg)