Upgrade to Pro — share decks privately, control downloads, hide ads and more …

What Your JavaScript Does When You're Not Around

Sponsored · SiteGround - Reliable hosting with speed, security, and support you can count on. →

What Your JavaScript Does When You're Not Around

Slides from my talk at Monitorama 2016 & Abstractions 2016
Avatar for Emily Nakashima

Emily Nakashima

June 28, 2016

Other Decks in Technology

Transcript

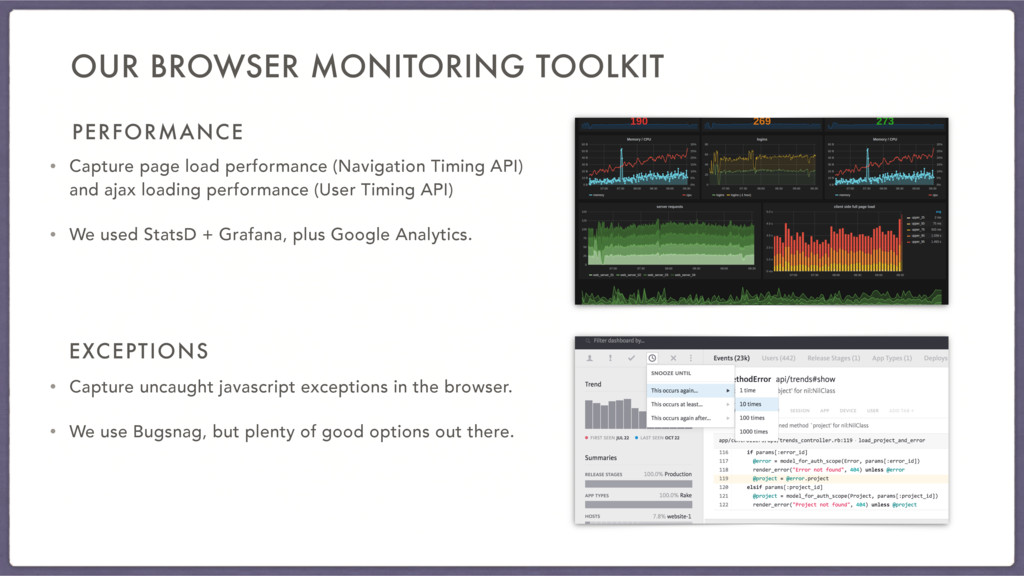
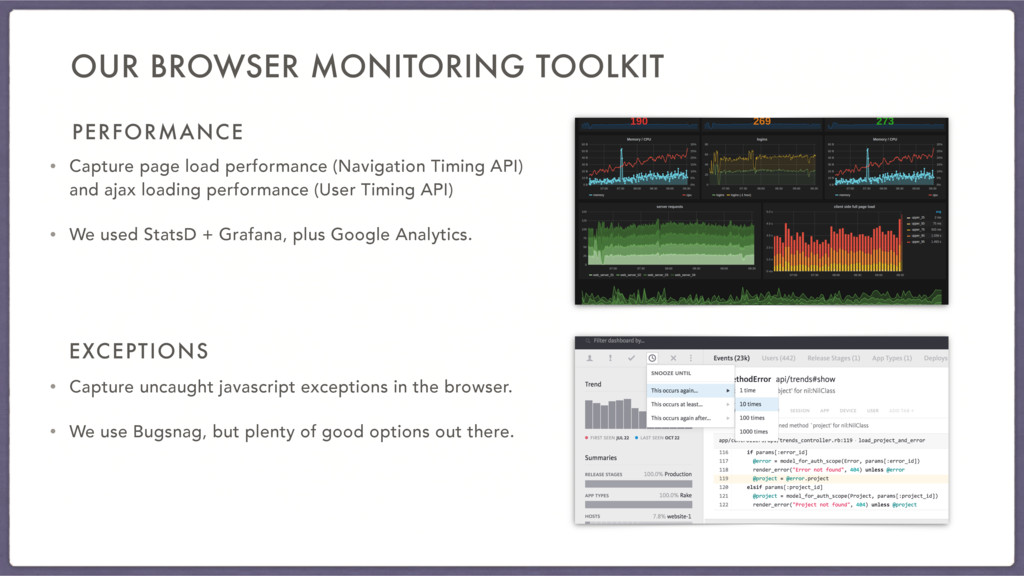
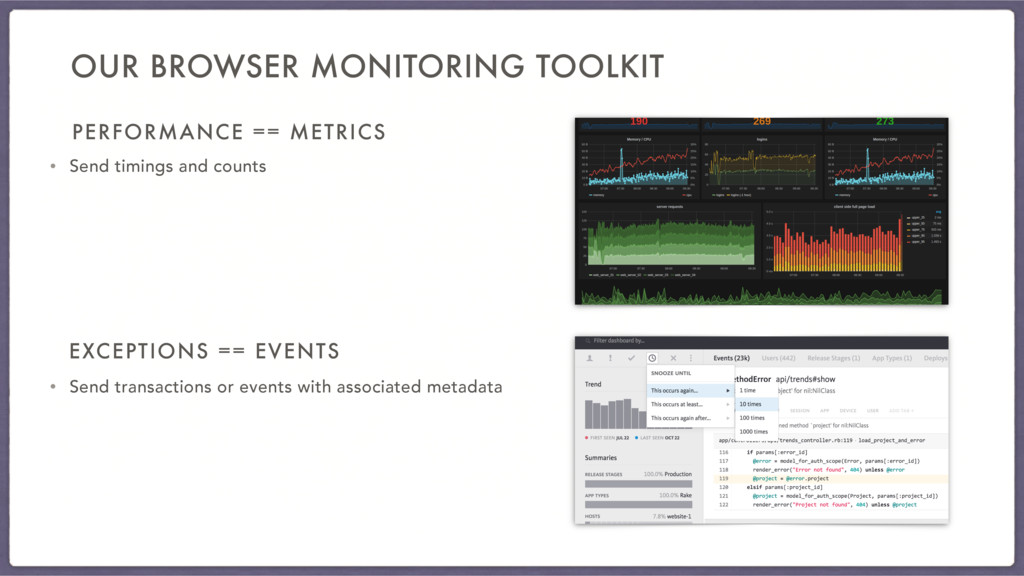
  1. PERFORMANCE EXCEPTIONS • Capture page load performance (Navigation Timing API)

    and ajax loading performance (User Timing API) • We used StatsD + Grafana, plus Google Analytics. • Capture uncaught javascript exceptions in the browser. • We use Bugsnag, but plenty of good options out there. OUR BROWSER MONITORING TOOLKIT
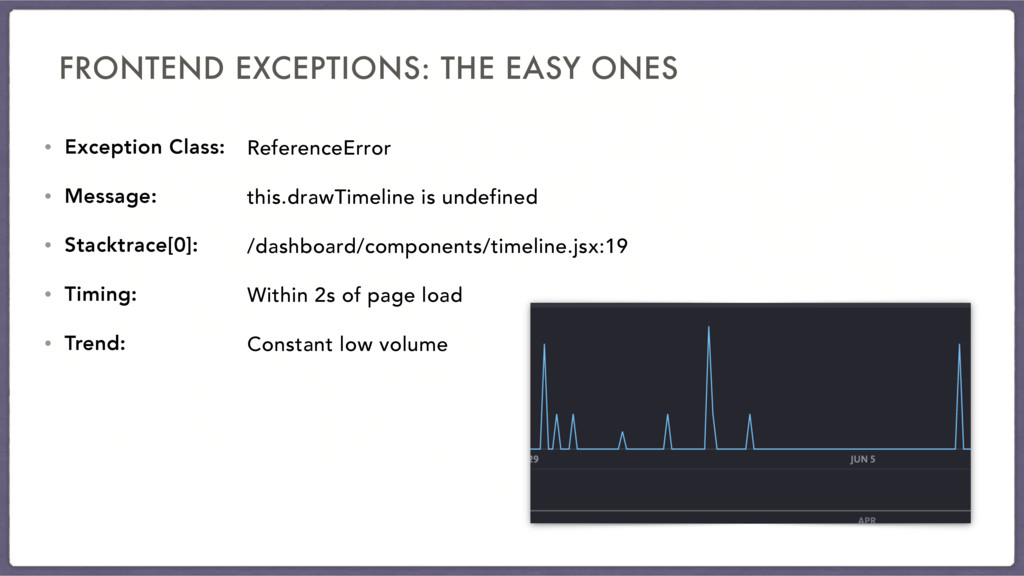
  2. FRONTEND EXCEPTIONS: THE EASY ONES • Exception Class: • Message:

    • Stacktrace[0]: • Timing: • Trend: ReferenceError this.drawTimeline is undefined /dashboard/components/timeline.jsx:19 Within 2s of page load Constant low volume
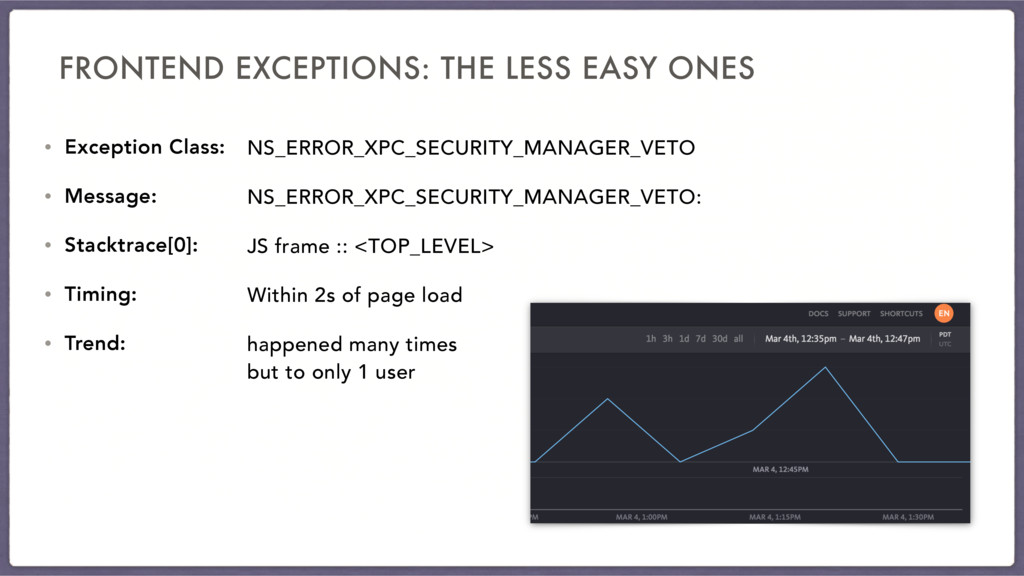
  3. FRONTEND EXCEPTIONS: THE LESS EASY ONES • Exception Class: •

    Message: • Stacktrace[0]: • Timing: • Trend: NS_ERROR_XPC_SECURITY_MANAGER_VETO NS_ERROR_XPC_SECURITY_MANAGER_VETO: JS frame :: <TOP_LEVEL> Within 2s of page load happened many times
 but to only 1 user
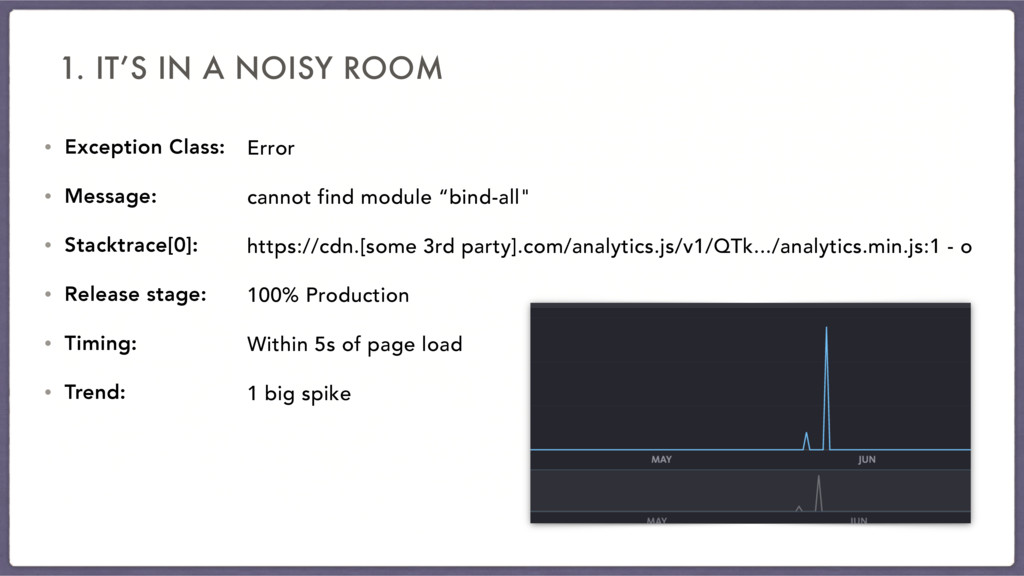
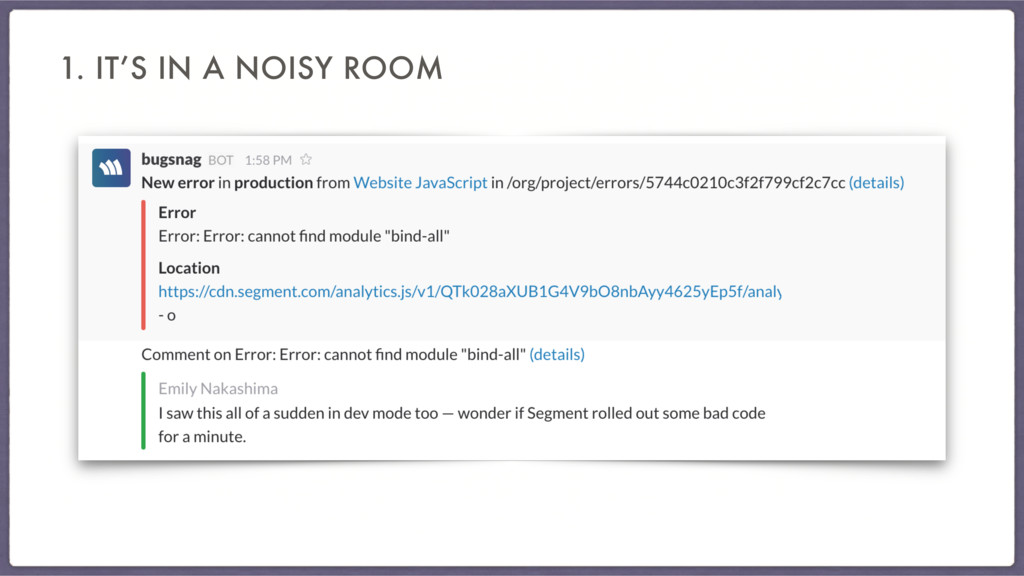
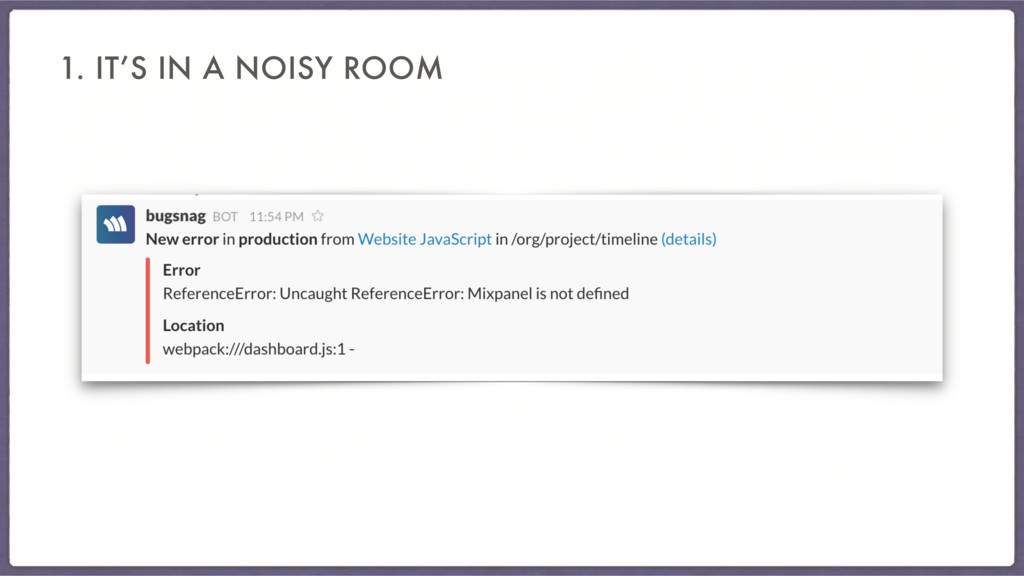
  4. 1. IT’S IN A NOISY ROOM • Exception Class: •

    Message: • Stacktrace[0]: • Release stage: • Timing: • Trend: Error cannot find module “bind-all" https://cdn.[some 3rd party].com/analytics.js/v1/QTk.../analytics.min.js:1 - o 100% Production Within 5s of page load 1 big spike
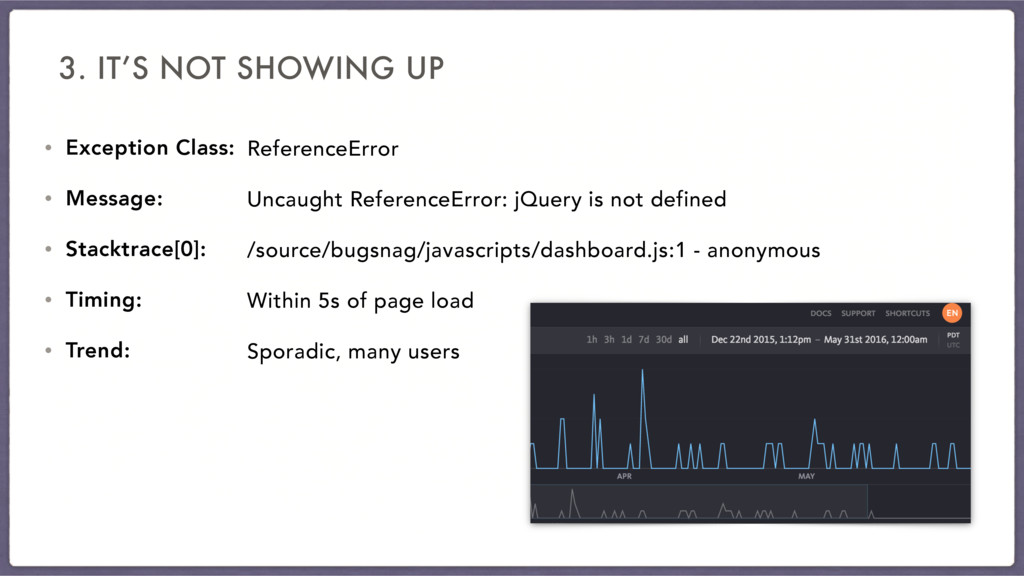
  5. 3. IT’S NOT SHOWING UP • Exception Class: • Message:

    • Stacktrace[0]: • Timing: • Trend: ReferenceError Uncaught ReferenceError: jQuery is not defined /source/bugsnag/javascripts/dashboard.js:1 - anonymous Within 5s of page load Sporadic, many users
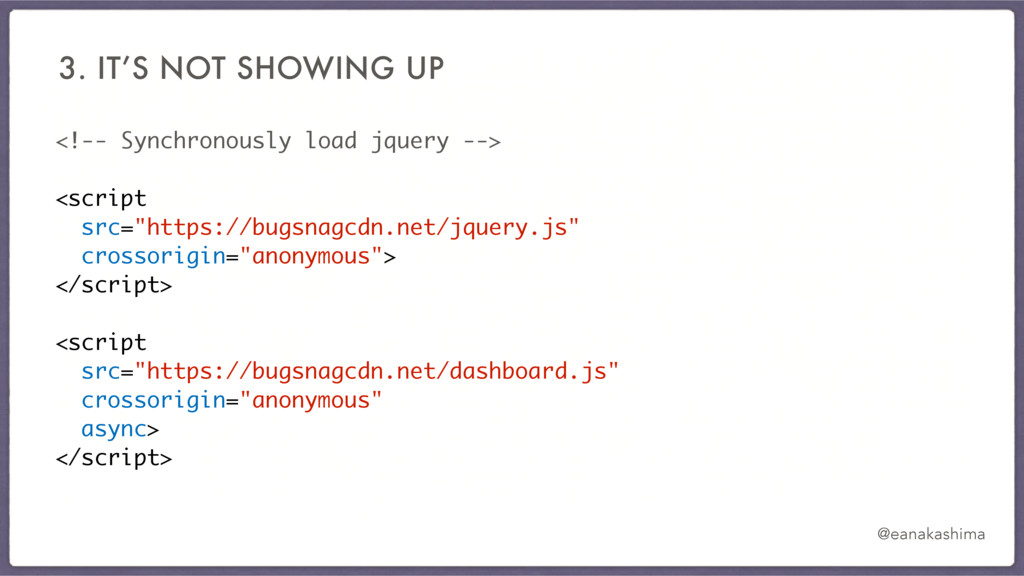
  6. @eanakashima <!-- Synchronously load jquery --> <script
 src="https://bugsnagcdn.net/jquery.js"
 crossorigin="anonymous">
 </script>

    <script
 src="https://bugsnagcdn.net/dashboard.js"
 crossorigin="anonymous"
 async> </script> 3. IT’S NOT SHOWING UP
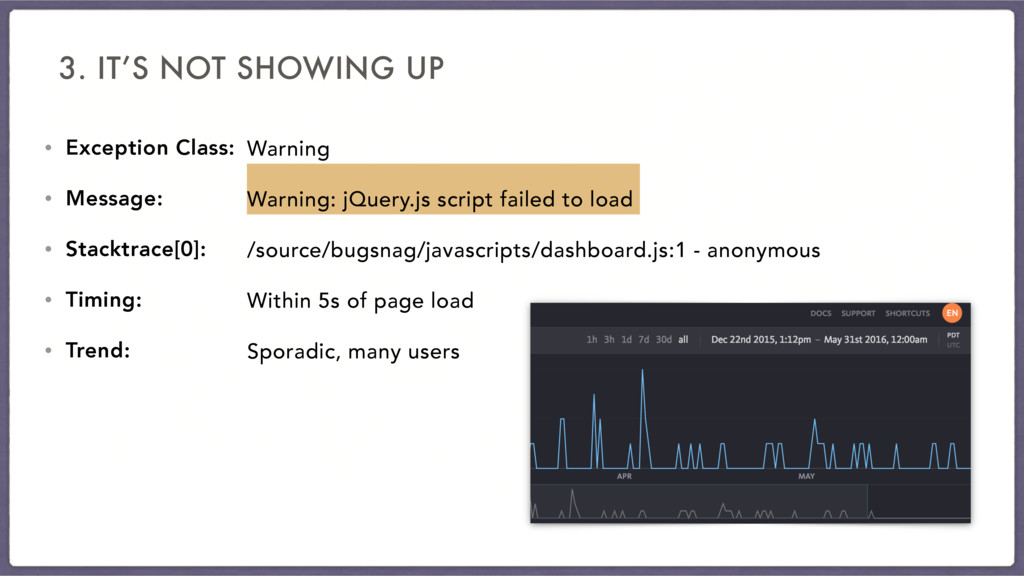
  7. 3. IT’S NOT SHOWING UP • Exception Class: • Message:

    • Stacktrace[0]: • Timing: • Trend: Warning Warning: jQuery.js script failed to load /source/bugsnag/javascripts/dashboard.js:1 - anonymous Within 5s of page load Sporadic, many users
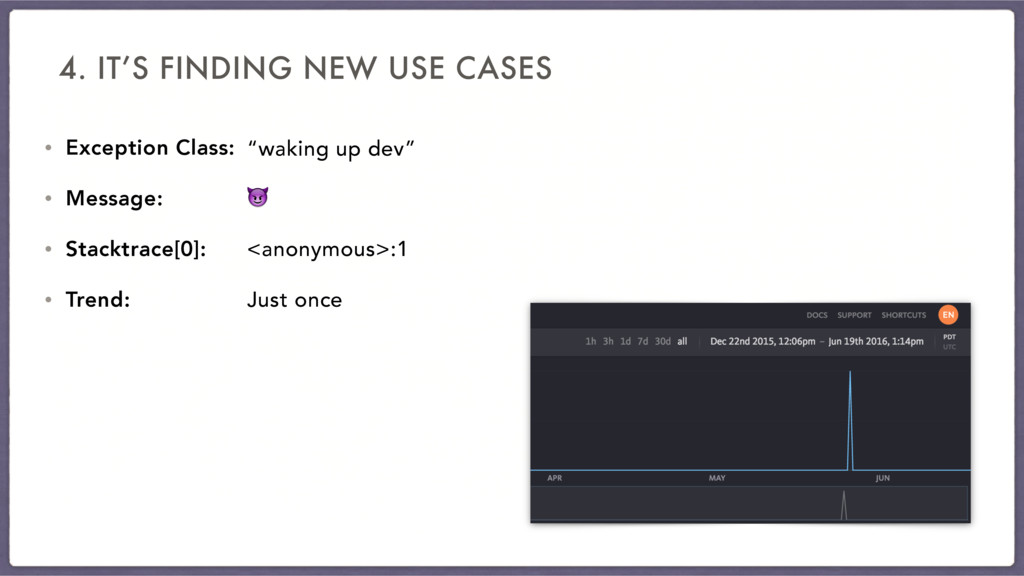
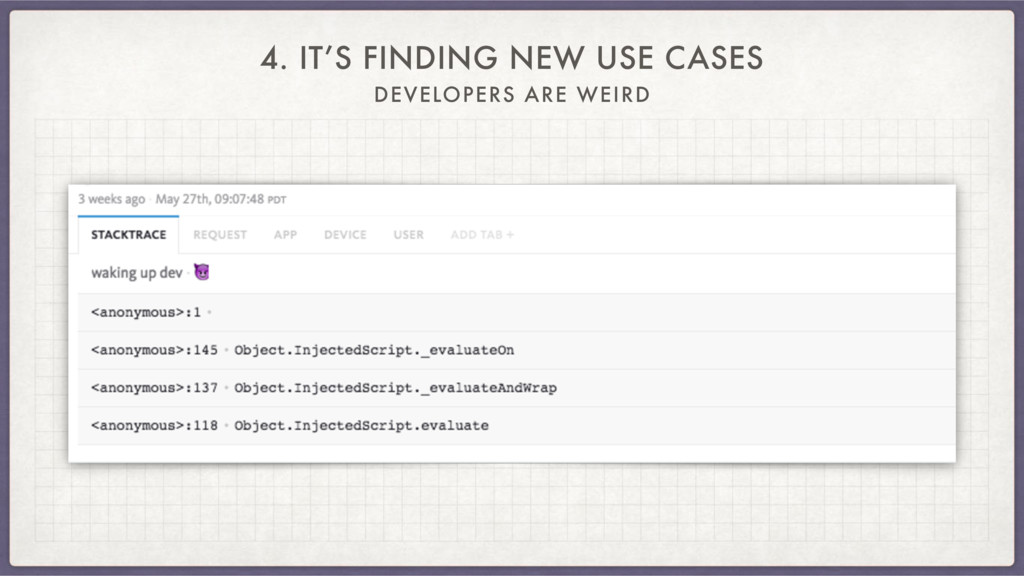
  8. 4. IT’S FINDING NEW USE CASES • Exception Class: •

    Message: • Stacktrace[0]: • Trend: “waking up dev” <anonymous>:1 Just once
  9. PERFORMANCE EXCEPTIONS • Capture page load performance (Navigation Timing API)

    and ajax loading performance (User Timing API) • We used StatsD + Grafana, plus Google Analytics. • Capture uncaught javascript exceptions in the browser. • We use Bugsnag, but plenty of good options out there. OUR BROWSER MONITORING TOOLKIT
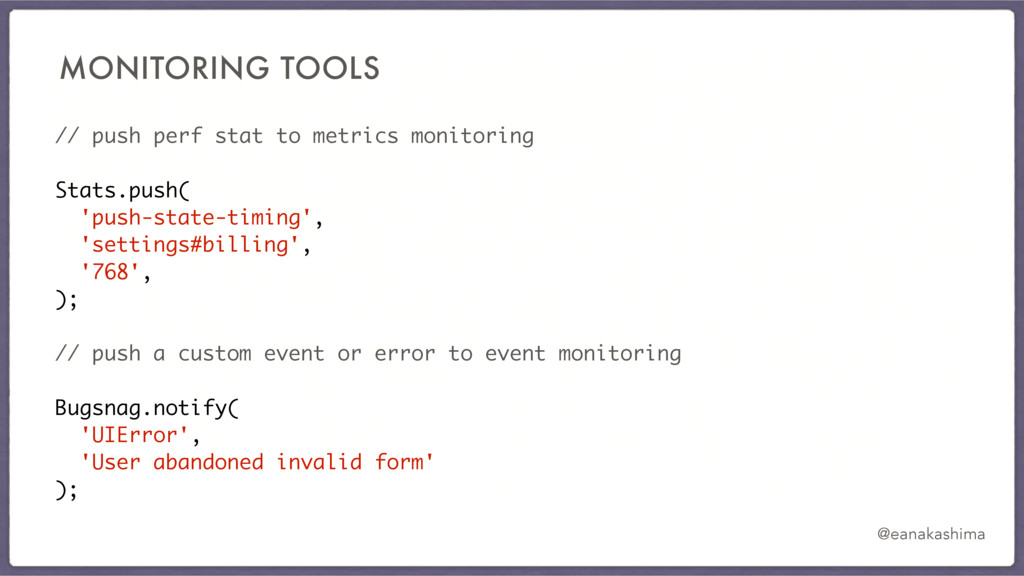
  10. @eanakashima // push perf stat to metrics monitoring
 Stats.push( 'push-state-timing',

    'settings#billing', '768', ); 
 // push a custom event or error to event monitoring Bugsnag.notify( 'UIError', 'User abandoned invalid form' ); MONITORING TOOLS
  11. PERFORMANCE == METRICS EXCEPTIONS == EVENTS • Send timings and

    counts • Send transactions or events with associated metadata OUR BROWSER MONITORING TOOLKIT
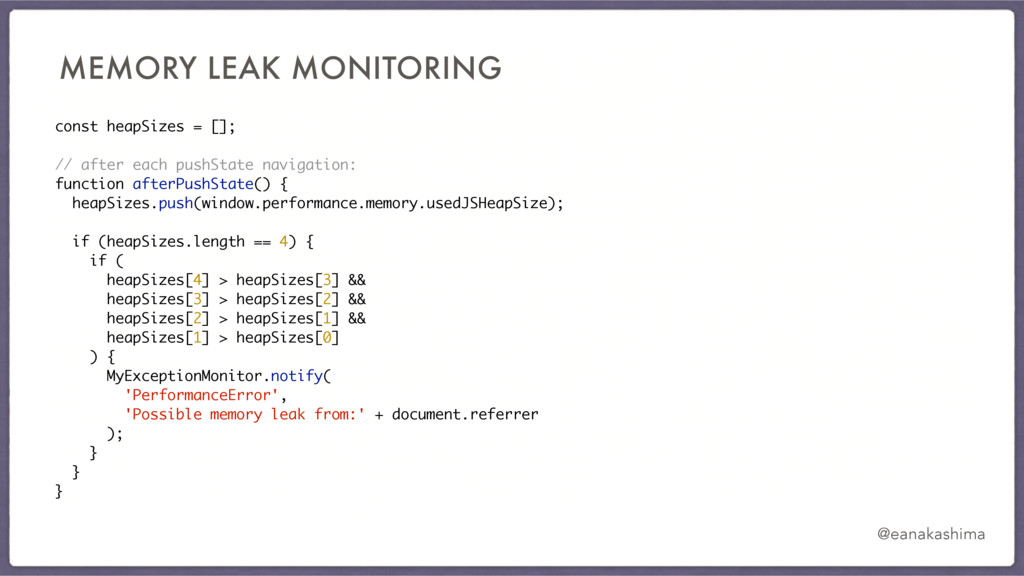
  12. @eanakashima const heapSizes = []; // after each pushState navigation:

    function afterPushState() { heapSizes.push(window.performance.memory.usedJSHeapSize); if (heapSizes.length == 4) { if ( heapSizes[4] > heapSizes[3] && heapSizes[3] > heapSizes[2] && heapSizes[2] > heapSizes[1] && heapSizes[1] > heapSizes[0] ) { MyExceptionMonitor.notify( 'PerformanceError', 'Possible memory leak from:' + document.referrer ); } } } MEMORY LEAK MONITORING
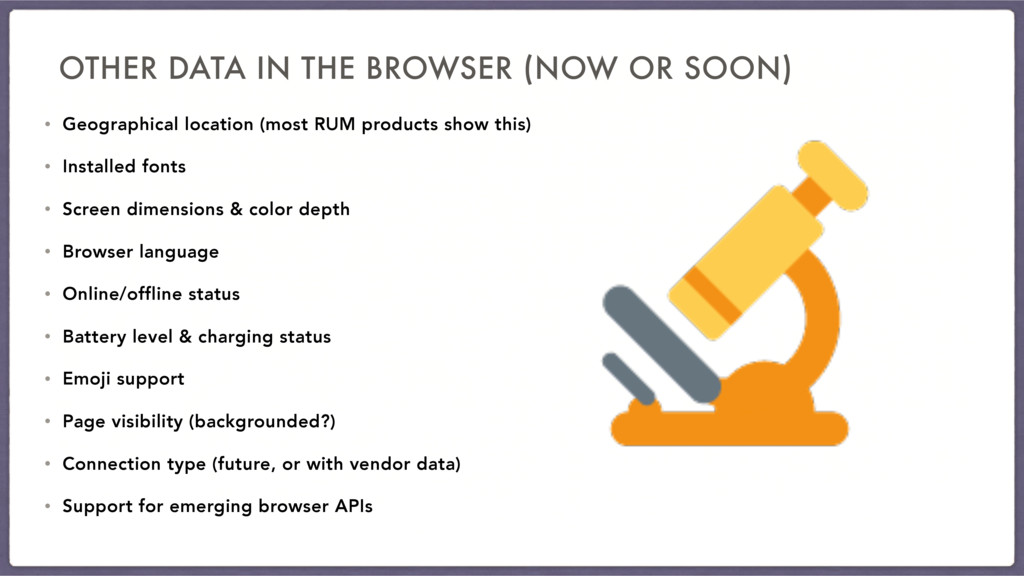
  13. OTHER DATA IN THE BROWSER (NOW OR SOON) • Geographical

    location (most RUM products show this) • Installed fonts • Screen dimensions & color depth • Browser language • Online/offline status • Battery level & charging status • Emoji support • Page visibility (backgrounded?) • Connection type (future, or with vendor data) • Support for emerging browser APIs