Upgrade to Pro — share decks privately, control downloads, hide ads and more …

Elizabeth (Betsy) Nichols

Elizabeth (Betsy) Nichols

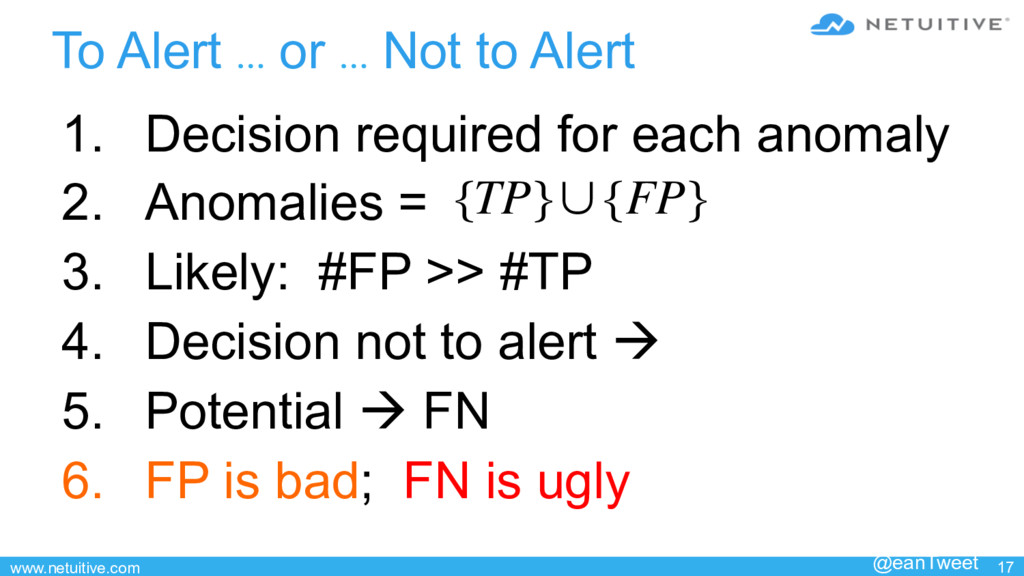
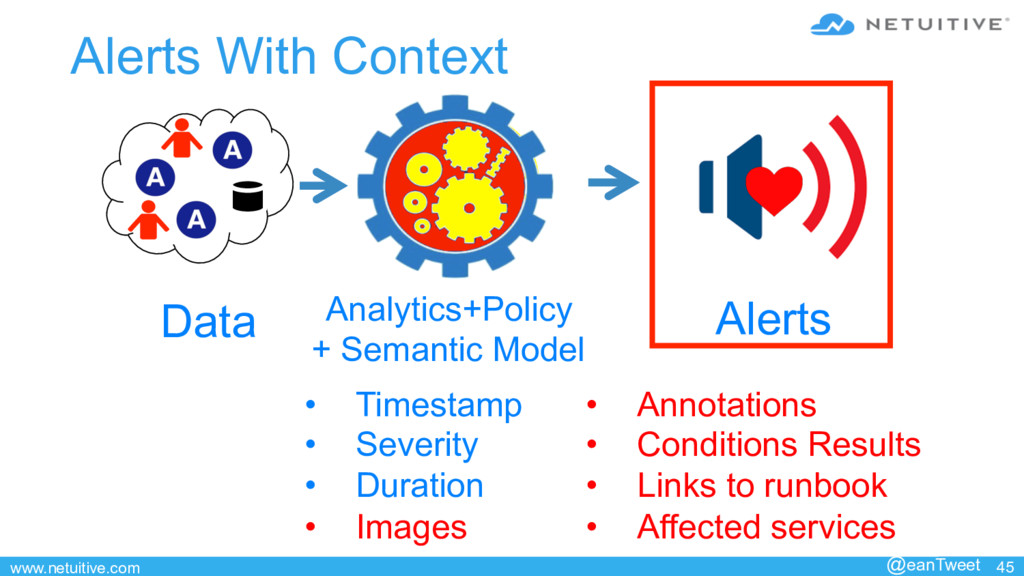
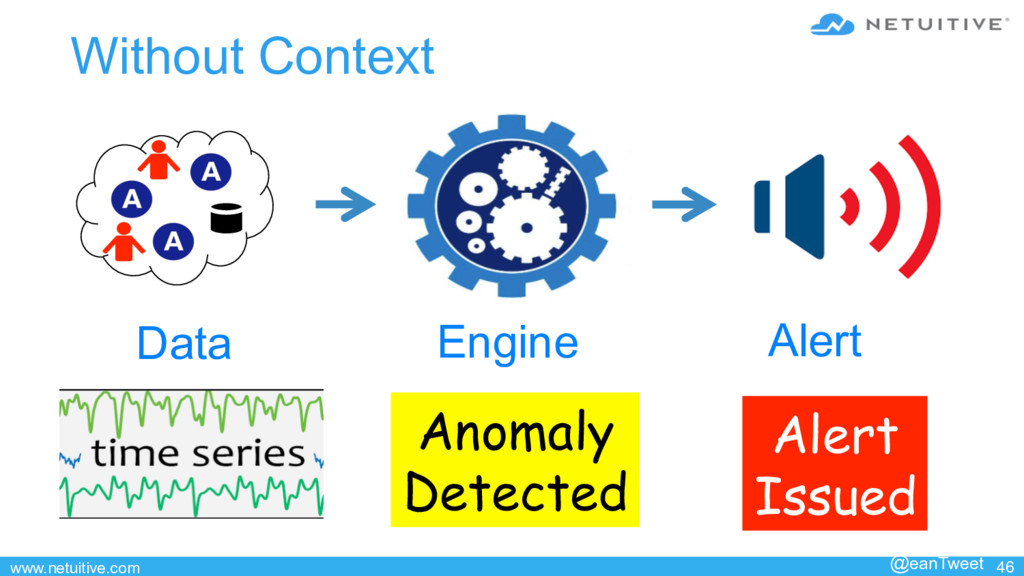
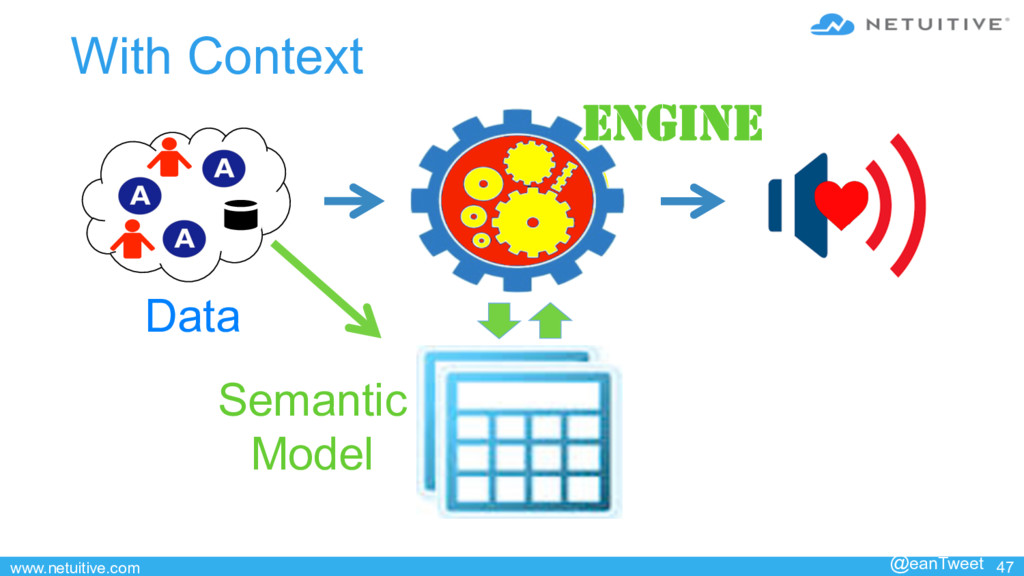
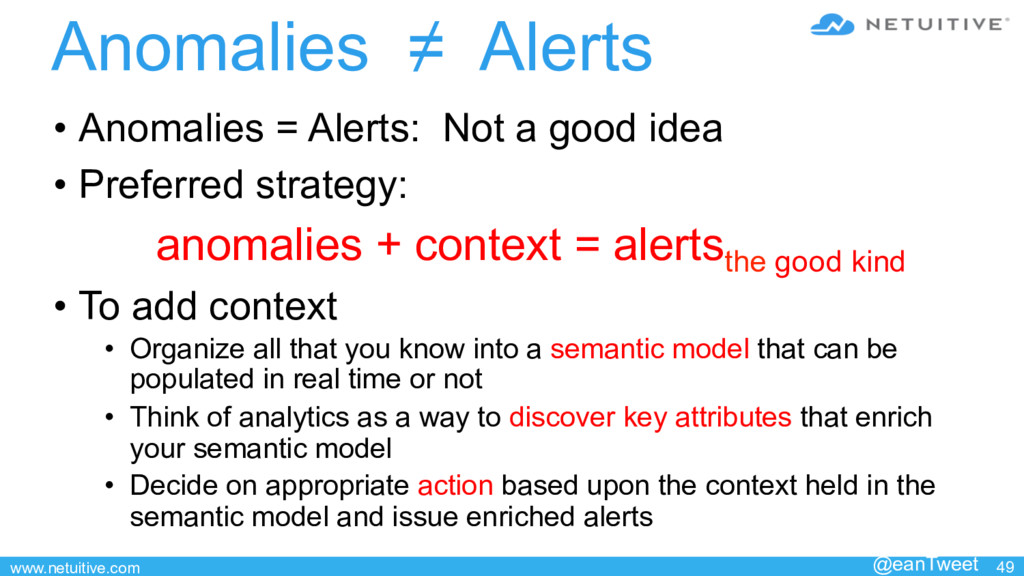
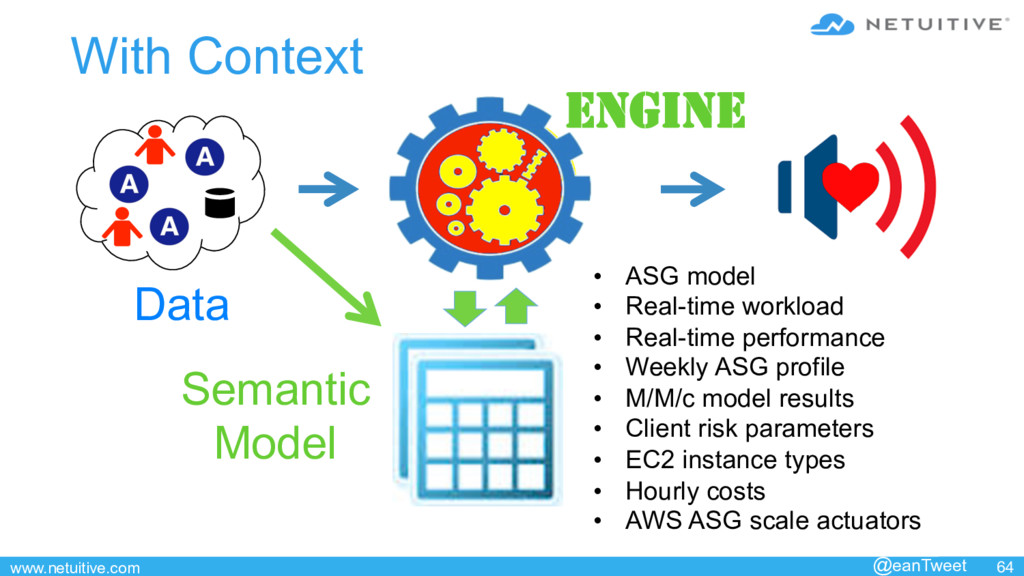
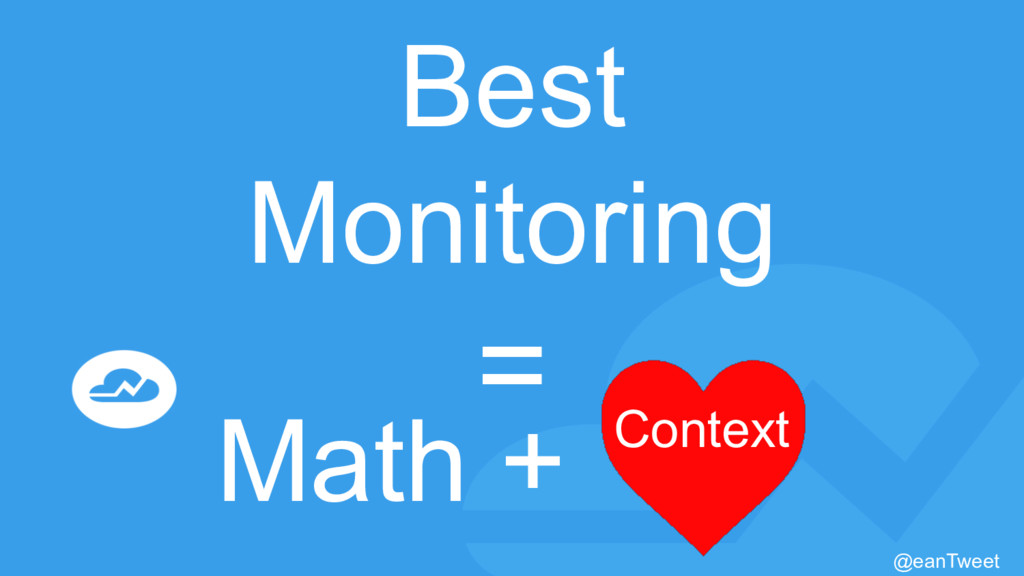
Detecting anomalies is easy. What’s hard is deciding what to do when you find one. A good decision takes a lot more information than what pure anomaly detection can provide.

This talk is about making your analytics accountable and provides practical steps to ensure that anomaly detection is helping, instead of pestering you with noise. Additionally, we cover strategies to ensure that mistakes, which are inevitable, aren’t repeated.

This talk provides a framework, lessons learned, and specific techniques for driving constant improvement in your monitoring’s decisions about what to do and when.
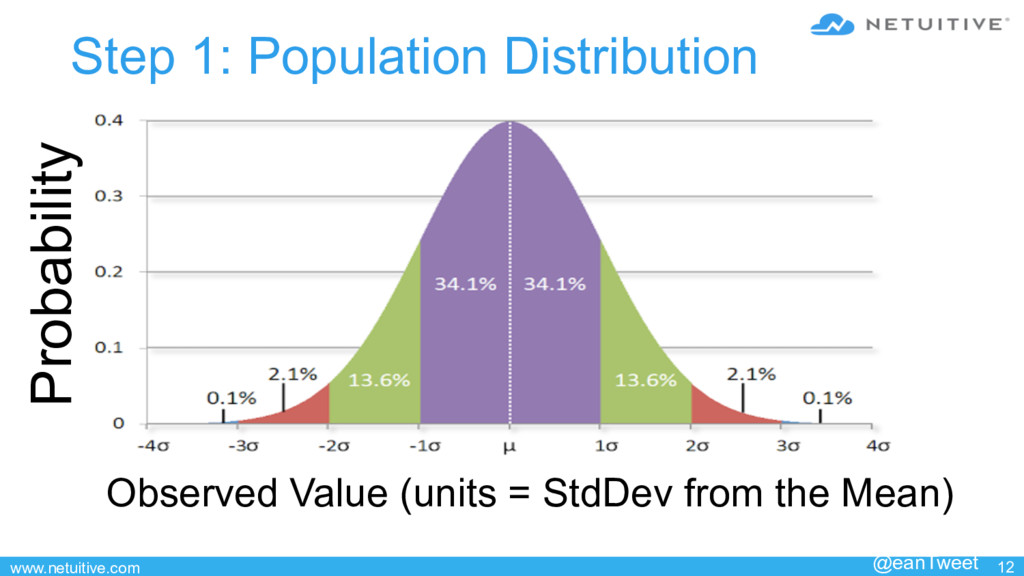
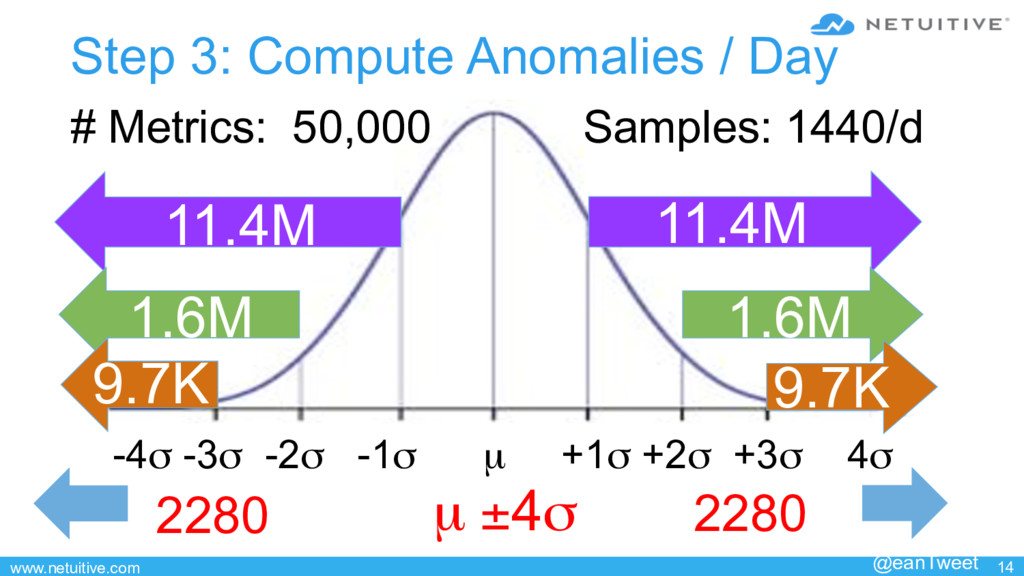
Elizabeth Nichols

May 24, 2017
Tweet

More Decks by Elizabeth Nichols

Other Decks in Technology

Transcript

  1. www.netuitive.com 10 1.  Alerts à Alert Fatigue 2.  Alerts =

    Anomalies 3.  Anomalies à Alert Fatigue 4.  How many anomalies can we reasonably expect? First Question: @eanTweet
  2. www.netuitive.com 13 Step 2: Population Size •  Consider one metric

    (time series) •  1 minute observations •  That amounts to: 365days 1year × 24hours day × 60min hour = 525600 obs / year / metric 525600 365 =1440 obs / day / metric •  # AWS CloudWatch metrics/EC2 = 14 •  # statsd metrics per server ~ 125 @eanTweet
  3. www.netuitive.com 14 Step 3: Compute Anomalies / Day # Metrics:

    50,000 11.4M 1.6M 2280 1.6M 1.6M 11.4M 2280 µ ±4σ -4σ -3σ -2σ -1σ µ +1σ +2σ +3σ 4σ 9.7K 9.7K @eanTweet Samples: 1440/d
  4. www.netuitive.com 15 #anomalies∈ (−∞,−4σ ]= 2×50,000×1440× P(X ≤ −4) where

    P(X ≤ −4) = 1 σ 2π e − (x−µ)2 2σ 2 −∞ −4 ∫ dx = 3.167124e-05 @eanTweet
  5. www.netuitive.com 17 1.  Decision required for each anomaly 2.  Anomalies

    = 3.  Likely: #FP >> #TP 4.  Decision not to alert à 5.  Potential à FN 6.  FP is bad; FN is ugly To Alert … or … Not to Alert @eanTweet {TP}∪{FP}
  6. www.netuitive.com 38 Basic Context Cont ext Data Value Semantic Engine

    Rule •  Streaming •  Asynchronous •  Synchronous Tag Server Metric Alerts Alert @eanTweet
  7. www.netuitive.com 39 Context: Semantic Model @eanTweet Think of analytics as

    attribute discovery Context Data Semantic Model Analytics
  8. www.netuitive.com 41 EC2 EC2 EC2 ASG Service Model Arrival Rate

    •  Queue Length •  Response Time Completion Rate •  # EC2’s •  Mean CPU Utilization Queueing Recommendation •  # EC2’s •  Mean CPU Utilization Latency Quant Models Instance Instance Instance Auto Scaling Group Elastic Load Balancer @eanTweet
  9. www.netuitive.com 44 Example: Policy for Action For all EC2’s in

    US West Region with tag=“PROD” in ASGx … If AvgCpuUtil(EC2) deviating & RunQ > 2*(# CPUs) & ReqRate(ELBx ) !deviating & AvgLatency(ELBx ) > 2 sec For duration >=10 minutes On a week day Send critical alert Invoke autoscaleUp on ASGx @eanTweet
  10. www.netuitive.com 45 Alerts With Context @eanTweet •  Annotations •  Conditions

    Results •  Links to runbook •  Affected services •  Timestamp •  Severity •  Duration •  Images Context Analytics+Policy + Semantic Model Data Alerts
  11. www.netuitive.com 49 Anomalies ≠ Alerts •  Anomalies = Alerts: Not

    a good idea •  Preferred strategy: anomalies + context = alertsthe good kind •  To add context •  Organize all that you know into a semantic model that can be populated in real time or not •  Think of analytics as a way to discover key attributes that enrich your semantic model •  Decide on appropriate action based upon the context held in the semantic model and issue enriched alerts @eanTweet
  12. www.netuitive.com 53 Report: ASG Capacity vs Utilization ASG Group: #

    Nodes Provisioned 11 ASG Group: 95% Percentile CPU Utilization Time $ $ $ $ $ $ $ $ $ $ $ $ $ $ $ $ $ $ $ $ $ $ $ $ @eanTweet
  13. www.netuitive.com 54 Make It Work Max Workload Time in Hours

    à # Nodes = 11 Response Time < 3 sec ASG Nodes Workload Max Requests/sec Requests/sec @eanTweet
  14. www.netuitive.com 56 EC2 EC2 EC2 ASG Service Model Arrival Rate

    •  Queue Length •  Response Time Completion Rate •  # EC2’s •  Mean CPU Utilization Queueing Recommendation •  # EC2’s •  Mean CPU Utilization Latency Quant Models Instance Instance Instance Auto Scaling Group Elastic Load Balancer @eanTweet
  15. www.netuitive.com 57 Queueing Model queue queue queue EC2 EC2 EC2

    Arrivals Completions Arrival Rate •  Queue Length •  Service Time Completion Rate •  # EC2’s •  Mean CPU Utilization Latency @eanTweet
  16. M/M/c Queuing Model •  λ = Arrival rate with Poisson

    distribution •  µ = Average service time with exponential distribution •  c = # servers •  Servers serve from the front of the queue (FCFS) •  If less than c jobs, some servers will be idle •  If greater than c jobs, some will queue in a buffer •  The buffer is of infinite size @eanTweet
  17. Equations Response time = intensity = Ref: https://en.wikipedia.org/wiki/M/M/c_queue @eanTweet The

    probability that an arriving job is forced to queue is given by Erlange’s C formula:
  18. M/M/c Model Results 2 4 6 8 10 µ =

    1.0s Response Time @eanTweet
  19. M/M/c Model Application INPUT: • Service Time (µ) • Arrival rate of

    requests (λ) • Response Time goal (3sec) OUTPUT: • Actual Response Time • Mapping: arrival rate à # nodes with constraint: response time < 3sec @eanTweet
  20. www.netuitive.com 63 Risk Mitigation Factors Max scale-in rate: Max scale-out

    rate: Min instance counts: Zero thresholds: Target response time: Workload metric: Update frequency: 3 sec aws.elb.elb-c.arrivalrate hourly 1% 2 3 unlimited @eanTweet
  21. www.netuitive.com 64 With Context Context @eanTweet Data Semantic Model ENGINE

    •  ASG model •  Real-time workload •  Real-time performance •  Weekly ASG profile •  M/M/c model results •  Client risk parameters •  EC2 instance types •  Hourly costs •  AWS ASG scale actuators