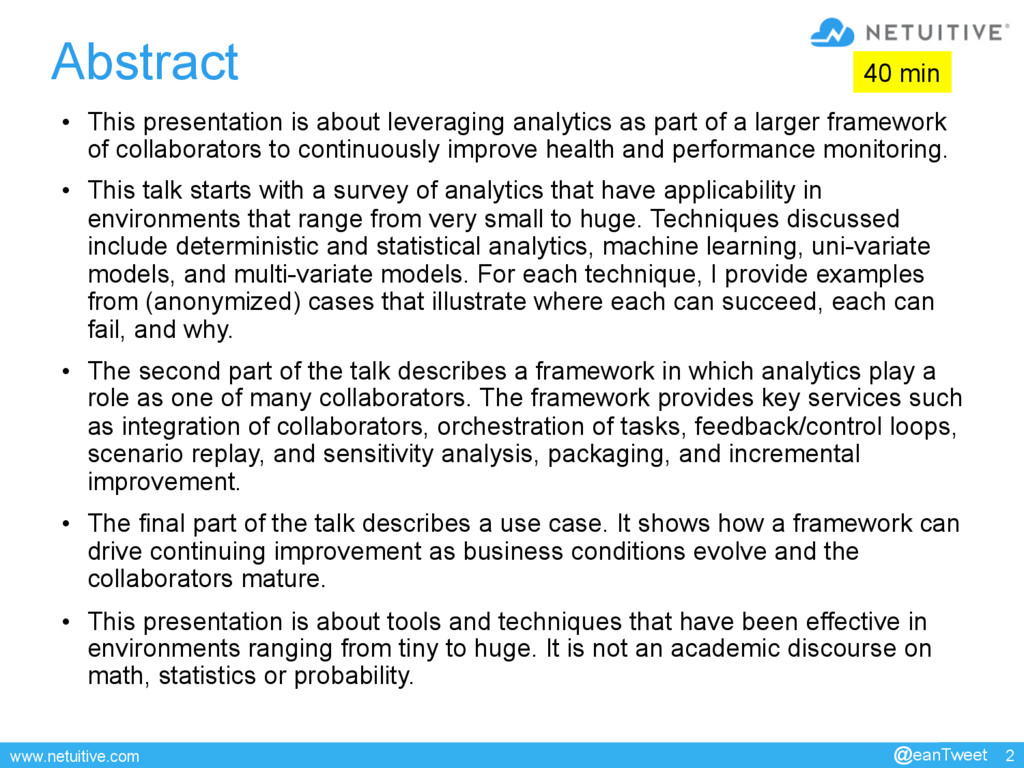
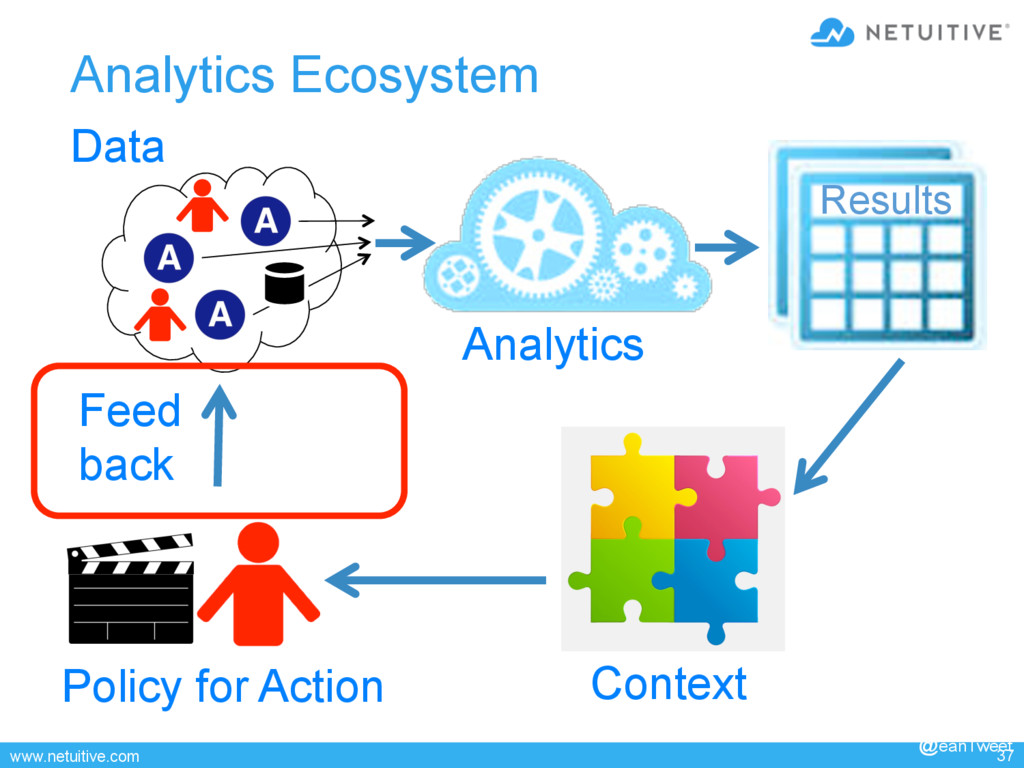
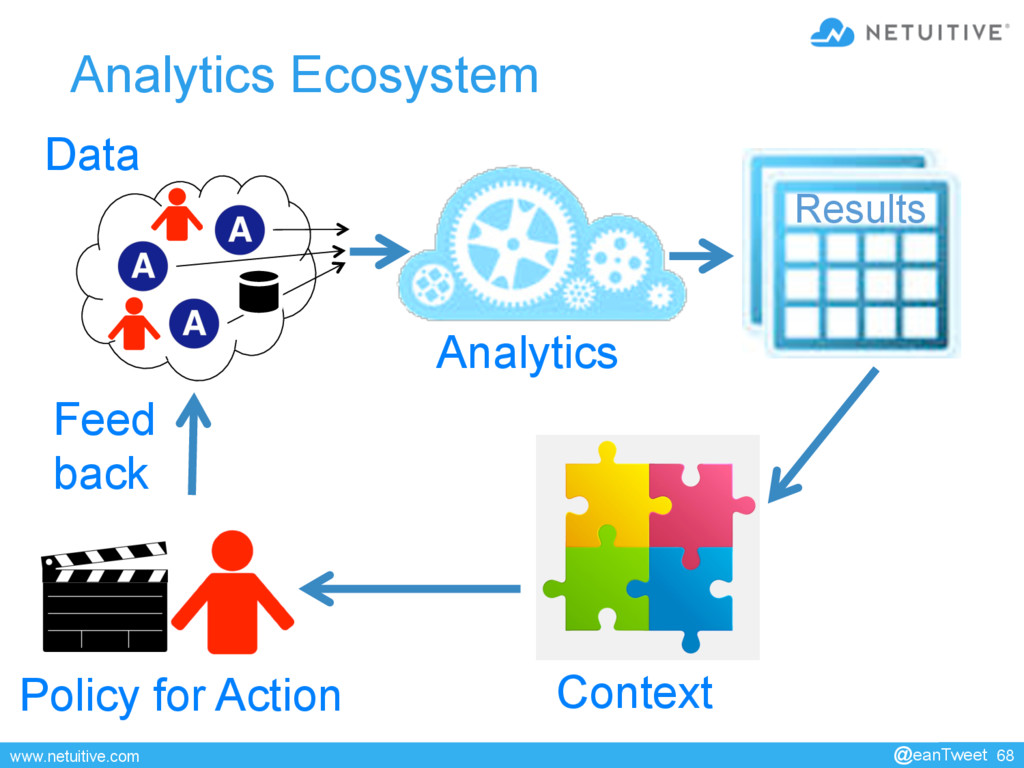
This presentation is about leveraging analytics as part of a larger framework of collaborators to continuously improve health and performance monitoring.
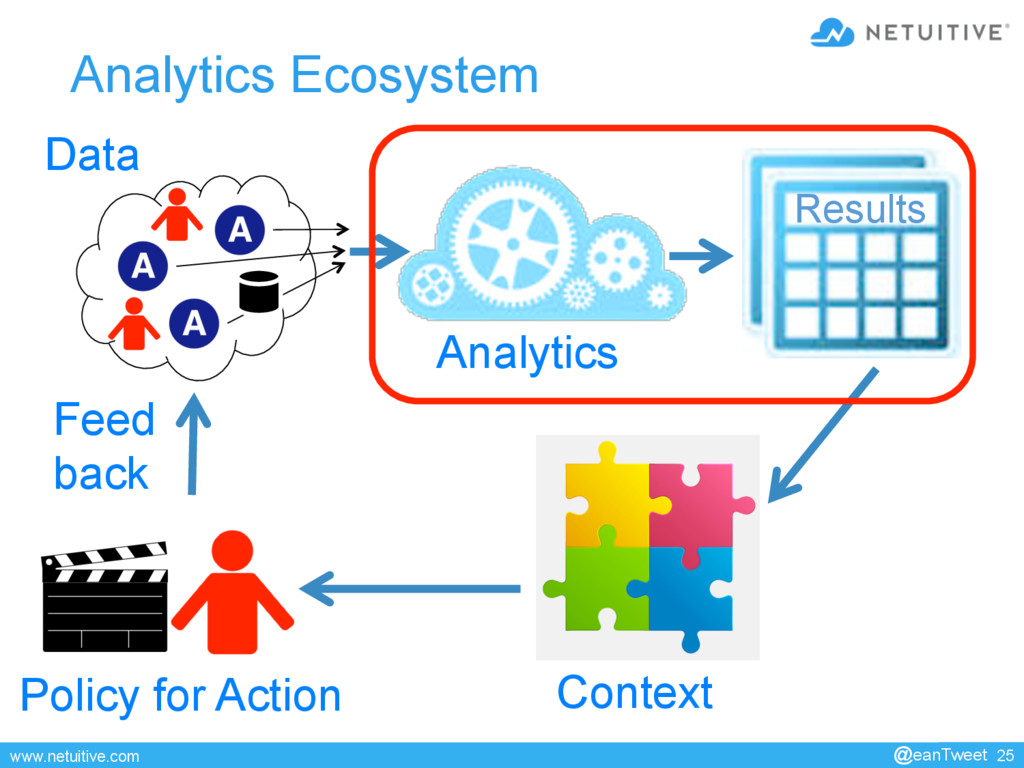
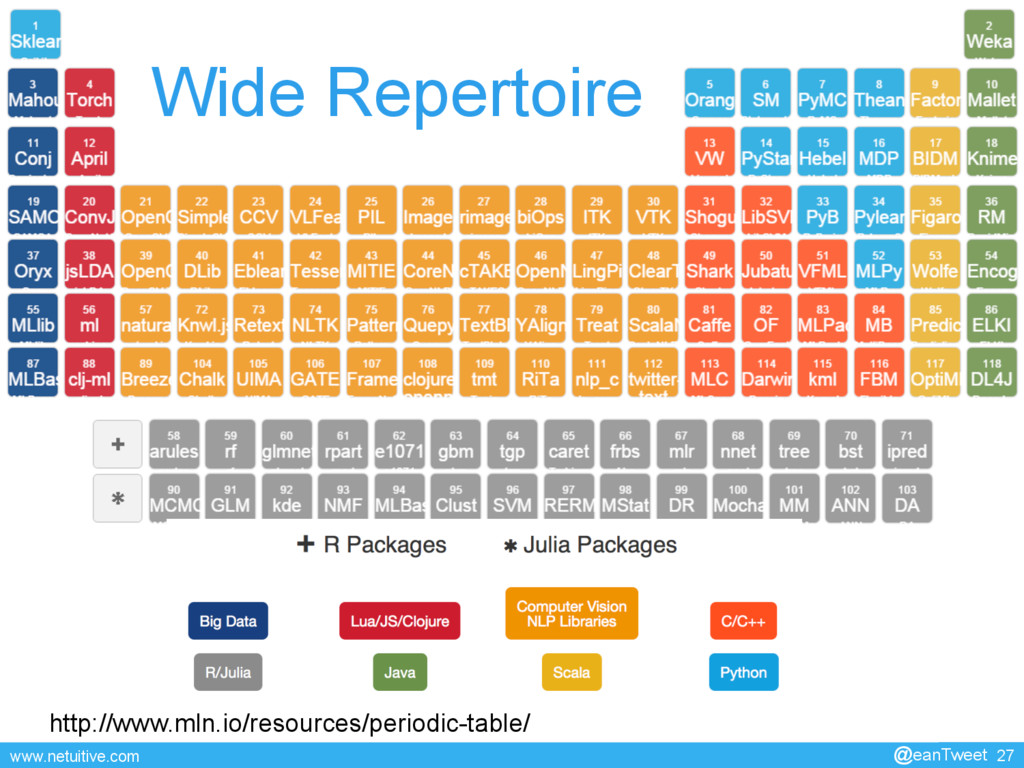
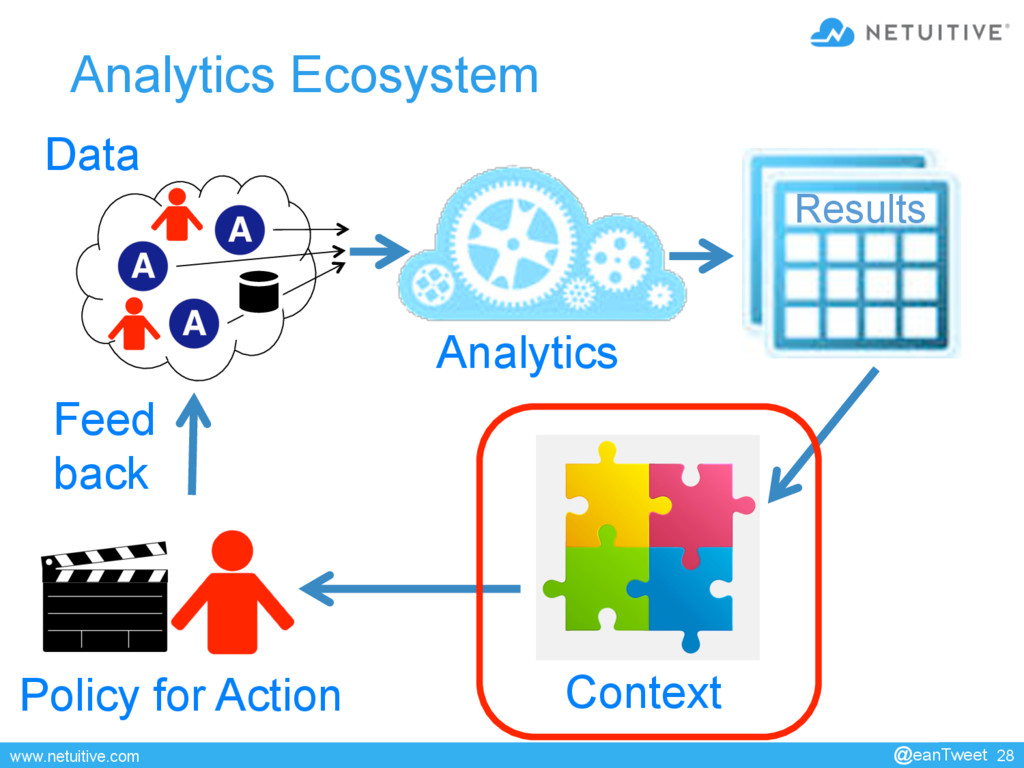
as part of a larger framework of collaborators to continuously improve health and performance monitoring. • This talk starts with a survey of analytics that have applicability in environments that range from very small to huge. Techniques discussed include deterministic and statistical analytics, machine learning, uni-variate models, and multi-variate models. For each technique, I provide examples from (anonymized) cases that illustrate where each can succeed, each can fail, and why. • The second part of the talk describes a framework in which analytics play a role as one of many collaborators. The framework provides key services such as integration of collaborators, orchestration of tasks, feedback/control loops, scenario replay, and sensitivity analysis, packaging, and incremental improvement. • The final part of the talk describes a use case. It shows how a framework can drive continuing improvement as business conditions evolve and the collaborators mature. • This presentation is about tools and techniques that have been effective in environments ranging from tiny to huge. It is not an academic discourse on math, statistics or probability. 40 min @eanTweet
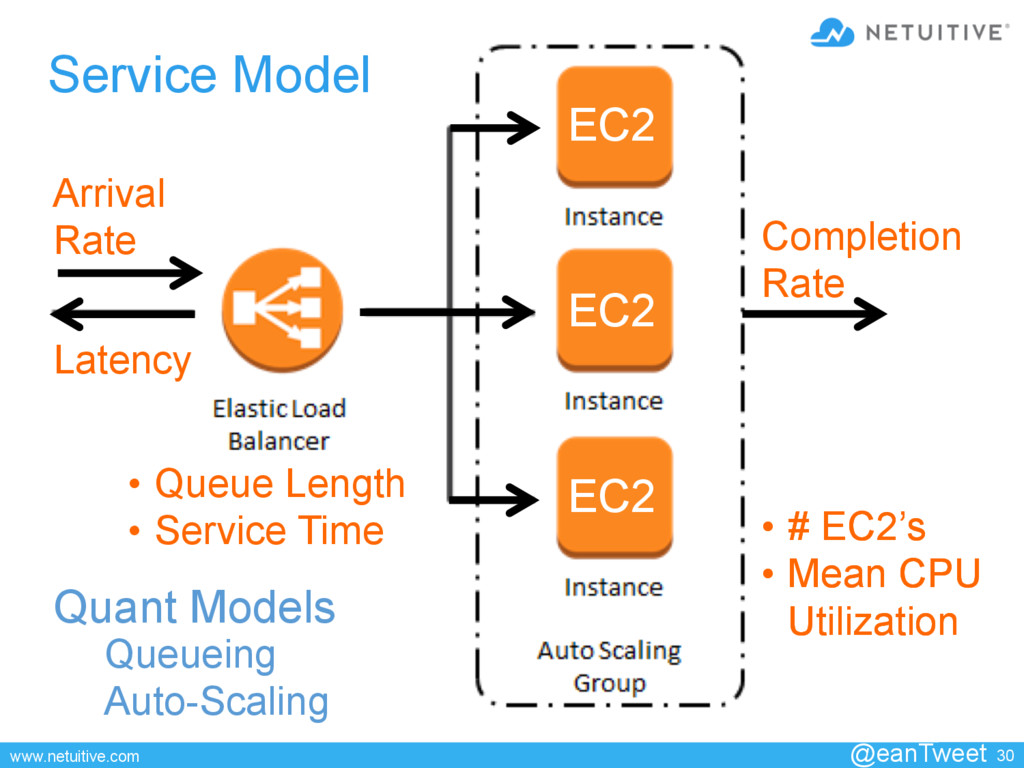
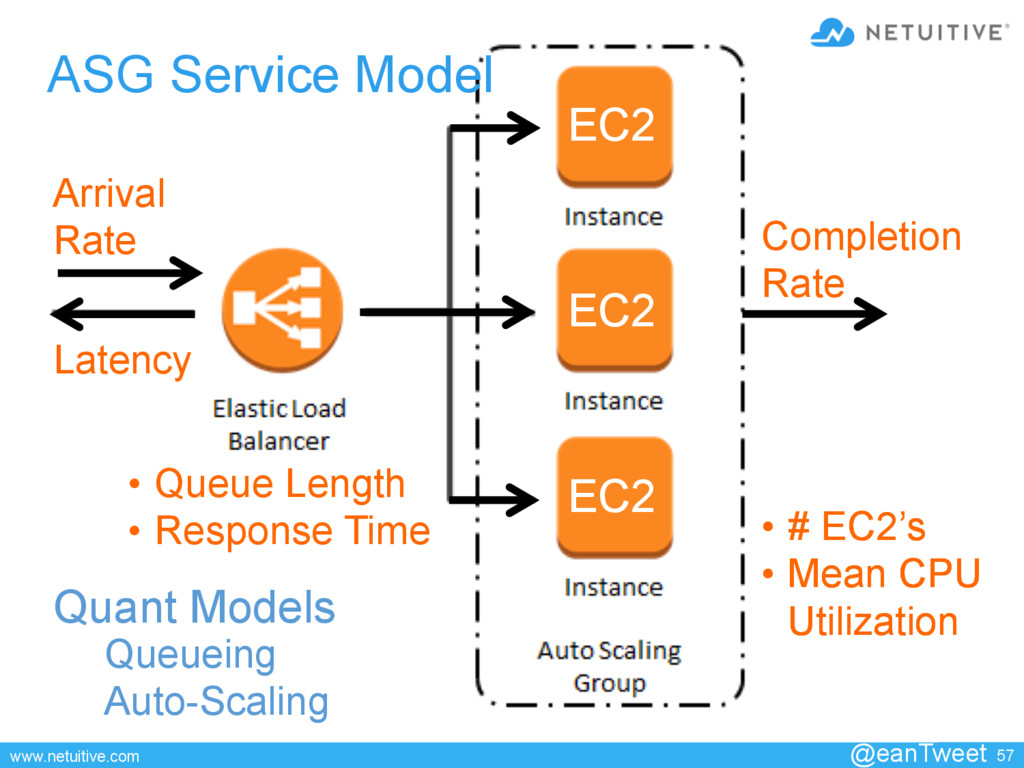
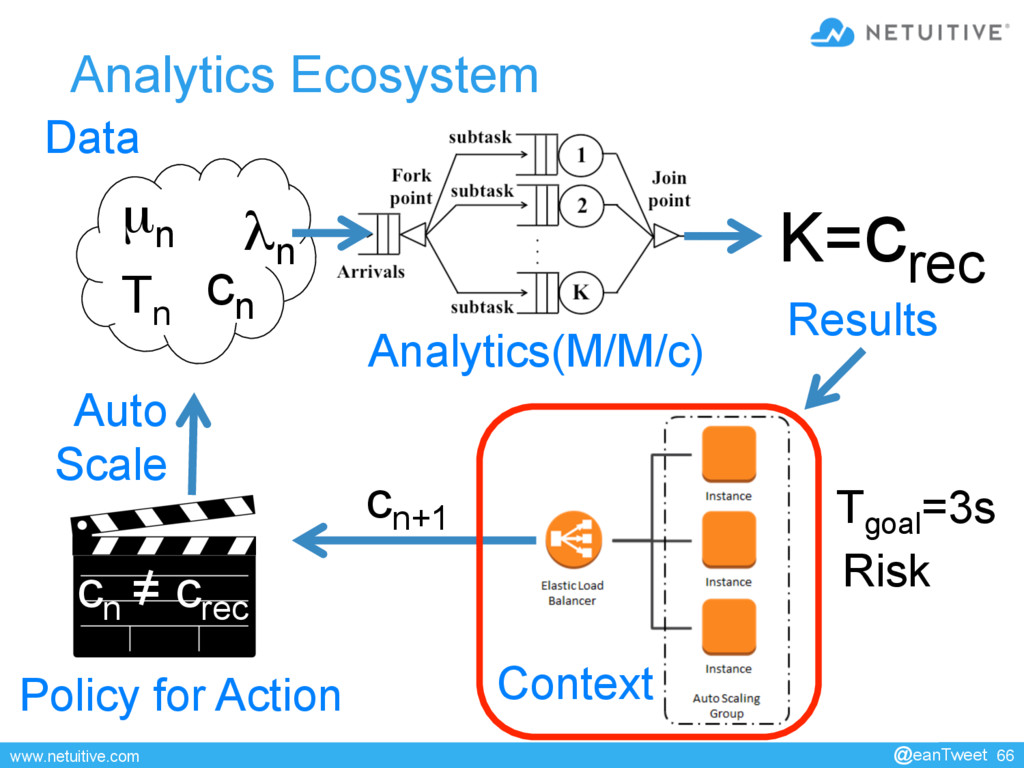
• Queue Length • Service Time Completion Rate • # EC2’s • Mean CPU Utilization Queueing Auto-Scaling • # EC2’s • Mean CPU Utilization Latency Quant Models
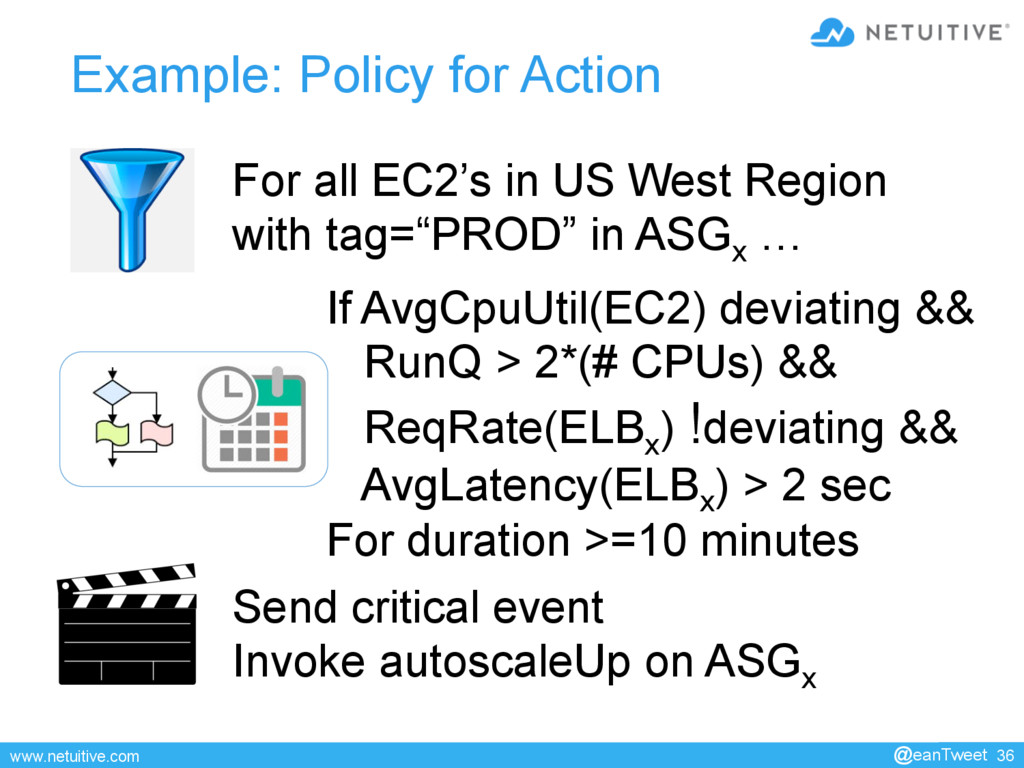
US West Region with tag=“PROD” in ASGx … If AvgCpuUtil(EC2) deviating && RunQ > 2*(# CPUs) && ReqRate(ELBx ) !deviating && AvgLatency(ELBx ) > 2 sec For duration >=10 minutes Send critical event Invoke autoscaleUp on ASGx @eanTweet
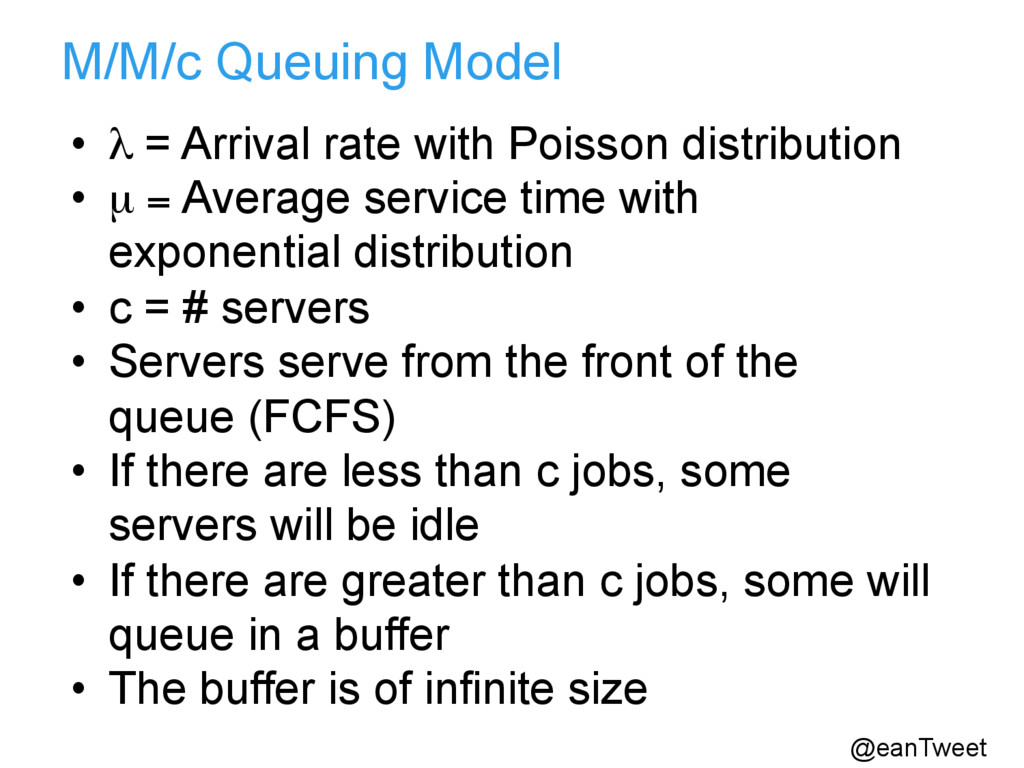
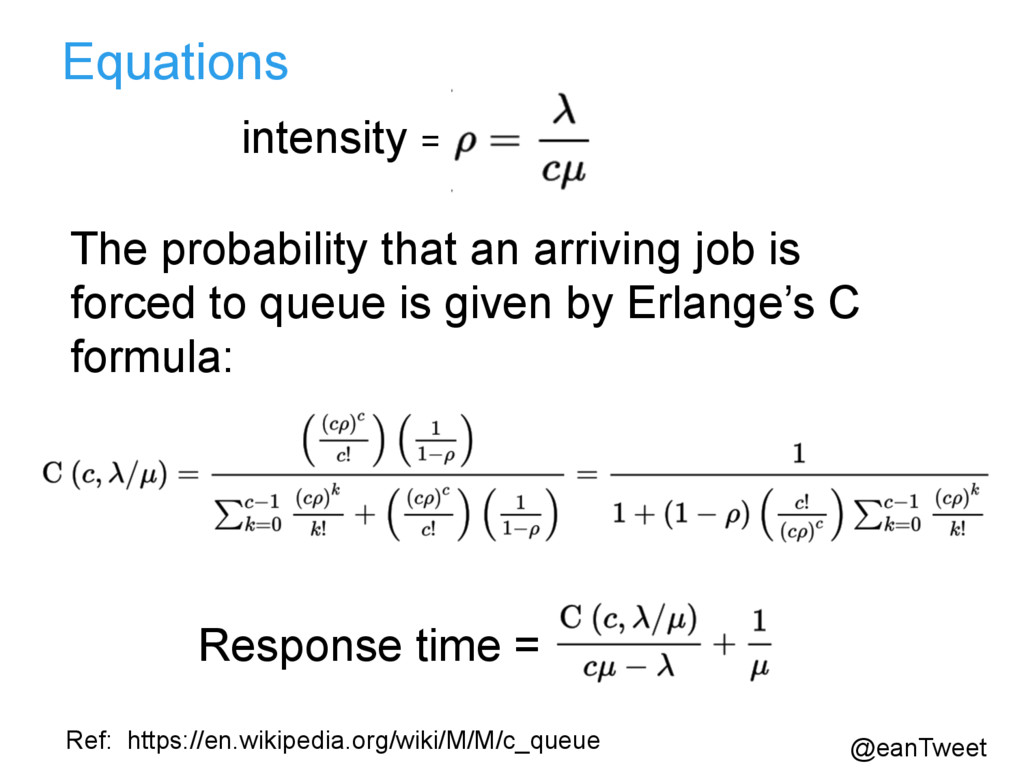
distribution • µ = Average service time with exponential distribution • c = # servers • Servers serve from the front of the queue (FCFS) • If there are less than c jobs, some servers will be idle • If there are greater than c jobs, some will queue in a buffer • The buffer is of infinite size @eanTweet