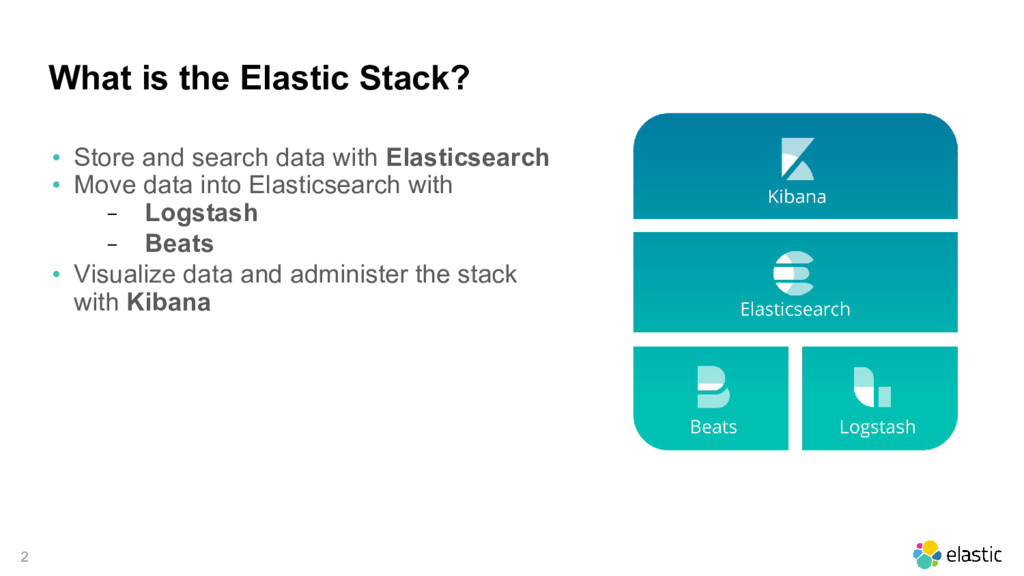
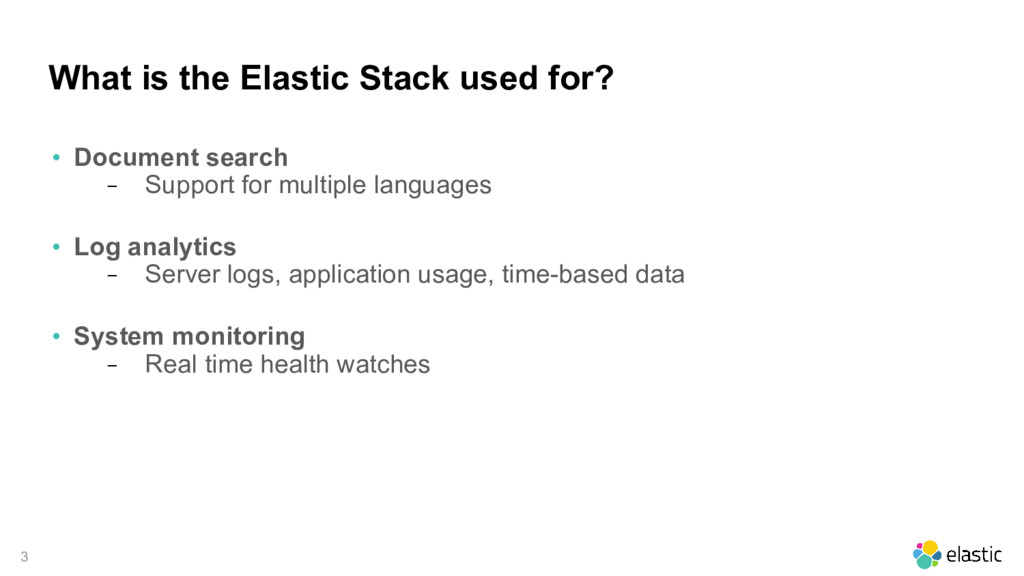
search − Support for multiple languages • Log analytics − Server logs, application usage, time-based data • System monitoring − Real time health watches
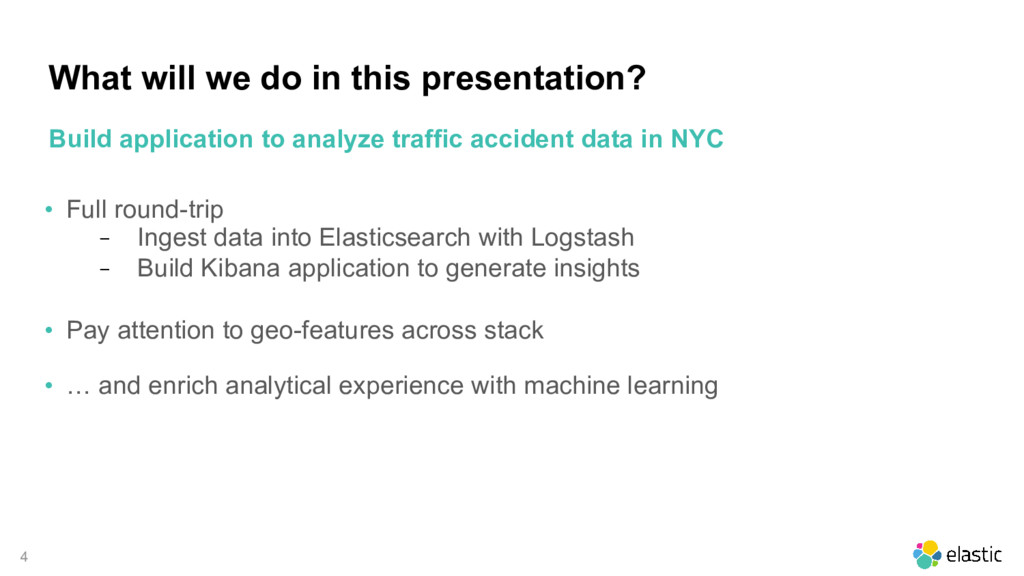
round-trip − Ingest data into Elasticsearch with Logstash − Build Kibana application to generate insights • Pay attention to geo-features across stack • … and enrich analytical experience with machine learning Build application to analyze traffic accident data in NYC
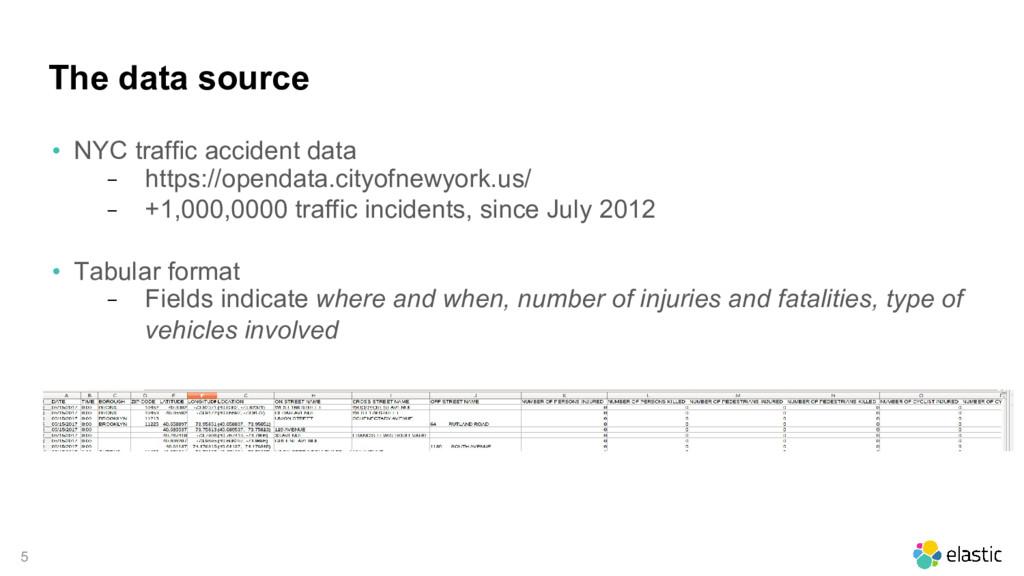
https://opendata.cityofnewyork.us/ − +1,000,0000 traffic incidents, since July 2012 • Tabular format − Fields indicate where and when, number of injuries and fatalities, type of vehicles involved
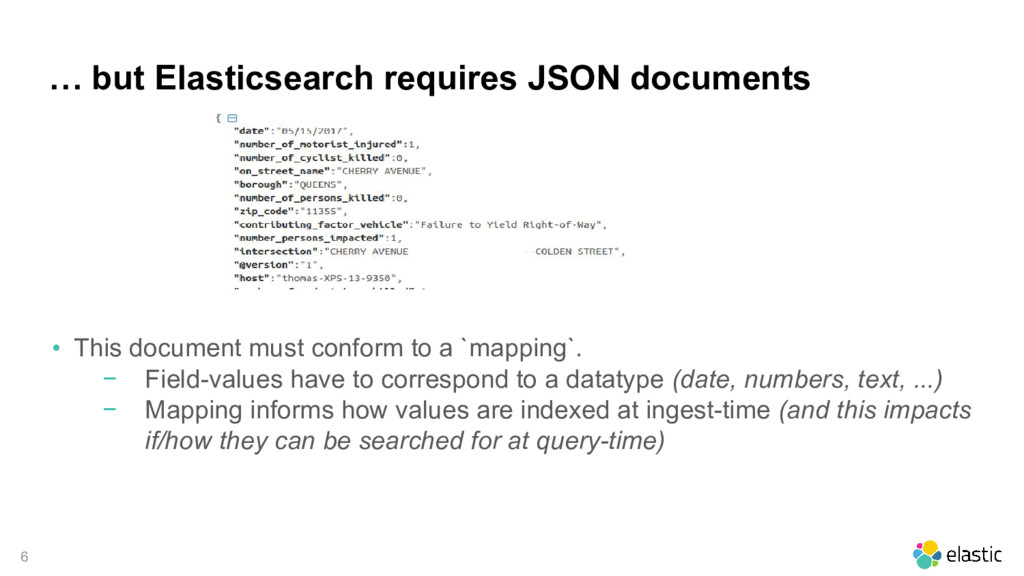
must conform to a `mapping`. − Field-values have to correspond to a datatype (date, numbers, text, ...) − Mapping informs how values are indexed at ingest-time (and this impacts if/how they can be searched for at query-time)
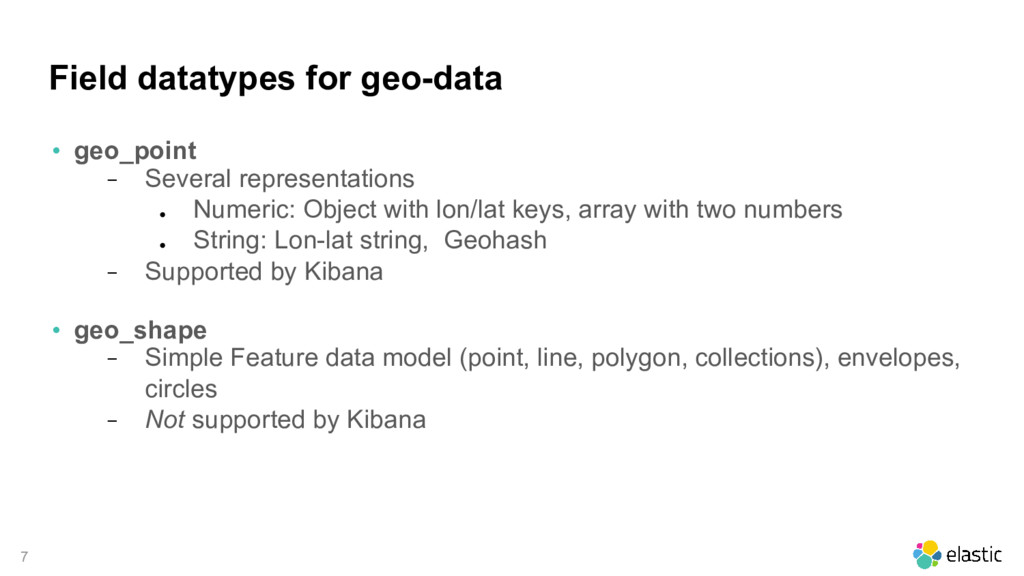
• Numeric: Object with lon/lat keys, array with two numbers • String: Lon-lat string, Geohash − Supported by Kibana • geo_shape − Simple Feature data model (point, line, polygon, collections), envelopes, circles − Not supported by Kibana
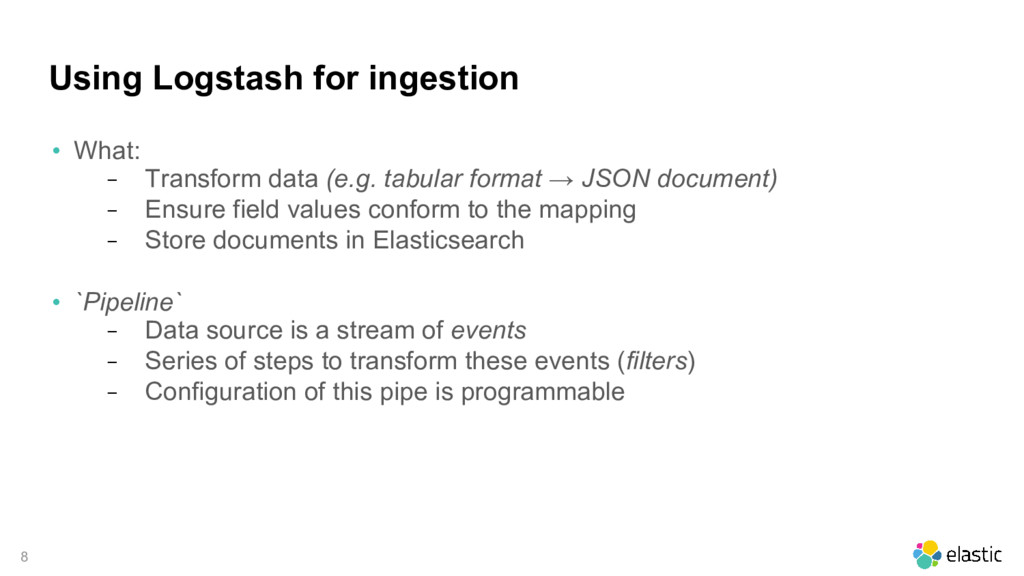
(e.g. tabular format → JSON document) − Ensure field values conform to the mapping − Store documents in Elasticsearch • `Pipeline` − Data source is a stream of events − Series of steps to transform these events (filters) − Configuration of this pipe is programmable
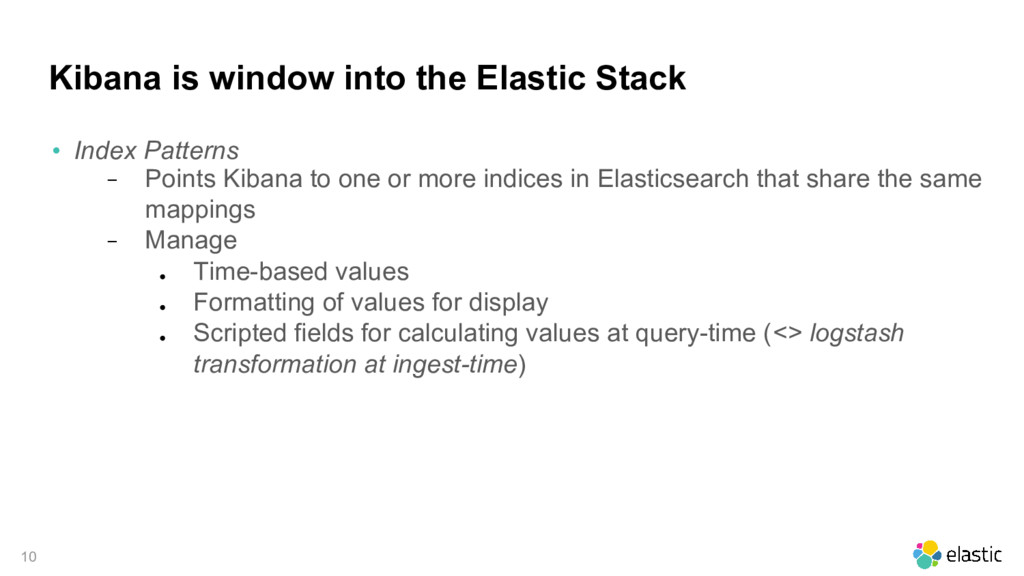
Patterns − Points Kibana to one or more indices in Elasticsearch that share the same mappings − Manage • Time-based values • Formatting of values for display • Scripted fields for calculating values at query-time (<> logstash transformation at ingest-time)
REST-API with JSON-base query language − Can aggregate results (similar to “group by” in SQL) Kibana Visualizations display the result of aggregations, not the values of individual documents − This scales better − Different data-types have different type of roll-up • e.g. • seconds, minutes, hours for date values • ranges for number values
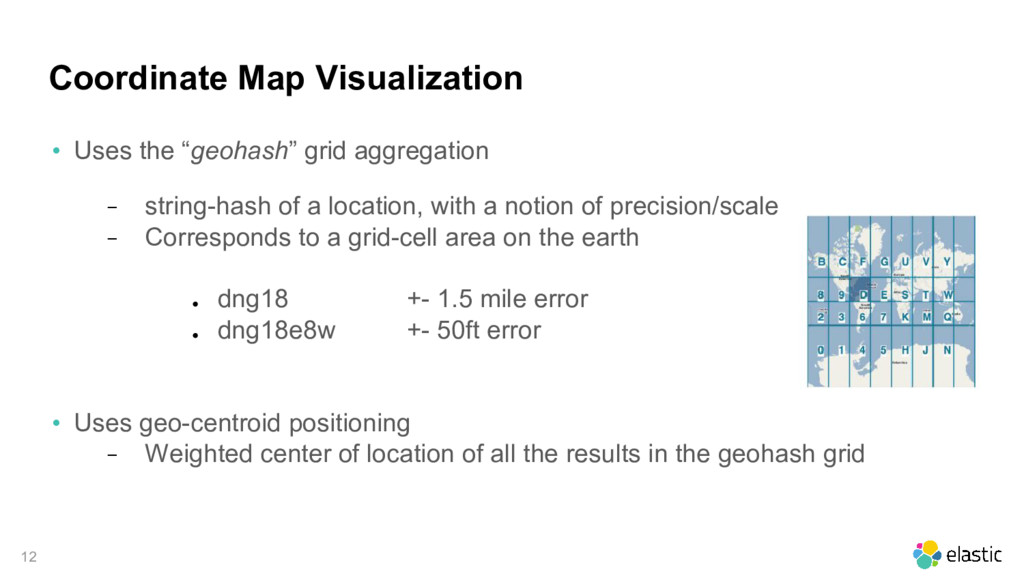
a location, with a notion of precision/scale − Corresponds to a grid-cell area on the earth • dng18 +- 1.5 mile error • dng18e8w +- 50ft error • Uses geo-centroid positioning − Weighted center of location of all the results in the geohash grid Coordinate Map Visualization
map service and data used by Kibana − road map image service − example boundary data (world countries and US States) • Requires X-Pack install for access to all zoom levels • Link outside services to Kibana − image services • TMS: http://my.map.service/{z}/{x}/{y}.png • OGC-WMS − geojson boundary data
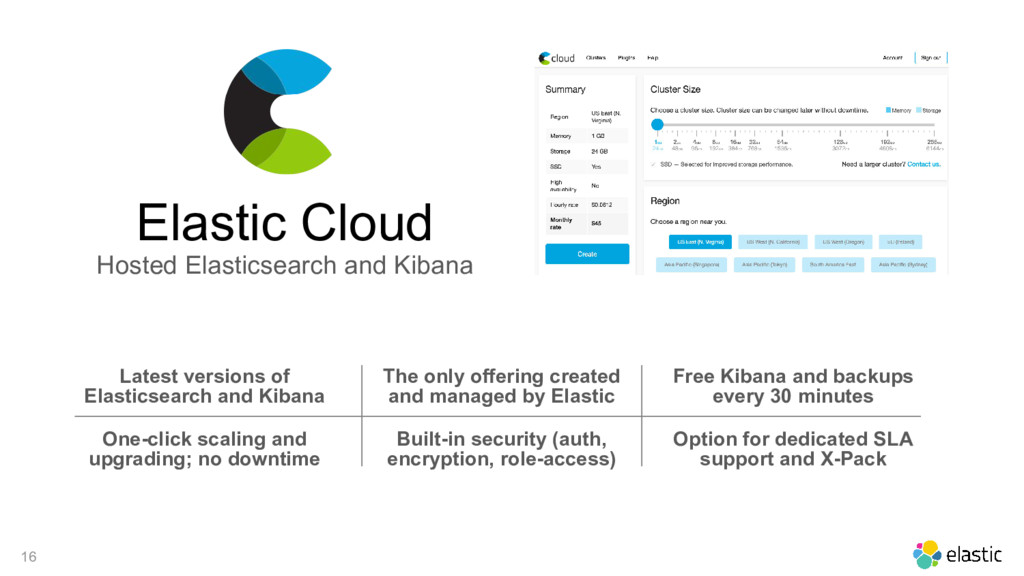
Elasticsearch and Kibana One-click scaling and upgrading; no downtime Built-in security (auth, encryption, role-access) Option for dedicated SLA support and X-Pack The only offering created and managed by Elastic Free Kibana and backups every 30 minutes
![1 Thomas Neirynck, Brandon Kobel [email protected], [email protected] How to analyze](https://files.speakerdeck.com/presentations/facb81eabb5c44399ee27151b3c2eb49/slide_0.jpg)
![9 ... filter { csv { Columns => ["date","time","borough","zip_code","latitude","longitude", ...]](https://files.speakerdeck.com/presentations/facb81eabb5c44399ee27151b3c2eb49/slide_8.jpg)