This talk was presented at the inaugural Elastic{ON} conference, http://elasticon.com
Session Abstract:
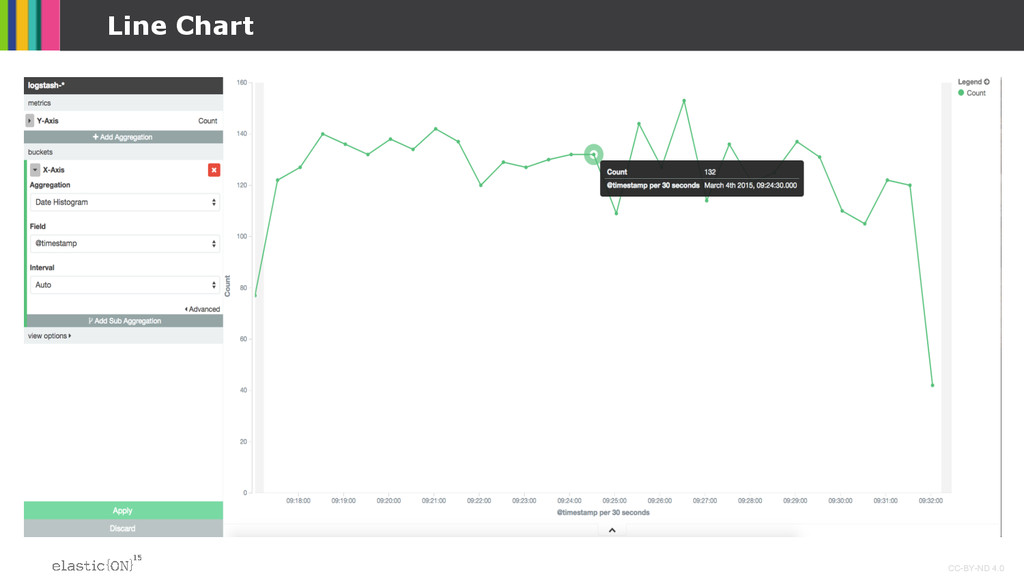
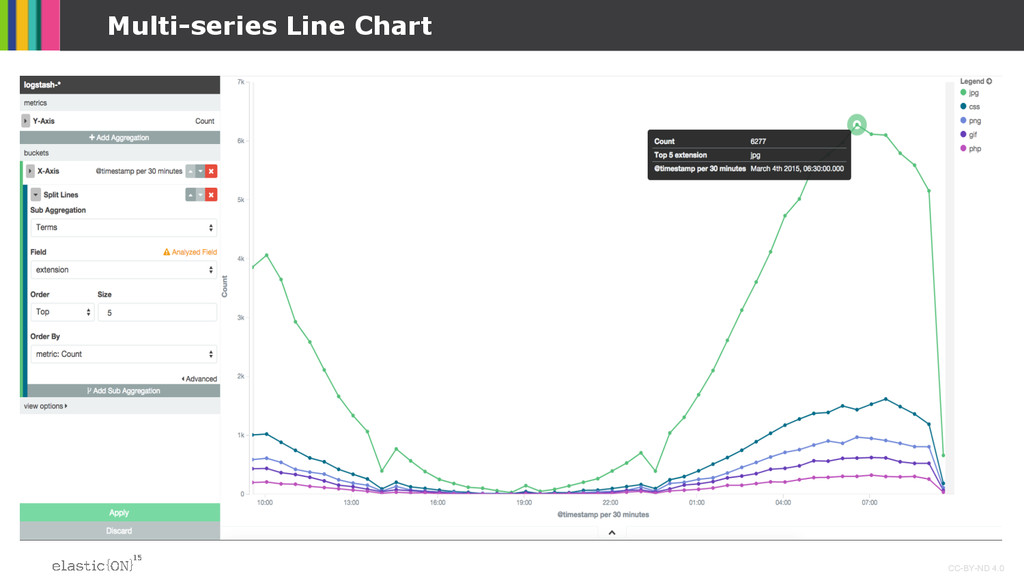
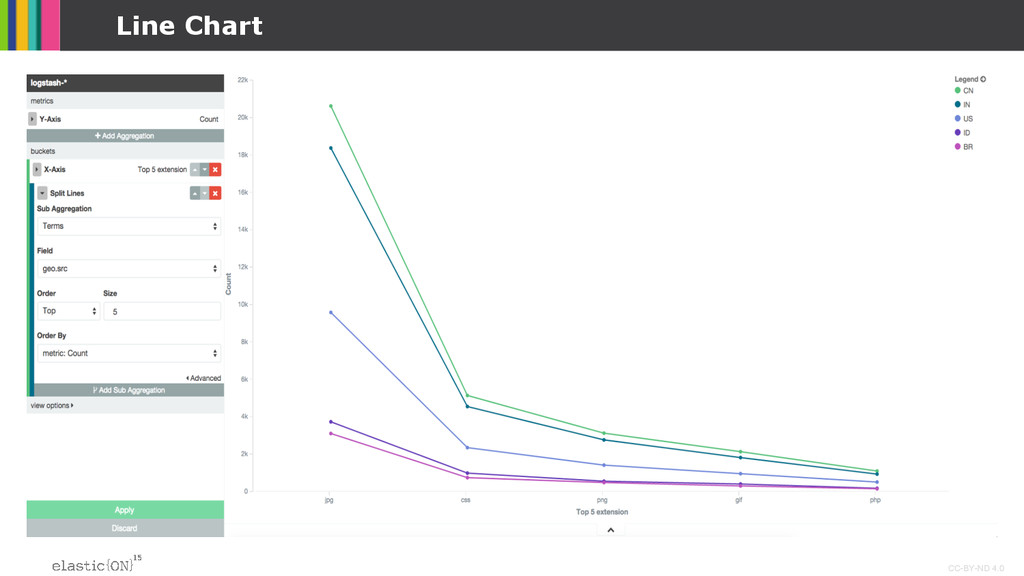
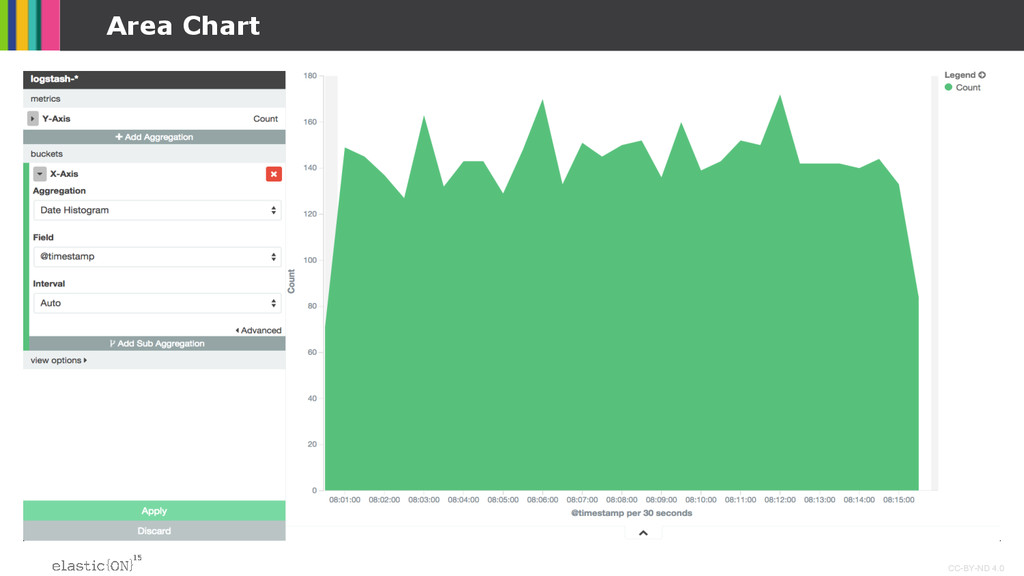
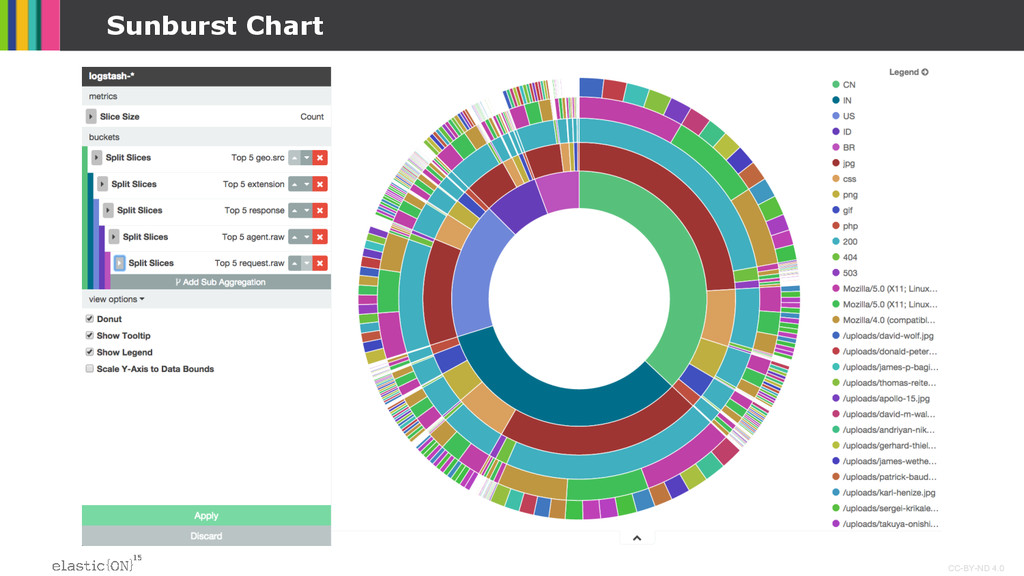
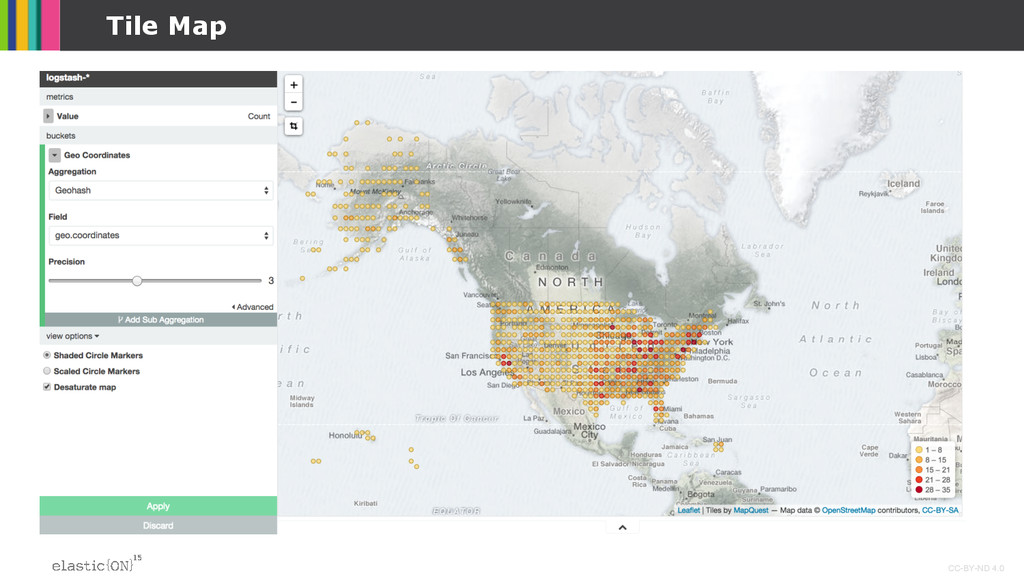
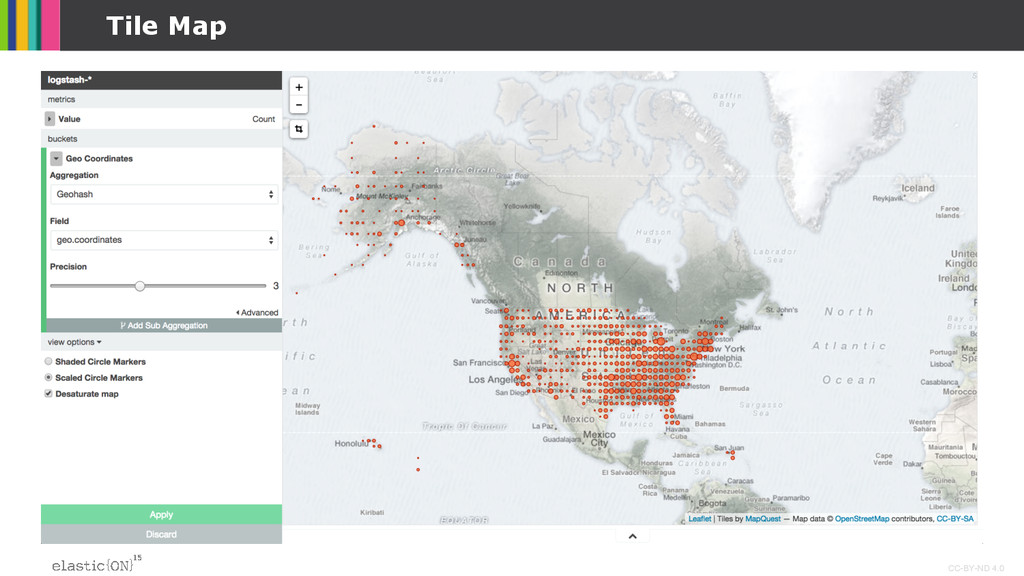
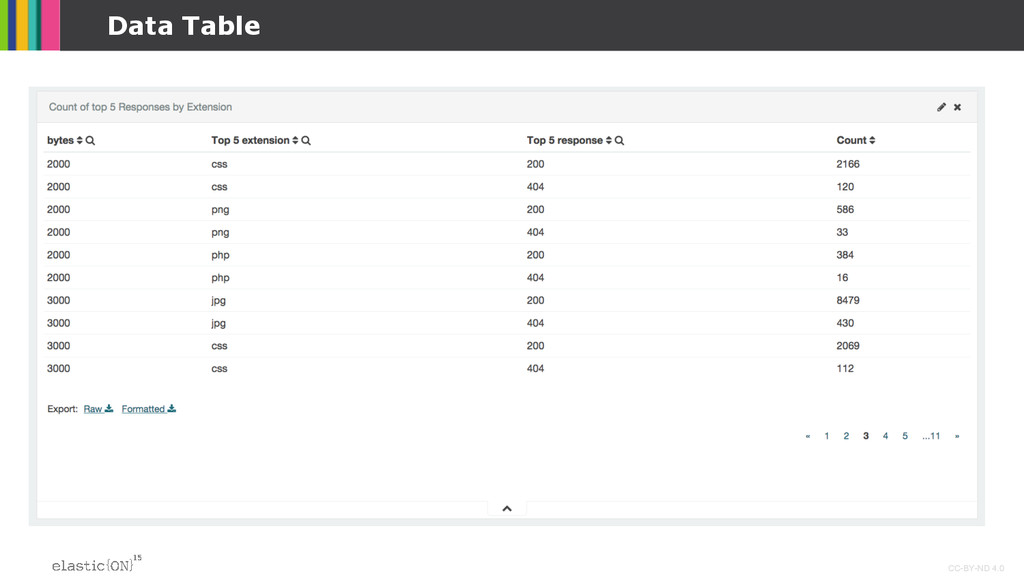
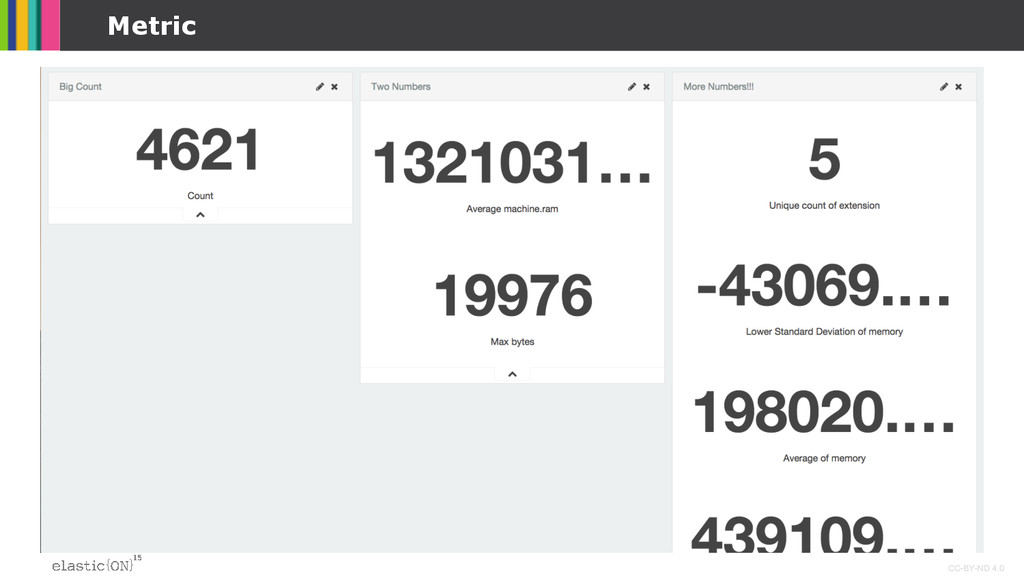
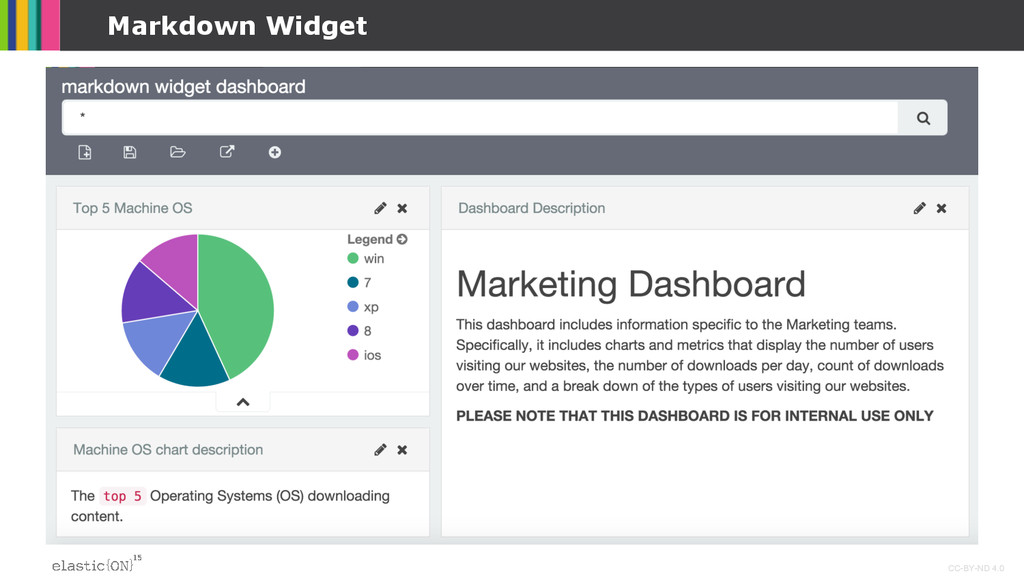
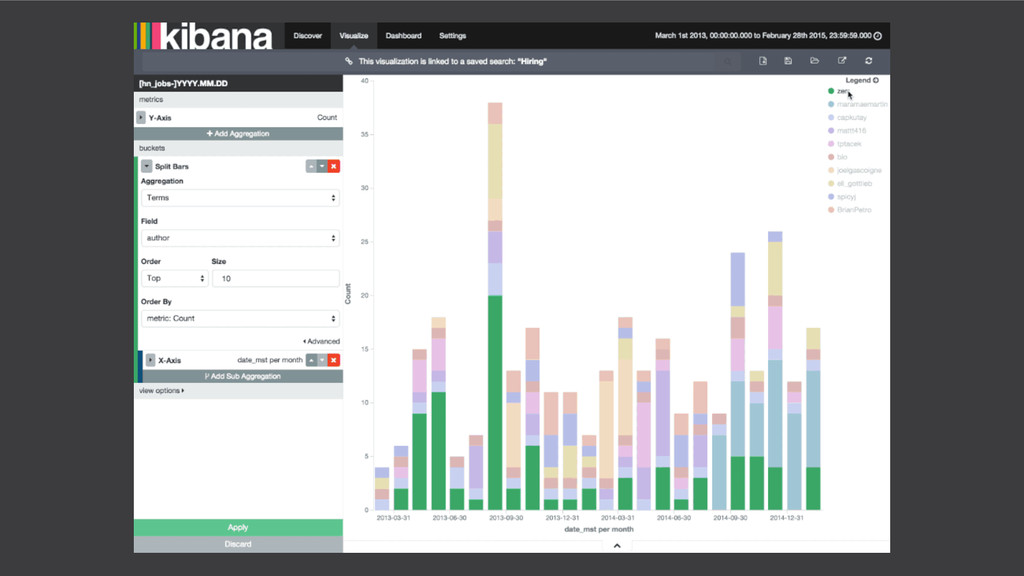
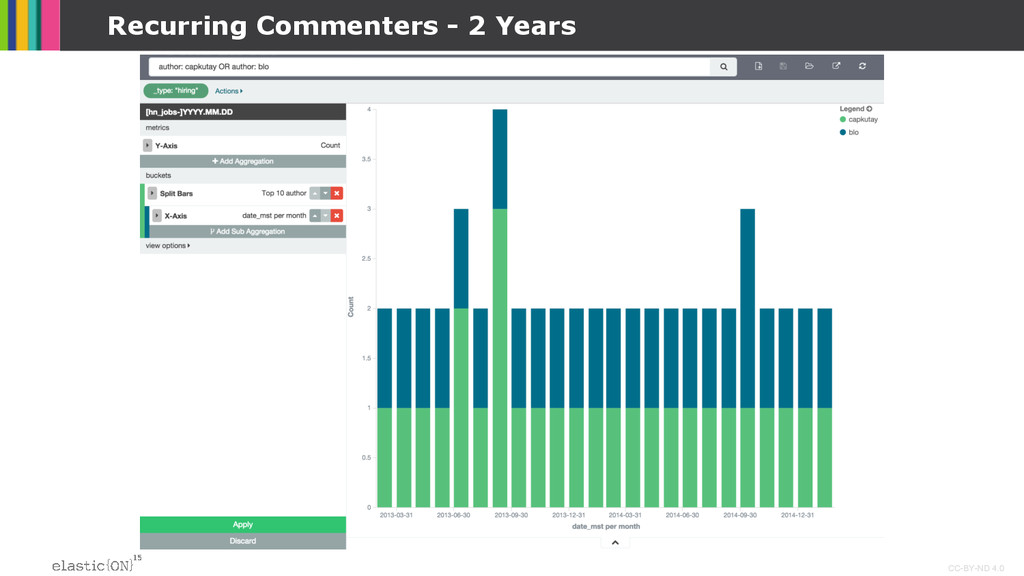
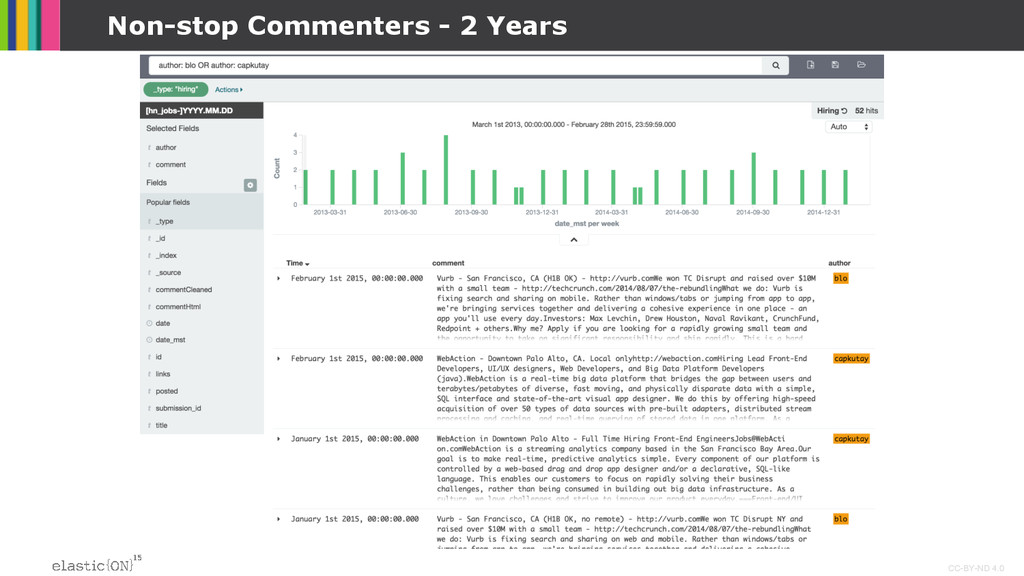
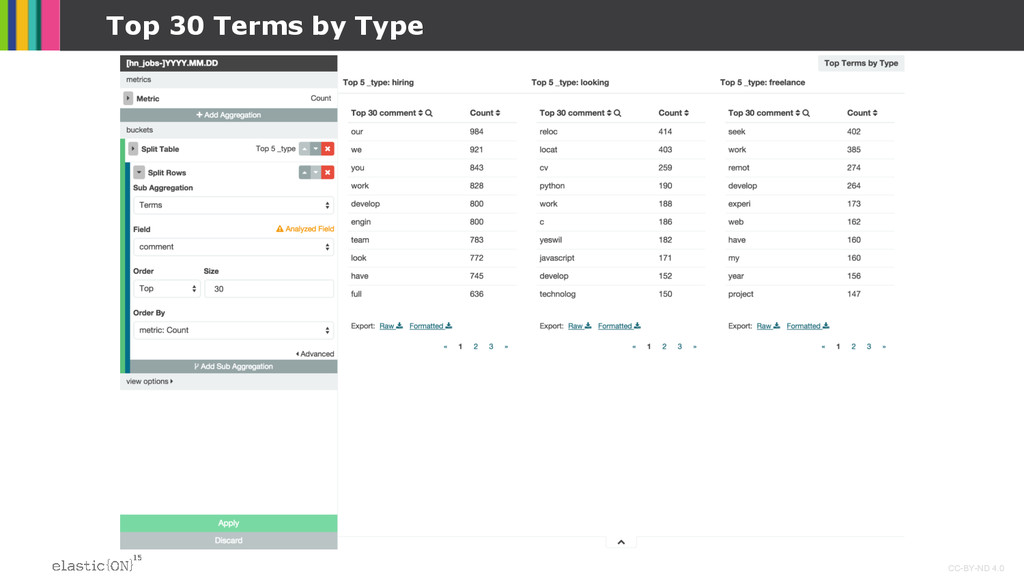
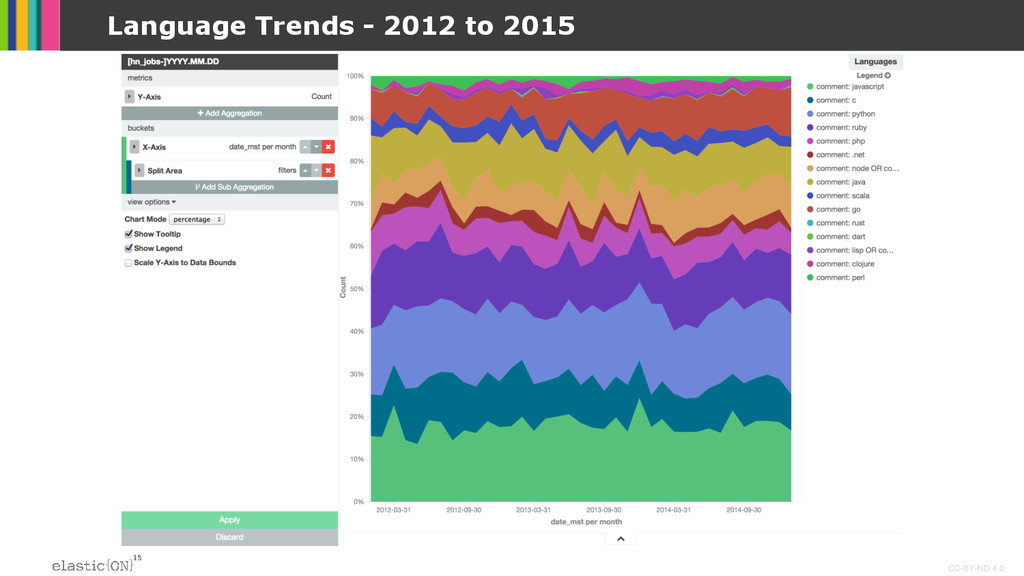
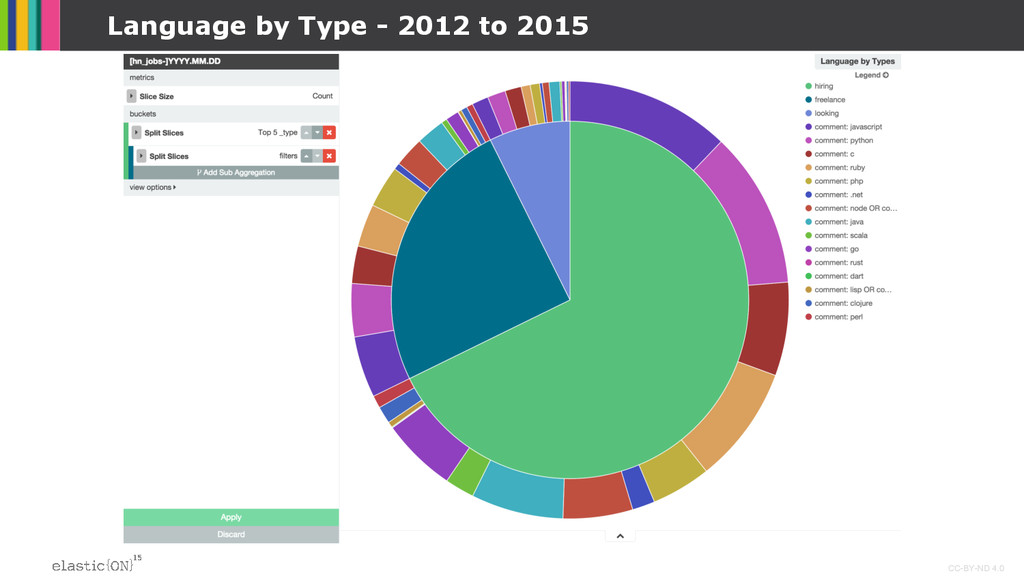
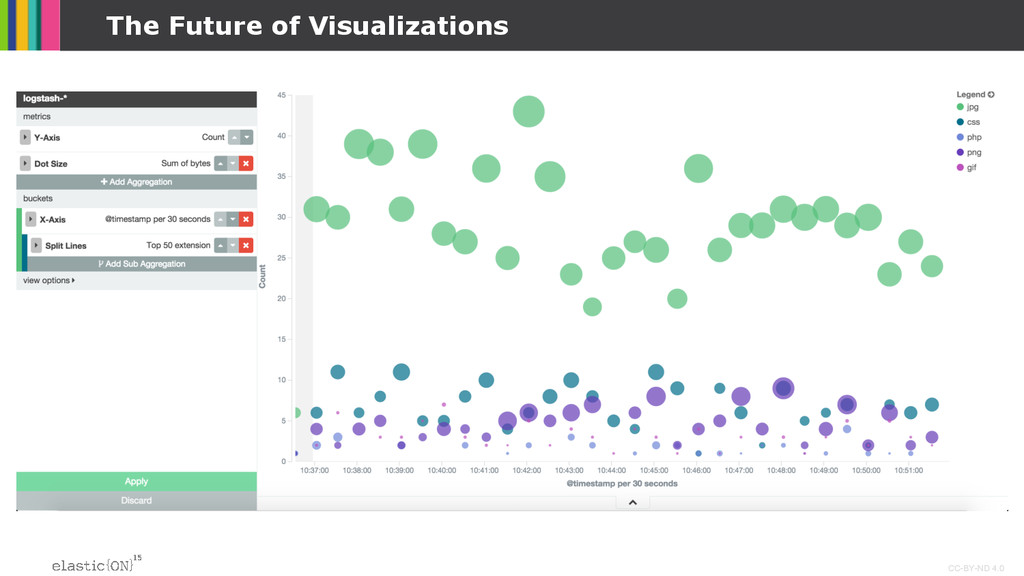
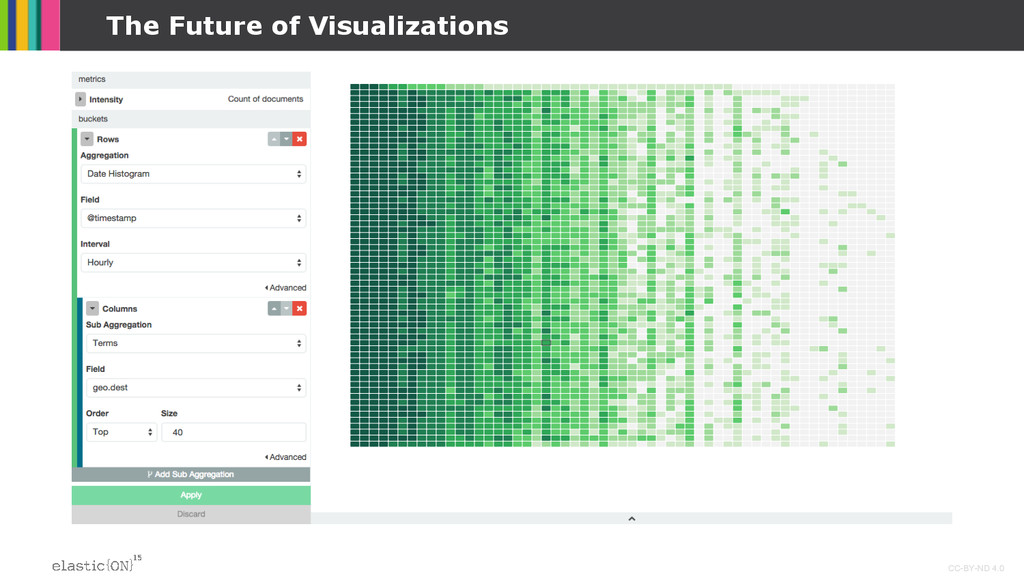
With the release of Kibana 4, we have implemented a completely new interface for visualizing and exploring data that we believe is a marked improvement over previous versions. We’ve added tons of cool new features and even rolled out our own visualization library built using D3.js.
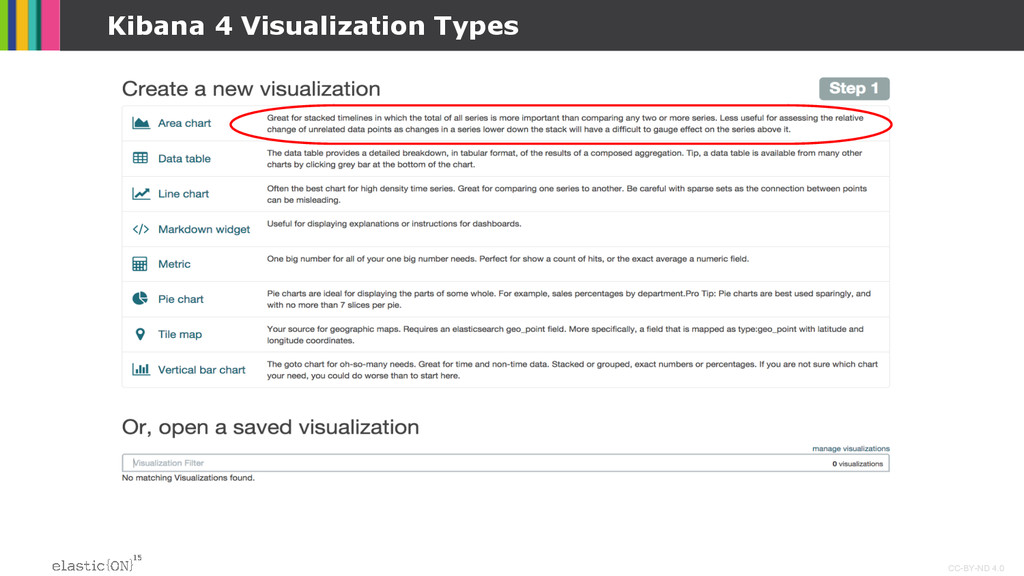
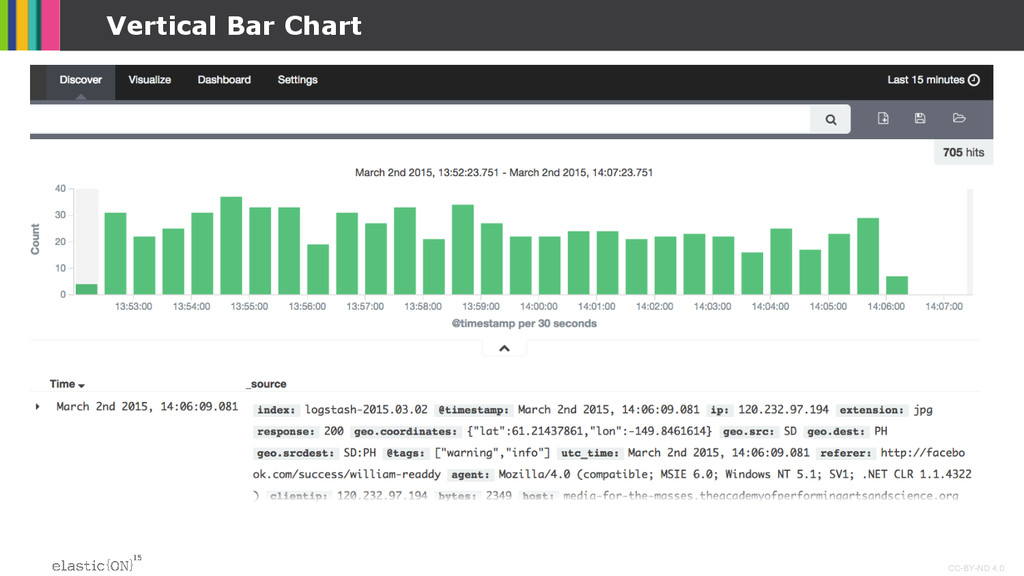
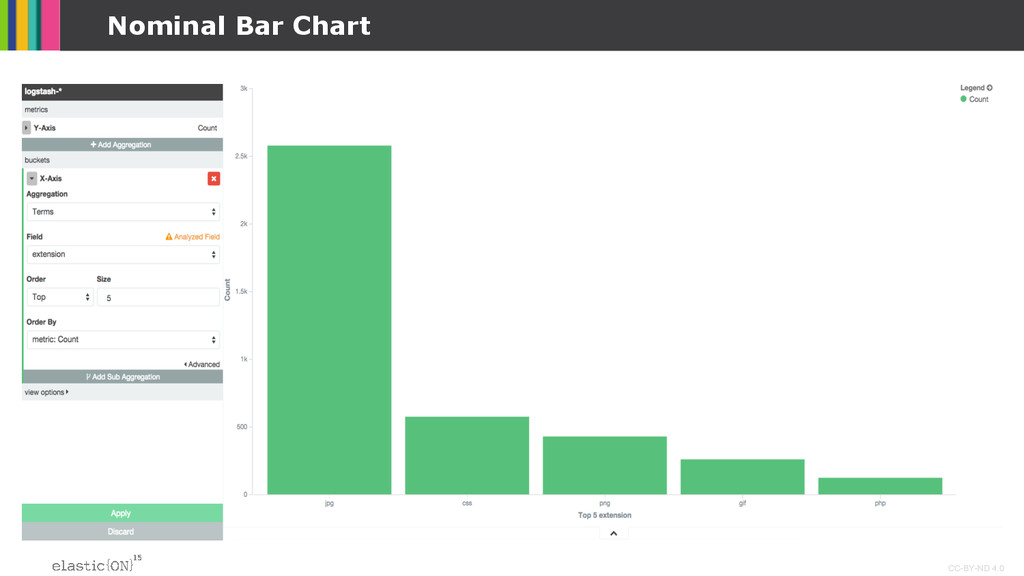
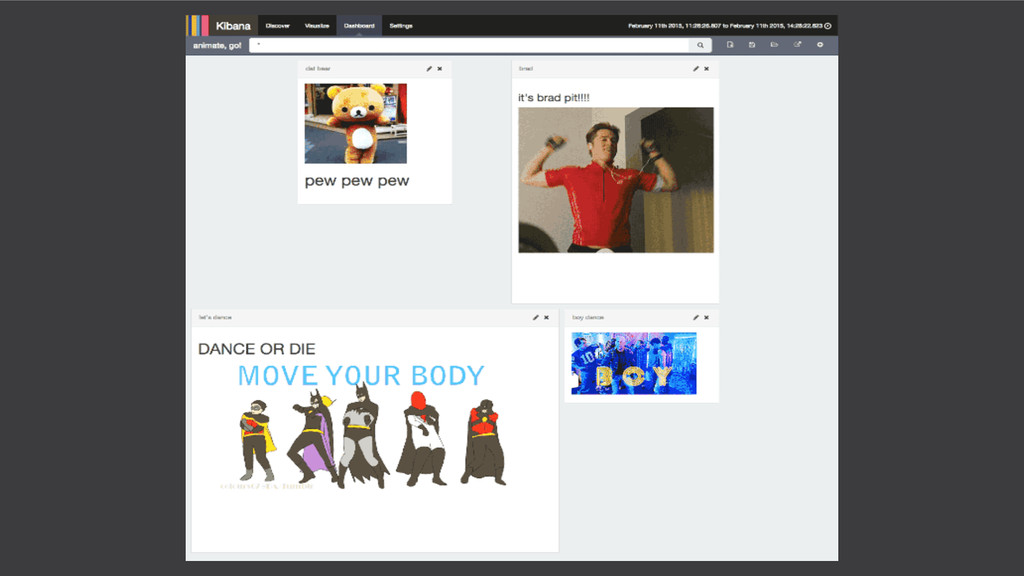
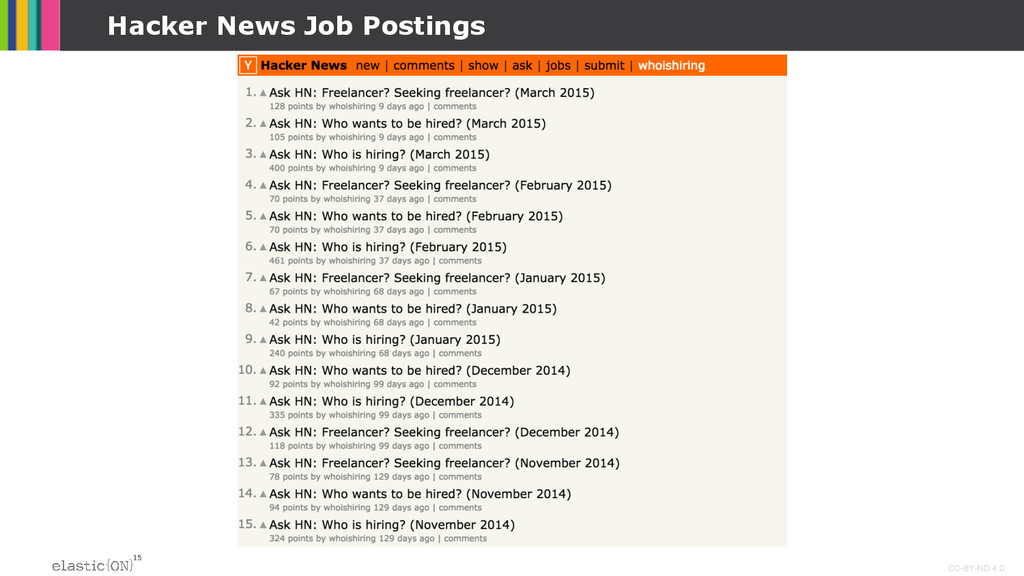
In this talk, we will cover the different visualization types available in Kibana 4 as well as the data they are best suited for displaying. We will cover real world examples/problems that Kibana helps solve. We will explore how to create and share dashboards for others to consume. Finally, we will discuss why we created our own visualization library for Kibana, as well as preview additional visualization types we have in store for the future.