Upgrade to Pro — share decks privately, control downloads, hide ads and more …

Telemetry, Time-series, and other Metrics Use C...

Telemetry, Time-series, and other Metrics Use Cases with Elastic

Elastic 5.0 Updates for Metrics / Time-series presented at the Elastic LA Meetup by Antoine Girbal, Director of Solutions Architect at Elastic

Avatar for Elastic LA User Group Meetup

Elastic LA User Group Meetup

November 16, 2016

Other Decks in Technology

Transcript

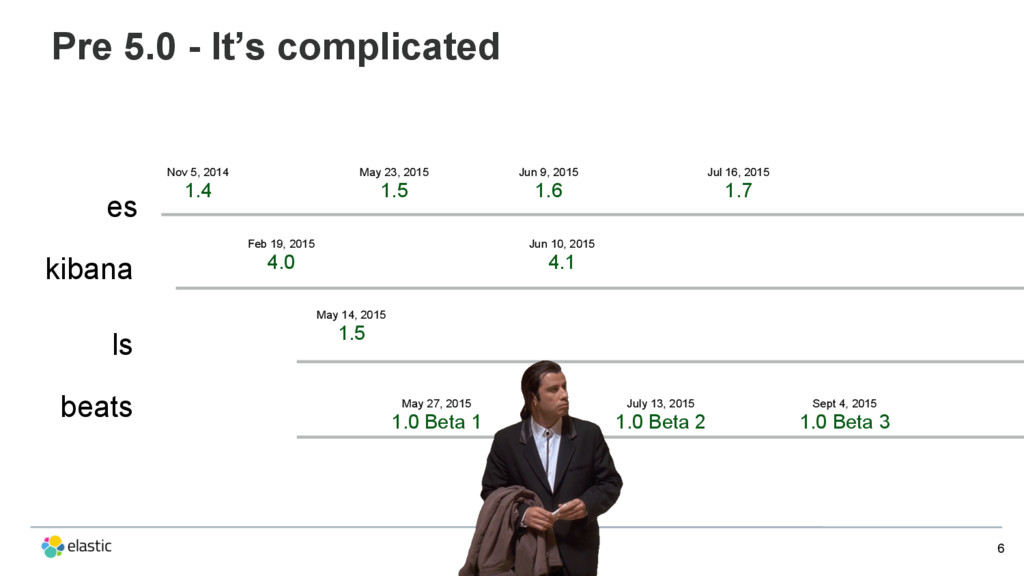
  1. 6 Jun 9, 2015 1.6 Jul 16, 2015 1.7 Feb

    19, 2015 4.0 Jun 10, 2015 4.1 May 14, 2015 1.5 May 27, 2015 1.0 Beta 1 July 13, 2015 1.0 Beta 2 Sept 4, 2015 1.0 Beta 3 May 23, 2015 1.5 Nov 5, 2014 1.4 Pre 5.0 - It’s complicated es kibana ls beats
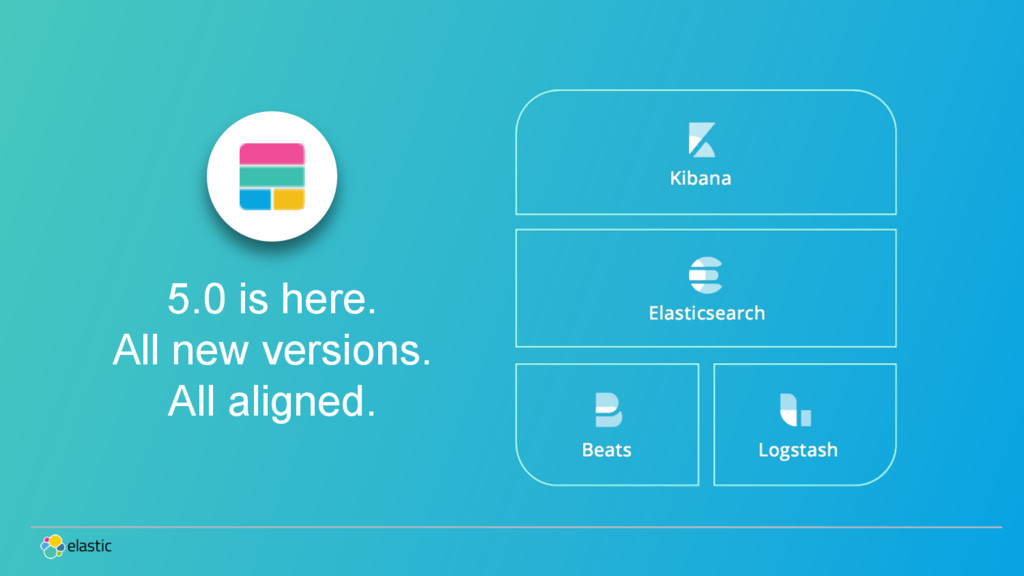
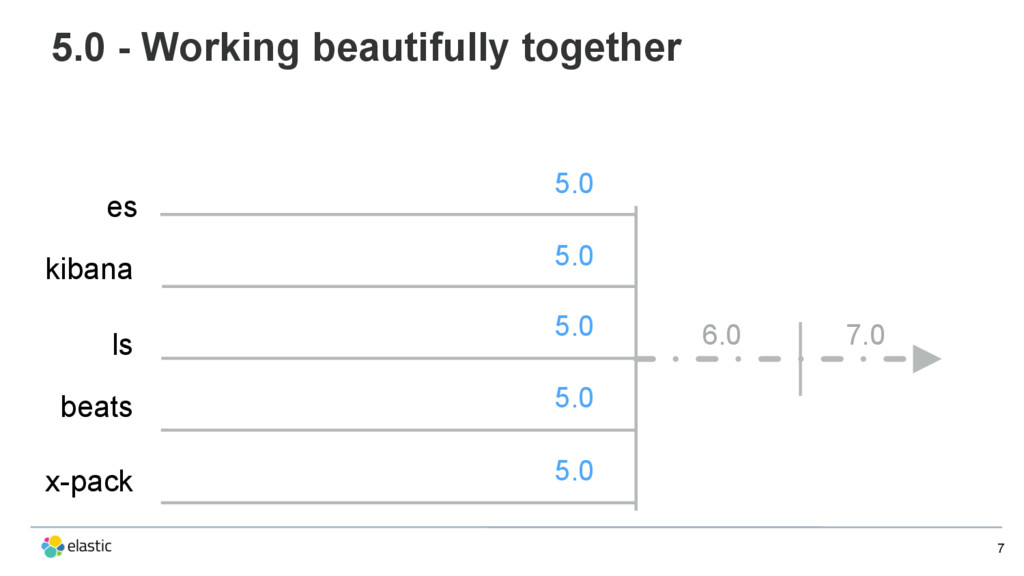
  2. 7 5.0 - Working beautifully together es kibana ls beats

    6.0 7.0 x-pack 5.0 5.0 5.0 5.0 5.0
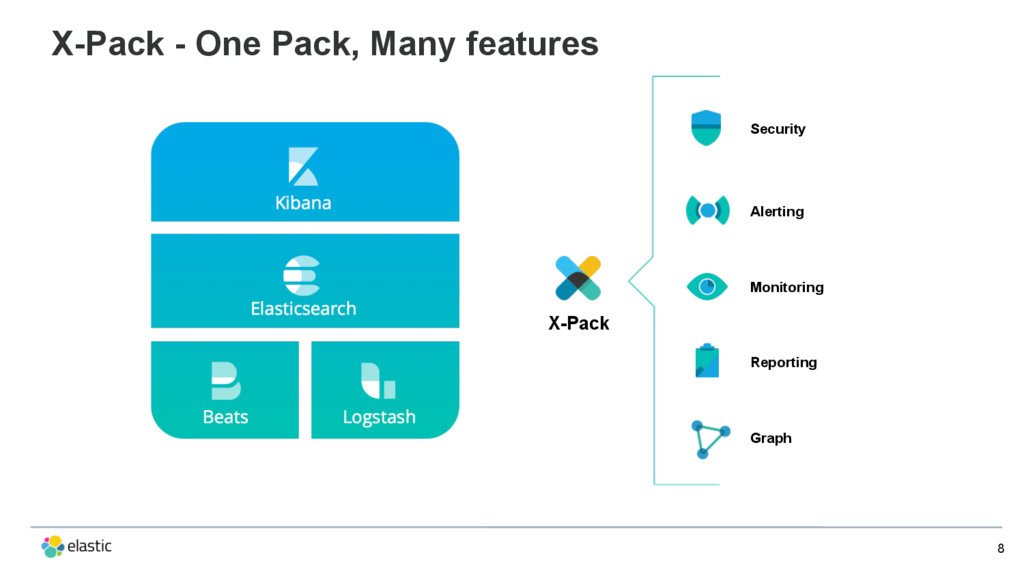
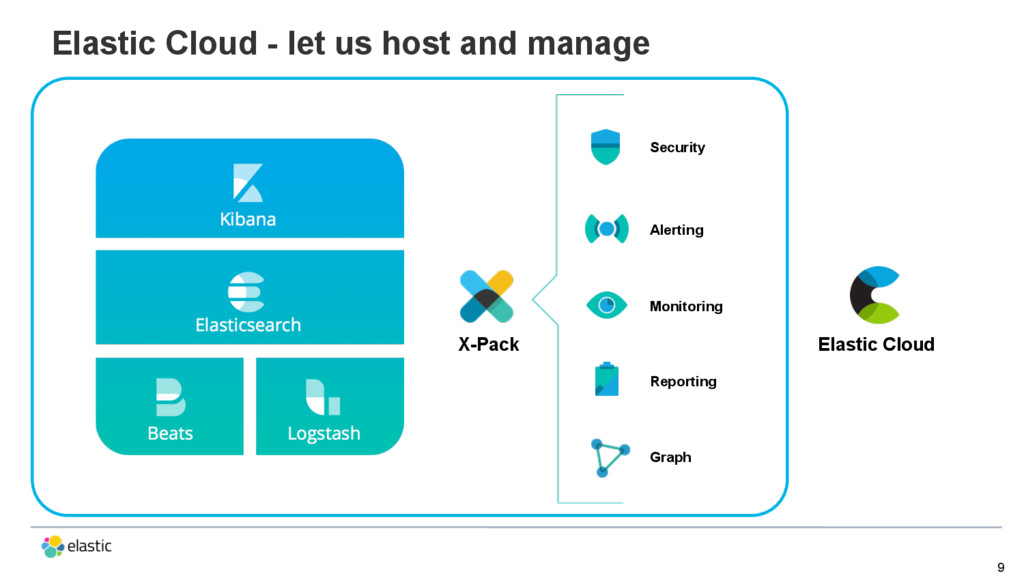
  3. Elastic Cloud - let us host and manage 9 X-Pack

    Elastic Cloud Security Alerting Monitoring Reporting Graph
  4. Metrics … •  A measure of measurement •  Examples: ✦ 

    Systems health ✦  Application Performance Management ✦  IoT ✦  Scientific use cases
  5. 11 Metrics … •  Mostly numbers with some keywords • 

    Examples: ‒ Systems health ‒ Application Performance Management ‒  IoT ‒  Scientific use cases •  Analysis of logs often turns into time-series metrics
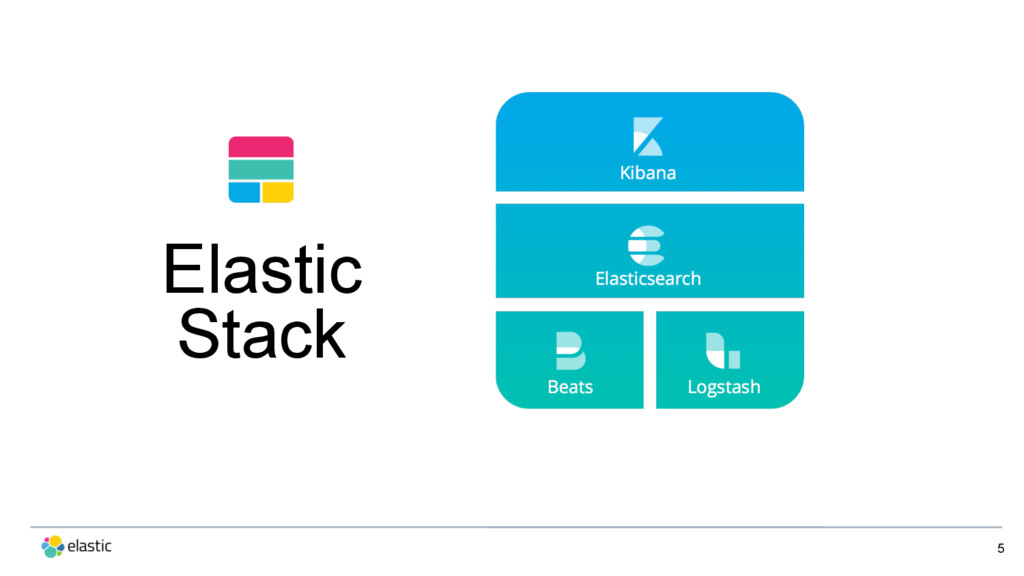
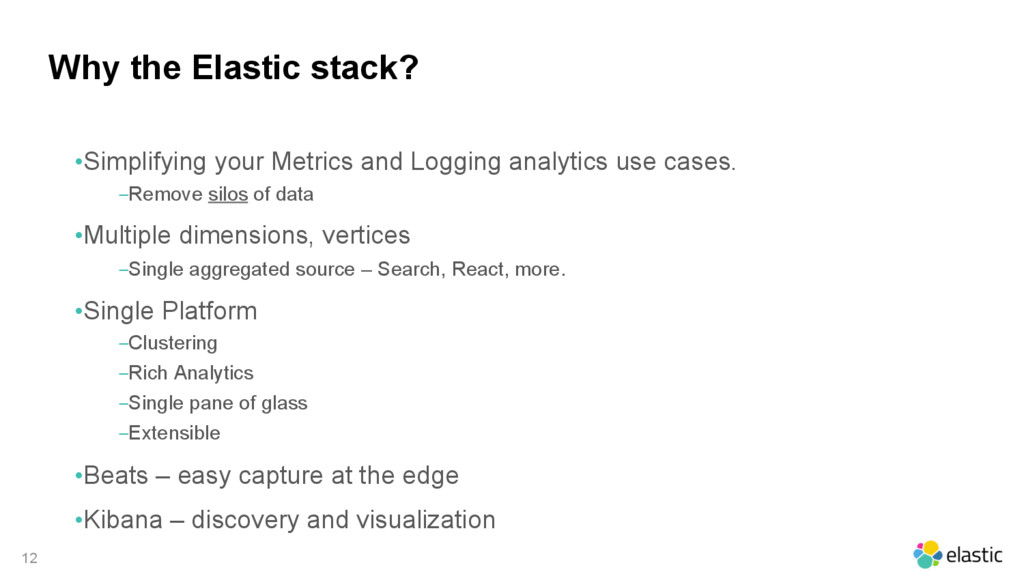
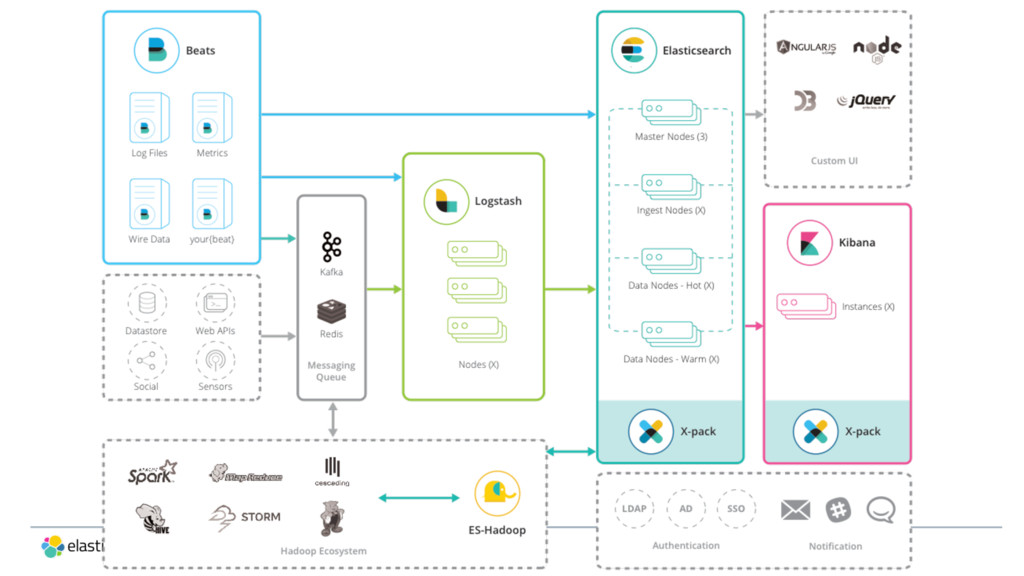
  6. 12 Why the Elastic stack? • Simplifying your Metrics and Logging

    analytics use cases. ‒ Remove silos of data • Multiple dimensions, vertices ‒ Single aggregated source – Search, React, more. • Single Platform ‒ Clustering ‒ Rich Analytics ‒ Single pane of glass ‒ Extensible • Beats – easy capture at the edge • Kibana – discovery and visualization
  7. More formats, more inputs 19 •  Packetbeat •  Count and

    bytes on the TCP/IP layer not application layer •  Metricbeat - new Beat! •  Collect metrics from systems and services
  8. 20 Metricbeat •  Goodbye, Topbeat! •  Modularized collection, simple configuration

    •  Apache •  HAProxy •  MongoDB •  MySQL •  Nginx •  Redis •  Postgresql •  System ← Uses code from Topbeat, on by default •  ZooKeeper
  9. More formats, more inputs 21 •  New Plugins •  Kinesis

    input, Protobuf codec, IPv6 Support with GeoIP2 •  Plugin Generator •  Developers can generate new plugins in seconds
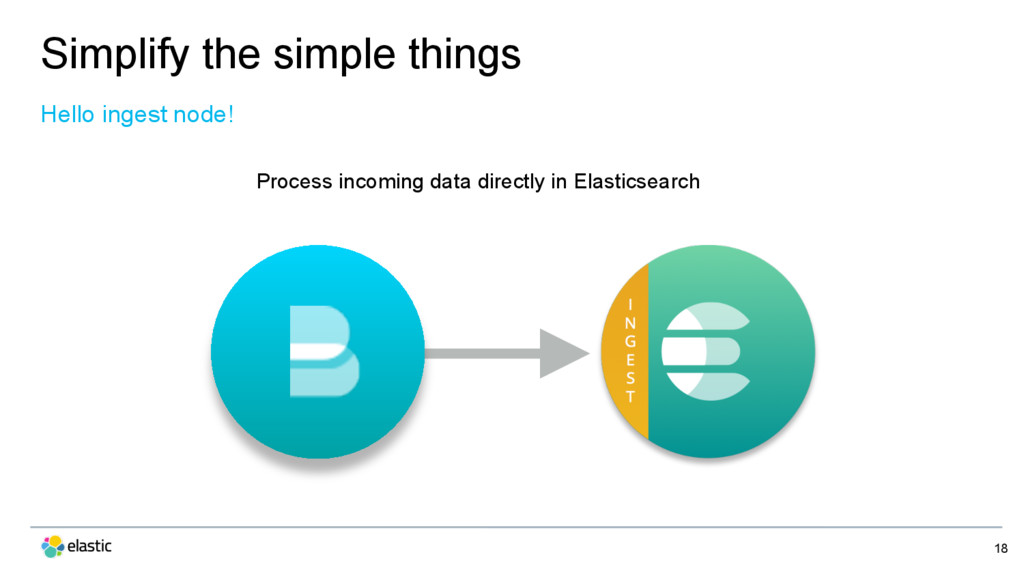
  10. More filters / enrichment 22 •  New filter plugins in

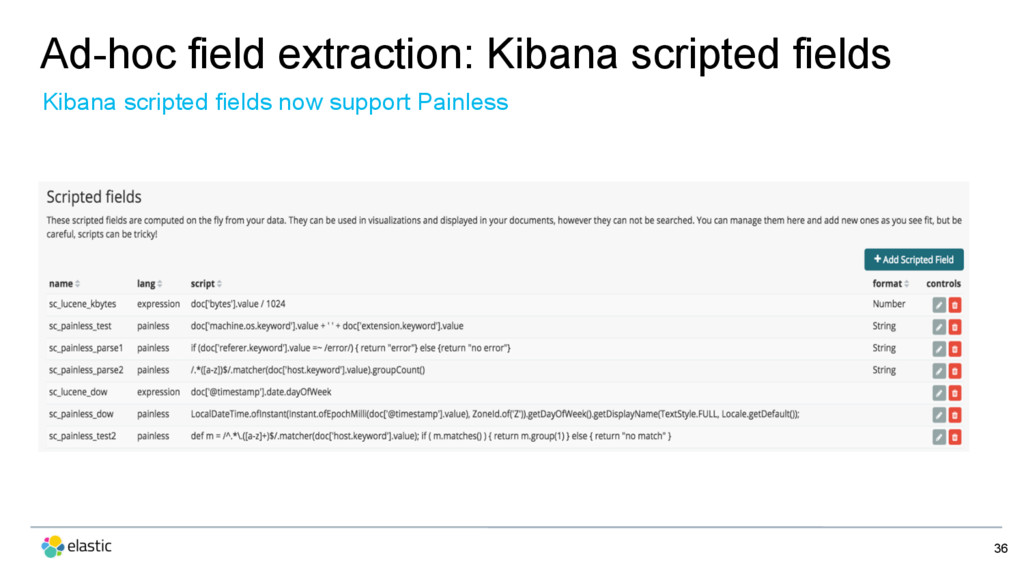
    Logstash •  Dissect filter, IPv6 Support with GeoIP2 •  Beats processors •  Filter out data on the edge •  Painless •  New safe and fast scripting language •  Supported in ingest node pipelines
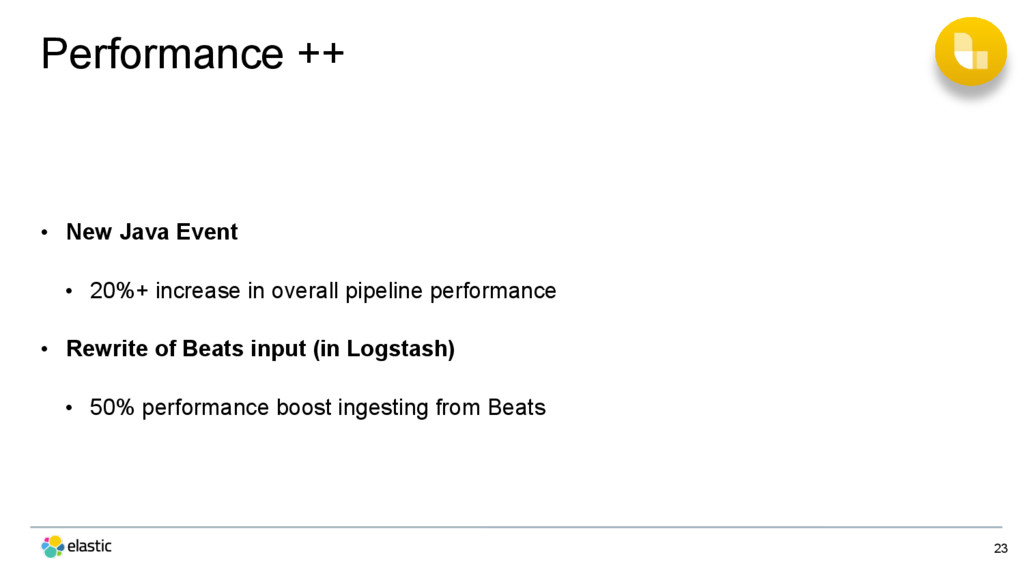
  11. Performance ++ 23 •  New Java Event •  20%+ increase

    in overall pipeline performance •  Rewrite of Beats input (in Logstash) •  50% performance boost ingesting from Beats
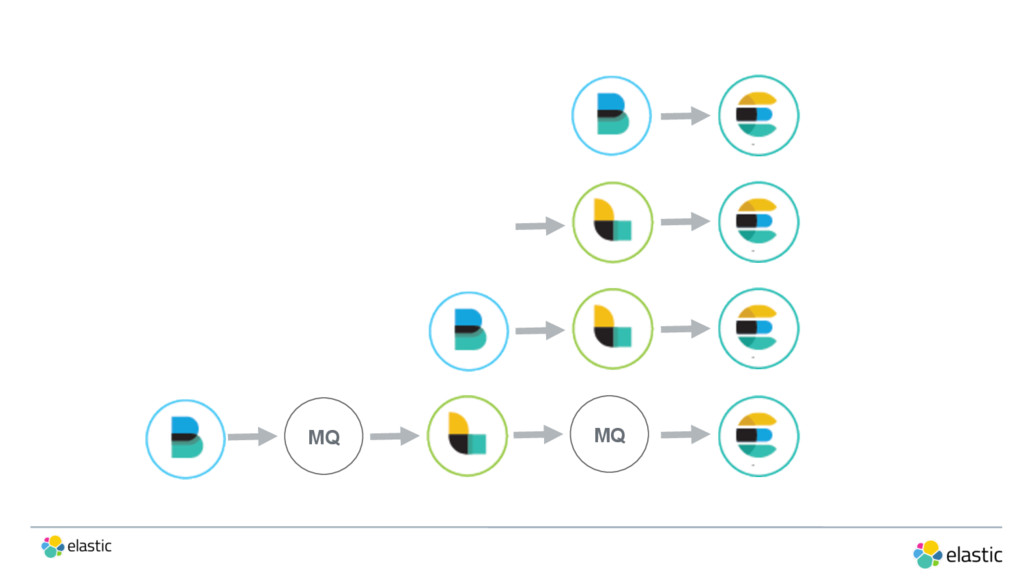
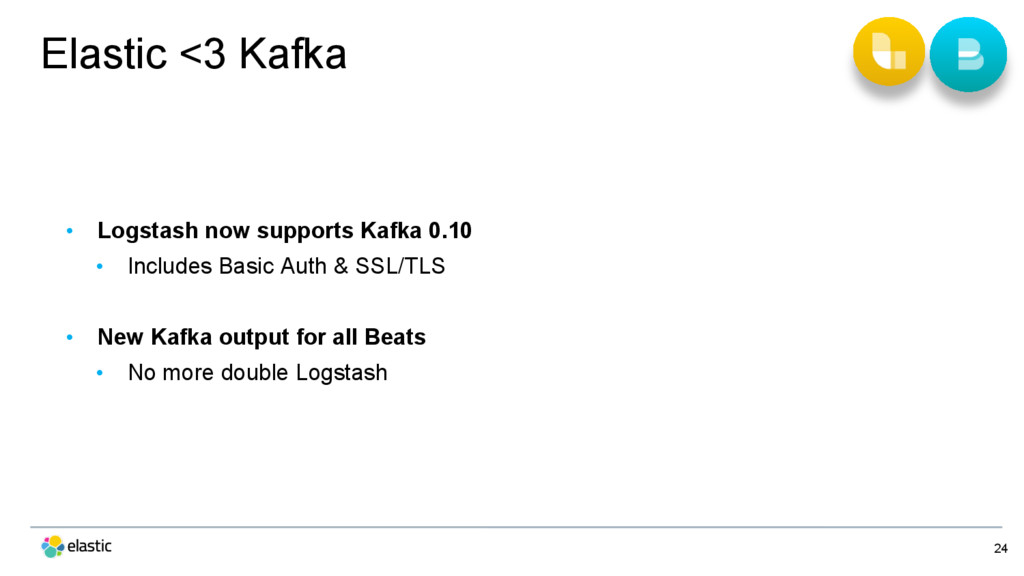
  12. Elastic <3 Kafka 24 •  Logstash now supports Kafka 0.10

    •  Includes Basic Auth & SSL/TLS •  New Kafka output for all Beats •  No more double Logstash
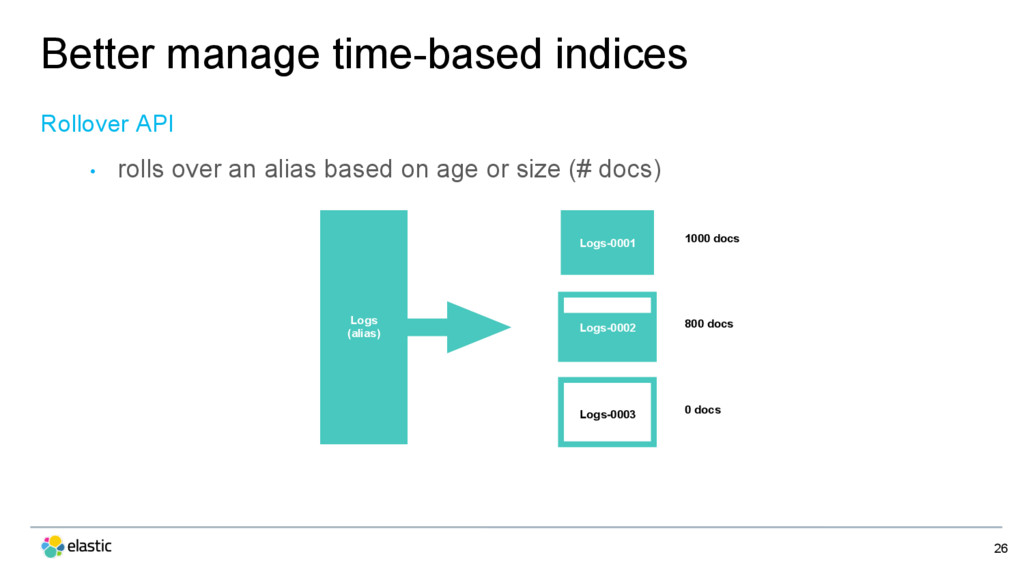
  13. 26 •  rolls over an alias based on age or

    size (# docs) Logs-0001 Logs-0002 Logs-0003 1000 docs 800 docs 0 docs Logs (alias) Better manage time-based indices Rollover API
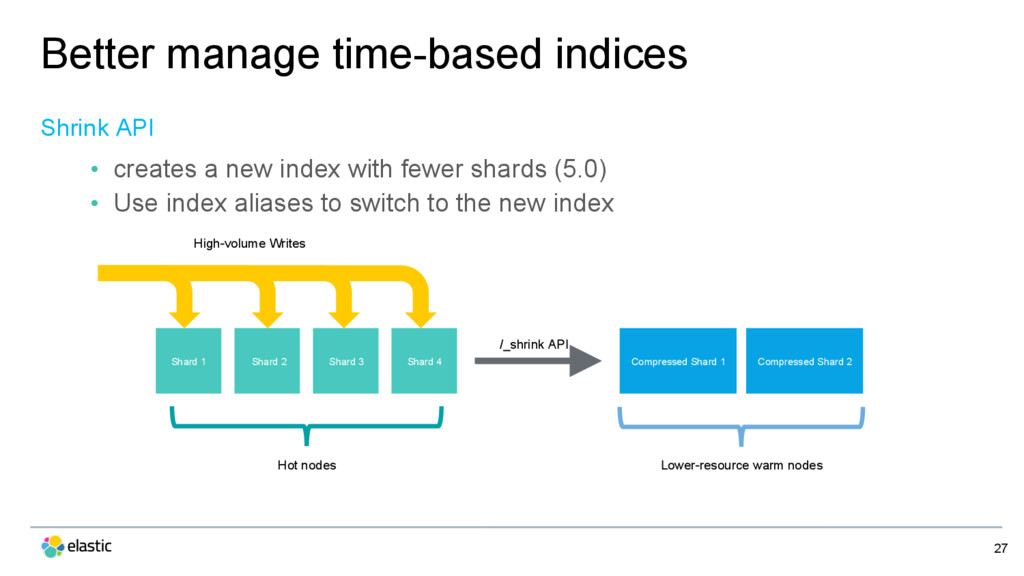
  14. Better manage time-based indices 27 Shard 1 Compressed Shard 2

    /_shrink API High-volume Writes Hot nodes Lower-resource warm nodes Compressed Shard 1 Shard 2 Shard 3 Shard 4 •  creates a new index with fewer shards (5.0) •  Use index aliases to switch to the new index Shrink API
  15. Better manage time-based indices 28 •  Automatically archive and restore

    indices •  Simplified YAML-based configuration •  New actions and filters Curator 4.0
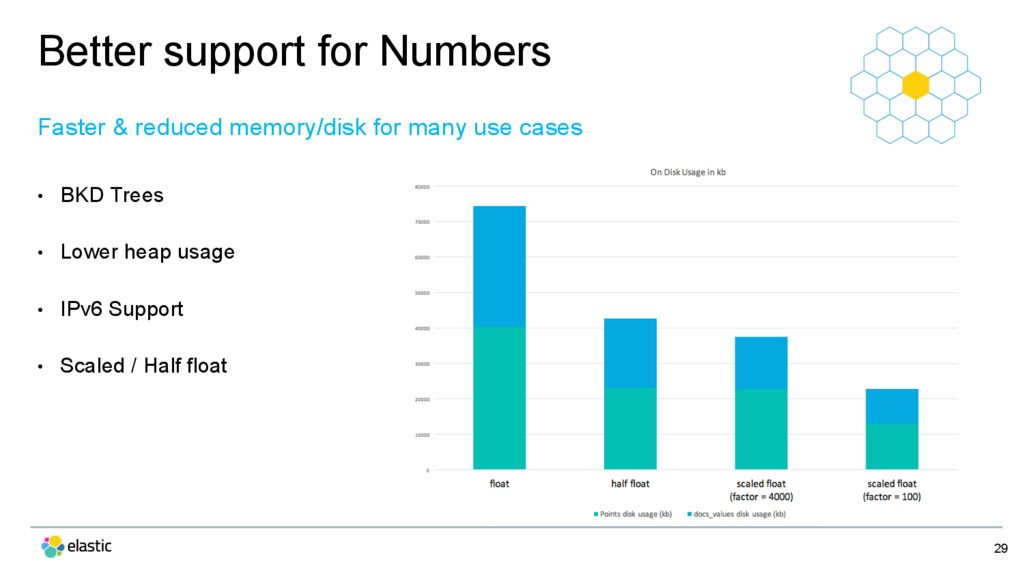
  16. Better support for Numbers •  BKD Trees •  Lower heap

    usage •  IPv6 Support •  Scaled / Half float 29 Faster & reduced memory/disk for many use cases
  17. Strings are dead, long live strings! •  New “keyword” data

    type for non-analyzed text •  New "text" data type for analyzed text 31 More reliable off-heap storage for string data
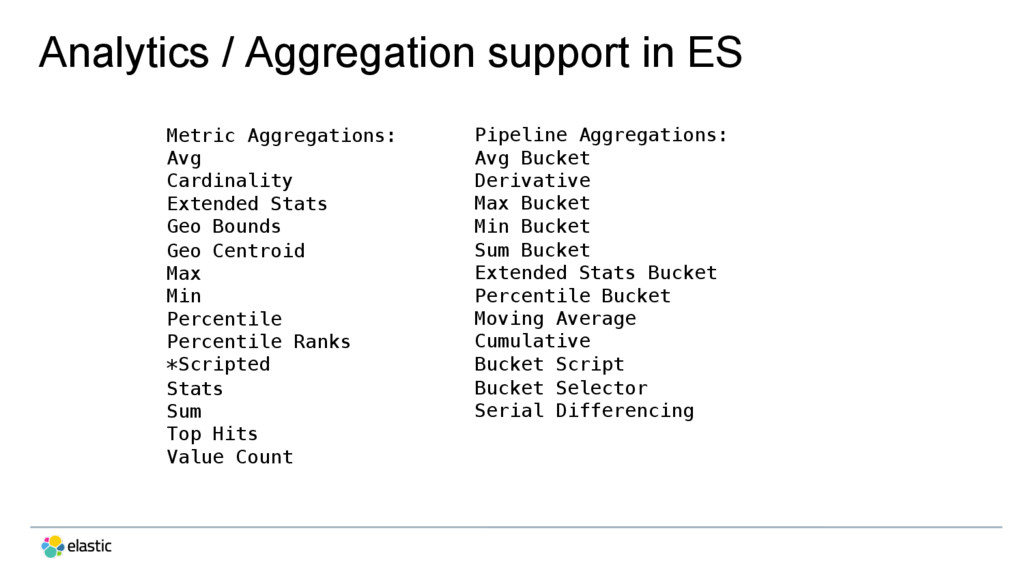
  18. Analytics / Aggregation support in ES Metric Aggregations: Avg Cardinality

    Extended Stats Geo Bounds Geo Centroid Max! Min Percentile! Percentile Ranks *Scripted Stats Sum Top Hits Value Count Pipeline Aggregations: Avg Bucket Derivative Max Bucket Min Bucket Sum Bucket Extended Stats Bucket! Percentile Bucket! Moving Average Cumulative Bucket Script Bucket Selector Serial Differencing
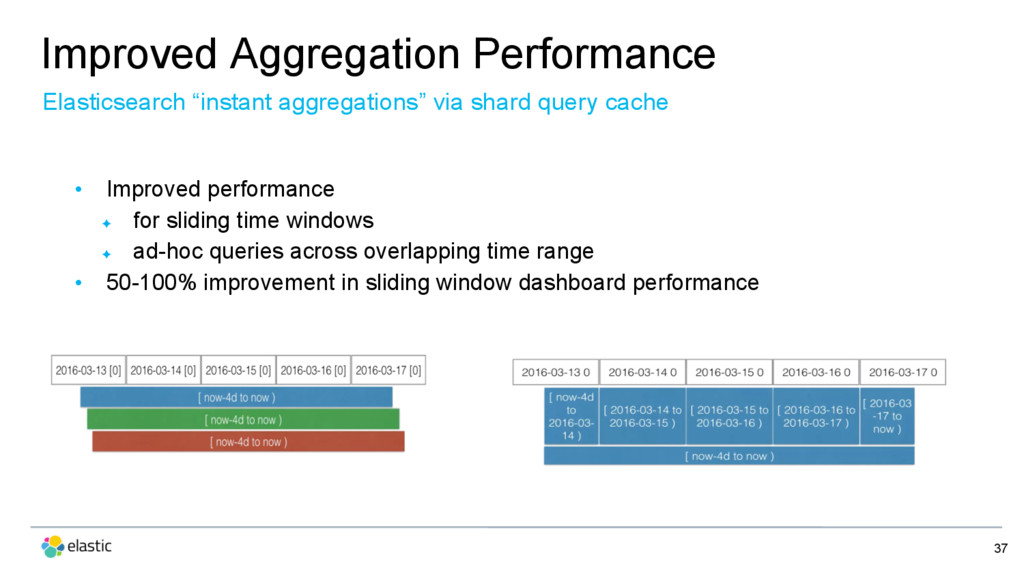
  19. Improved Aggregation Performance 37 Elasticsearch “instant aggregations” via shard query

    cache •  Improved performance ✦  for sliding time windows ✦  ad-hoc queries across overlapping time range •  50-100% improvement in sliding window dashboard performance
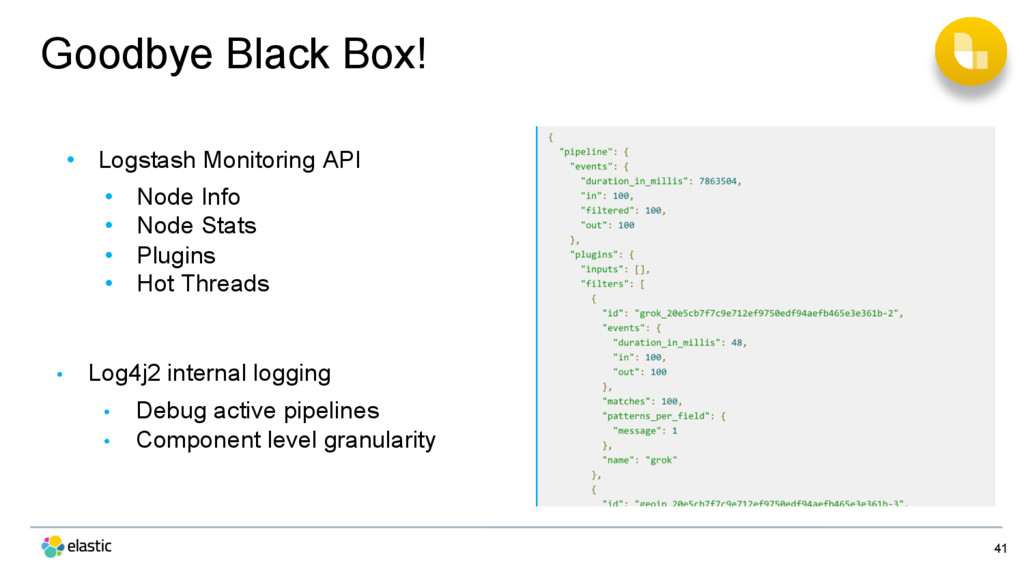
  20. Goodbye Black Box! 41 •  Logstash Monitoring API •  Node

    Info •  Node Stats •  Plugins •  Hot Threads •  Log4j2 internal logging •  Debug active pipelines •  Component level granularity
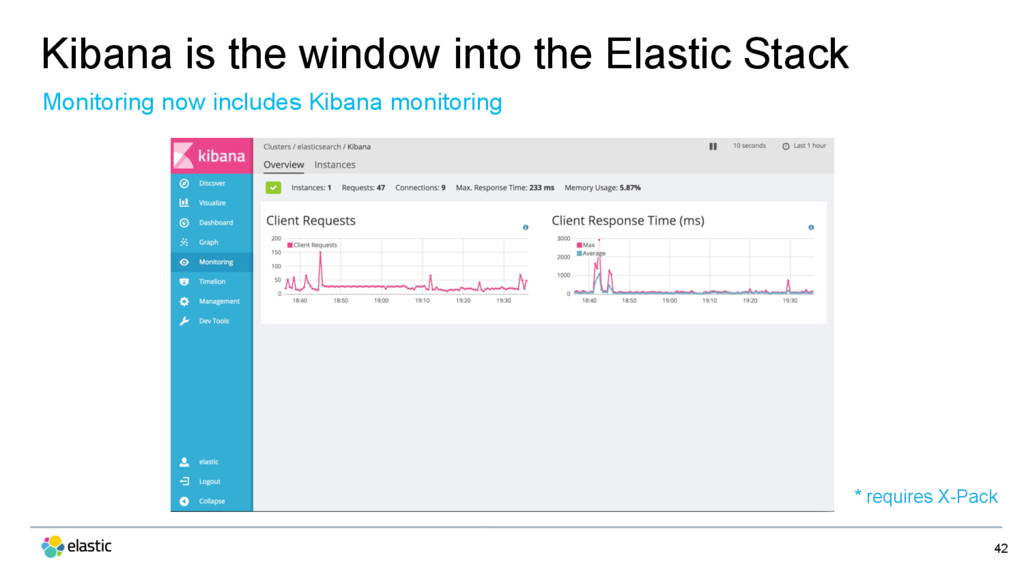
  21. Kibana is the window into the Elastic Stack 42 Monitoring

    now includes Kibana monitoring * requires X-Pack
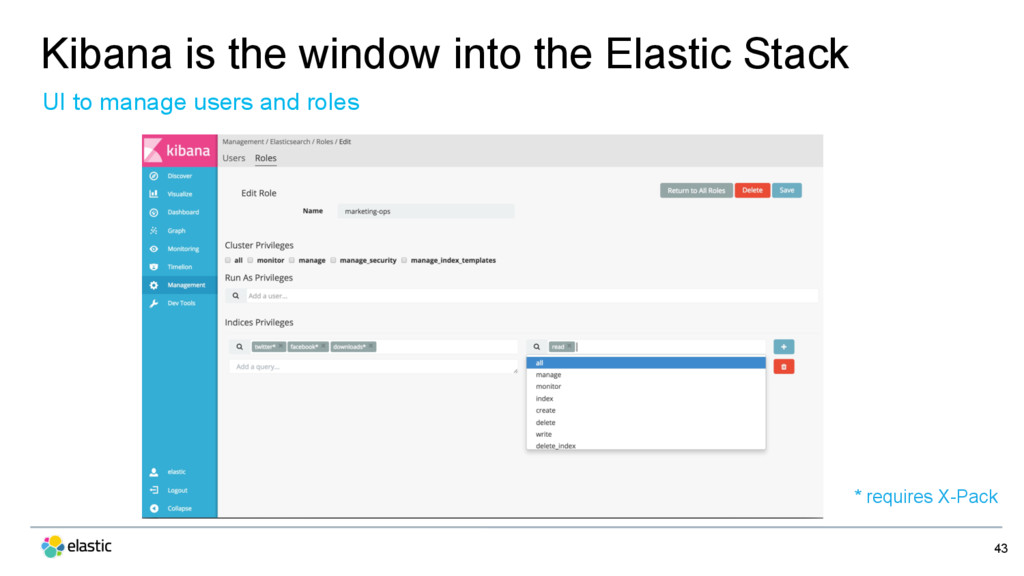
  22. Kibana is the window into the Elastic Stack 43 UI

    to manage users and roles * requires X-Pack
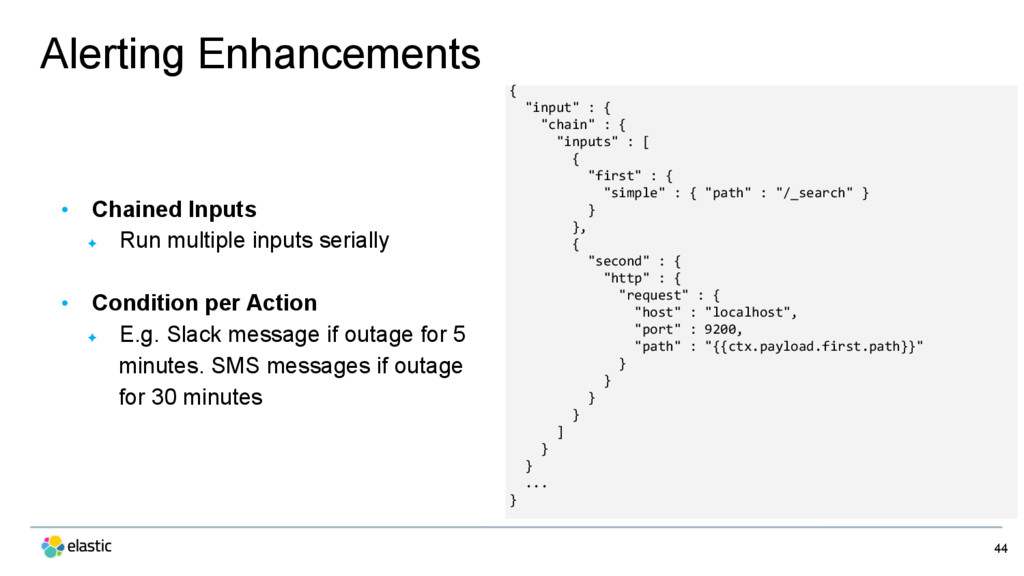
  23. Alerting Enhancements 44 •  Chained Inputs ✦  Run multiple inputs

    serially •  Condition per Action ✦  E.g. Slack message if outage for 5 minutes. SMS messages if outage for 30 minutes { "input" : { "chain" : { "inputs" : [ { "first" : { "simple" : { "path" : "/_search" } } }, { "second" : { "http" : { "request" : { "host" : "localhost", "port" : 9200, "path" : "{{ctx.payload.first.path}}" } } } } ] } } ... }
  24. Resources: Upgrading to 5.0 46 •  Webinar - Upgrade your

    Elastic Stack to 5.0 (Nov 29) •  Documentation - see cross-stack upgrade guide •  Elastic Support & Services