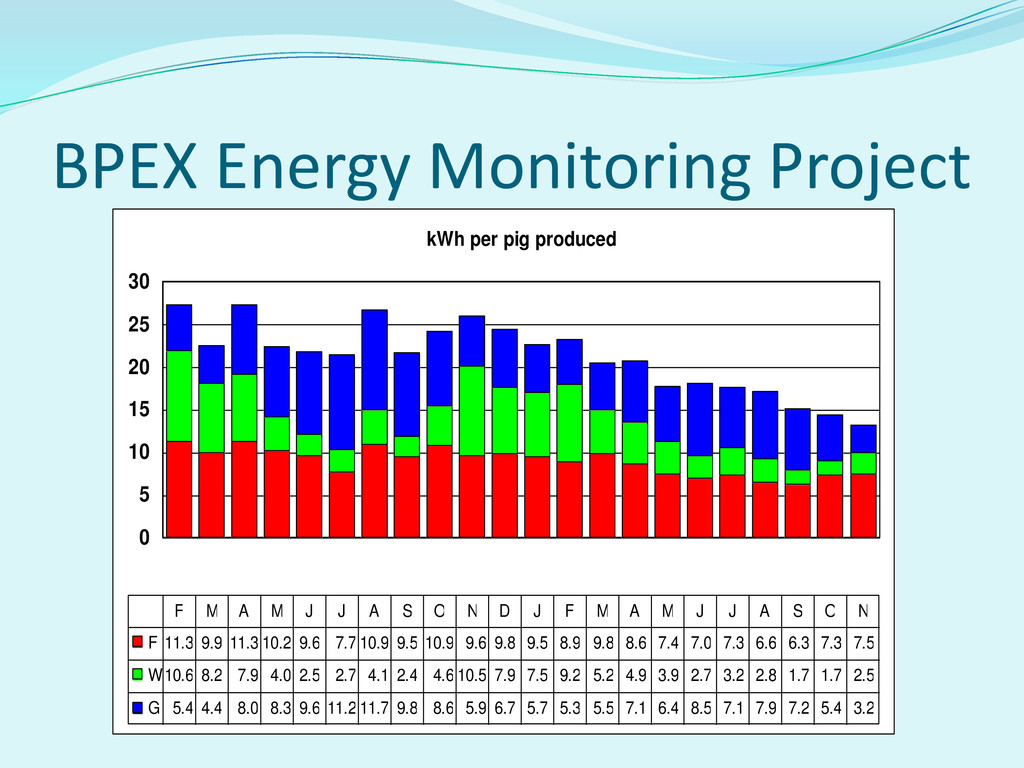
produced F W G F M A M J J A S O N D J F M A M J J A S O N 11.3 9.9 11.3 10.2 9.6 7.7 10.9 9.5 10.9 9.6 9.8 9.5 8.9 9.8 8.6 7.4 7.0 7.3 6.6 6.3 7.3 7.5 10.6 8.2 7.9 4.0 2.5 2.7 4.1 2.4 4.6 10.5 7.9 7.5 9.2 5.2 4.9 3.9 2.7 3.2 2.8 1.7 1.7 2.5 5.4 4.4 8.0 8.3 9.6 11.2 11.7 9.8 8.6 5.9 6.7 5.7 5.3 5.5 7.1 6.4 8.5 7.1 7.9 7.2 5.4 3.2 BPEX Energy Monitoring Project
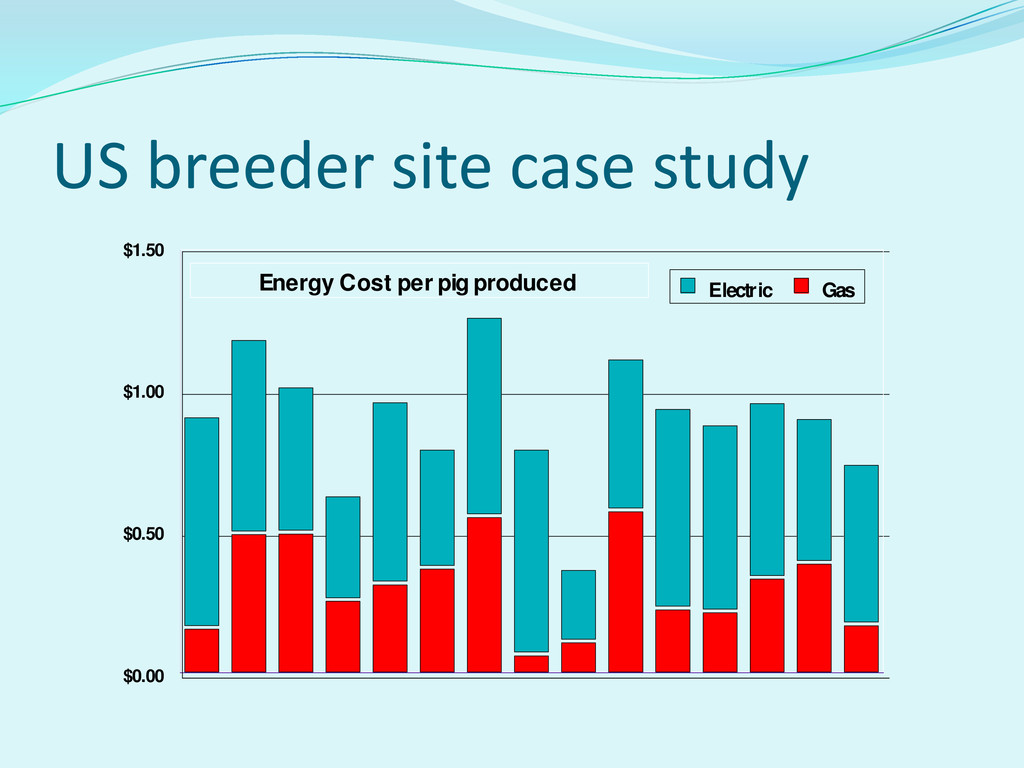
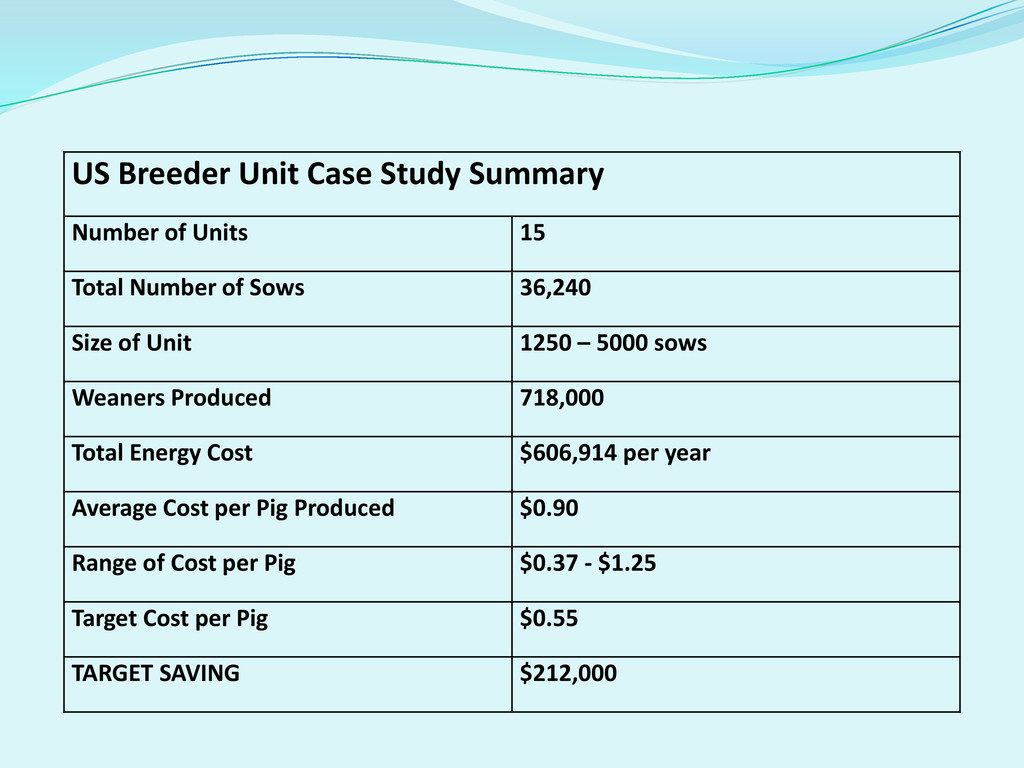
Total Number of Sows 36,240 Size of Unit 1250 – 5000 sows Weaners Produced 718,000 Total Energy Cost $606,914 per year Average Cost per Pig Produced $0.90 Range of Cost per Pig $0.37 - $1.25 Target Cost per Pig $0.55 TARGET SAVING $212,000
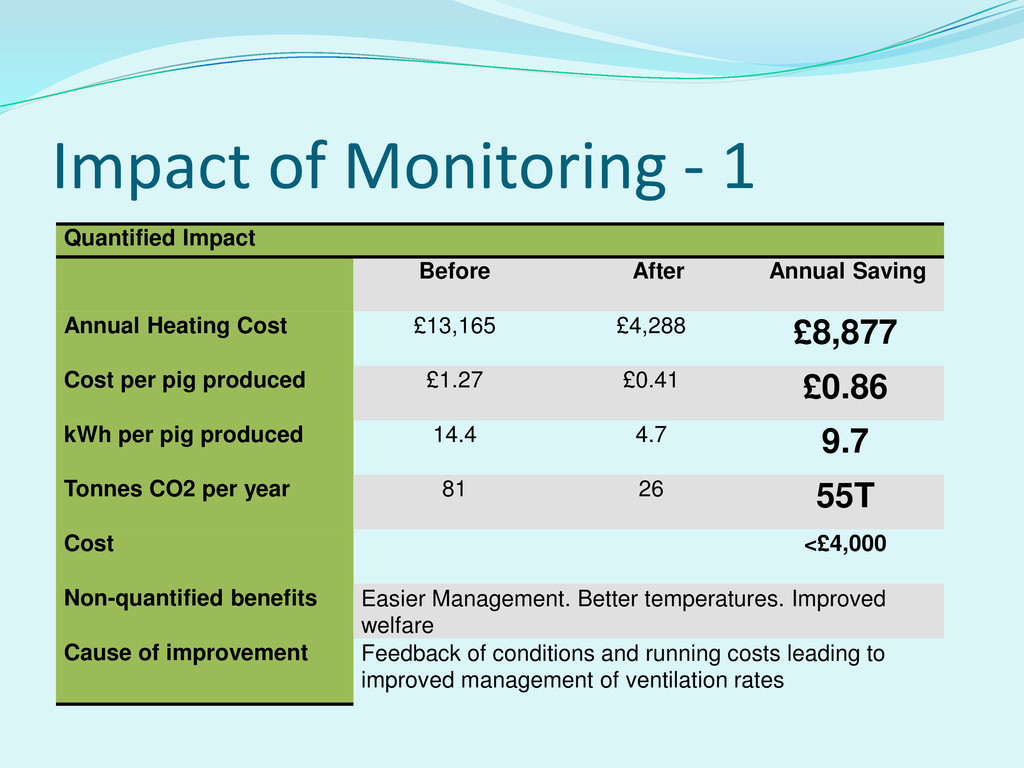
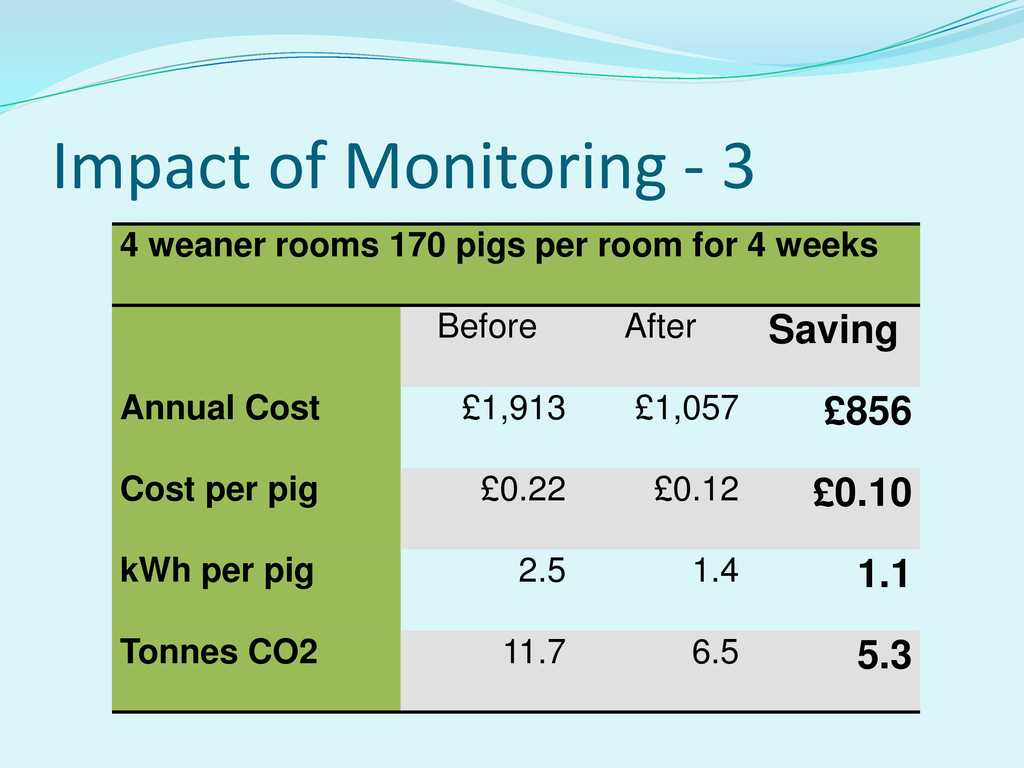
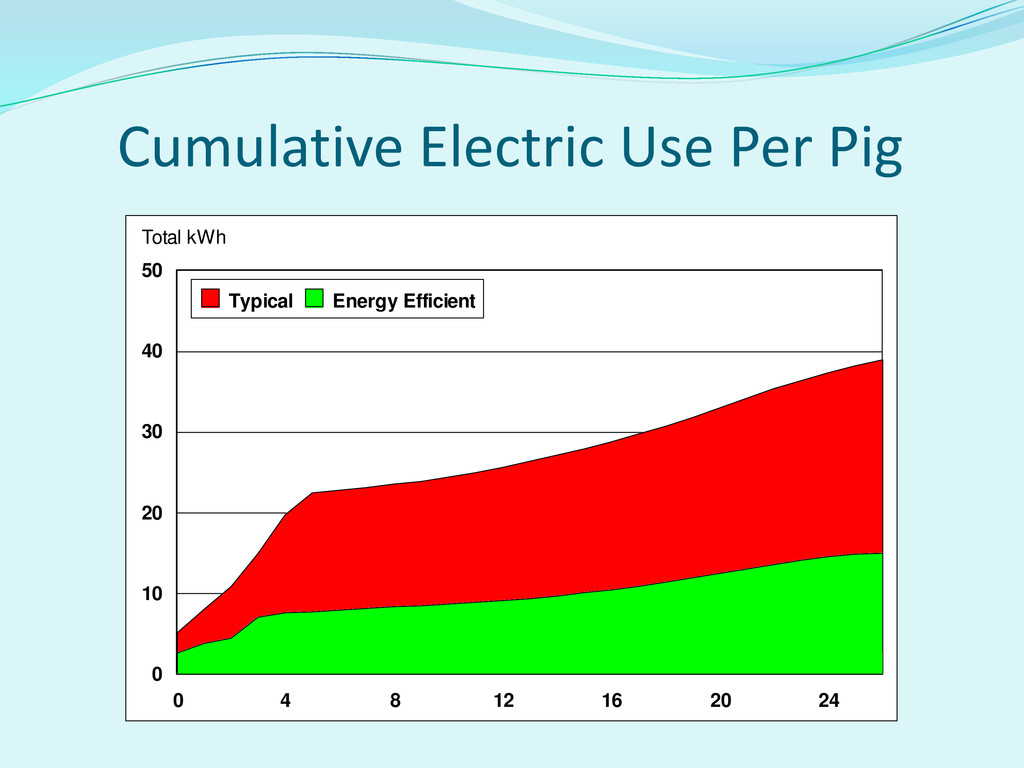
Saving Annual Heating Cost £13,165 £4,288 £8,877 Cost per pig produced £1.27 £0.41 £0.86 kWh per pig produced 14.4 4.7 9.7 Tonnes CO2 per year 81 26 55T Cost <£4,000 Non-quantified benefits Easier Management. Better temperatures. Improved welfare Cause of improvement Feedback of conditions and running costs leading to improved management of ventilation rates
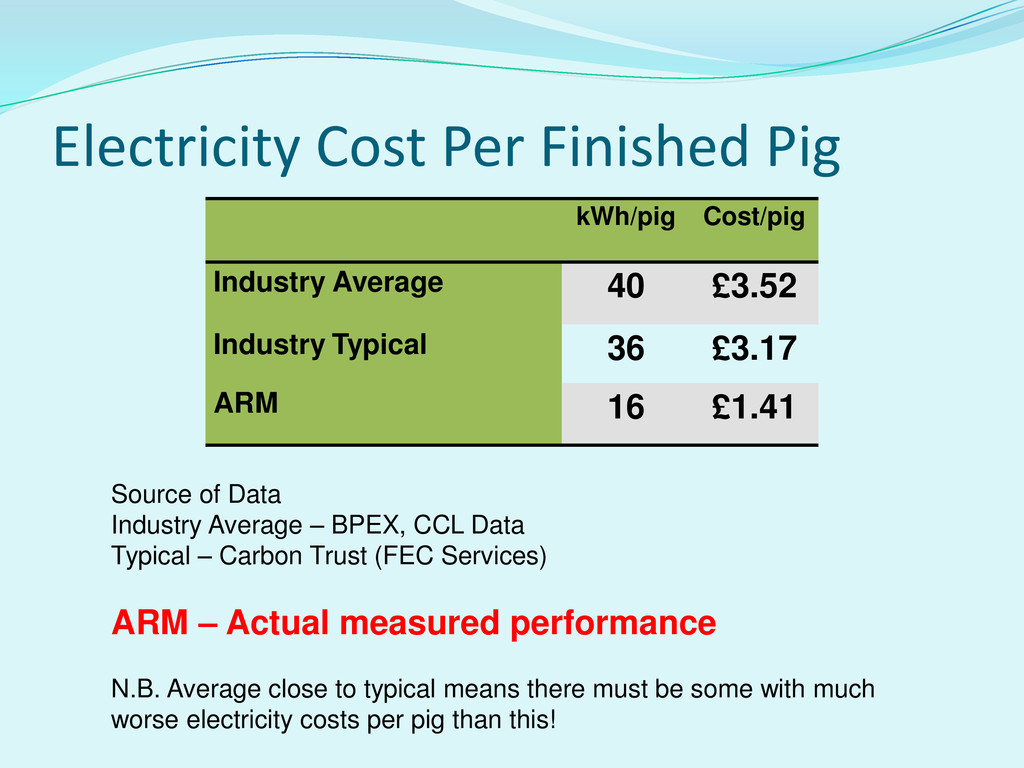
£3.52 Industry Typical 36 £3.17 ARM 16 £1.41 Source of Data Industry Average – BPEX, CCL Data Typical – Carbon Trust (FEC Services) ARM – Actual measured performance N.B. Average close to typical means there must be some with much worse electricity costs per pig than this!