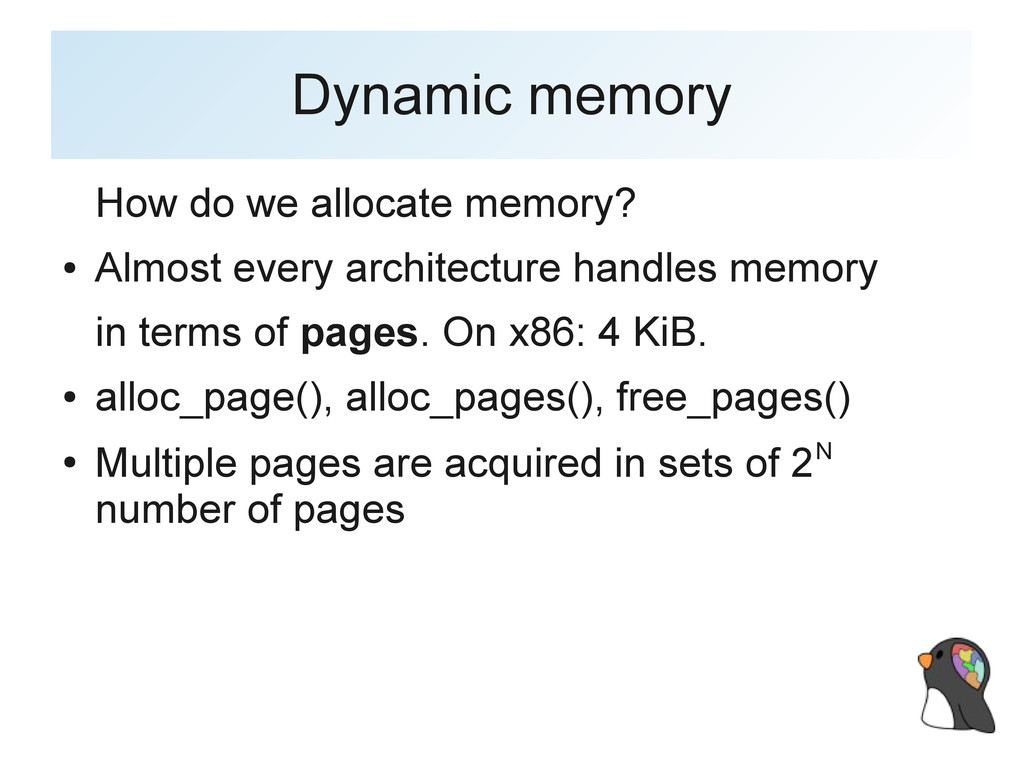
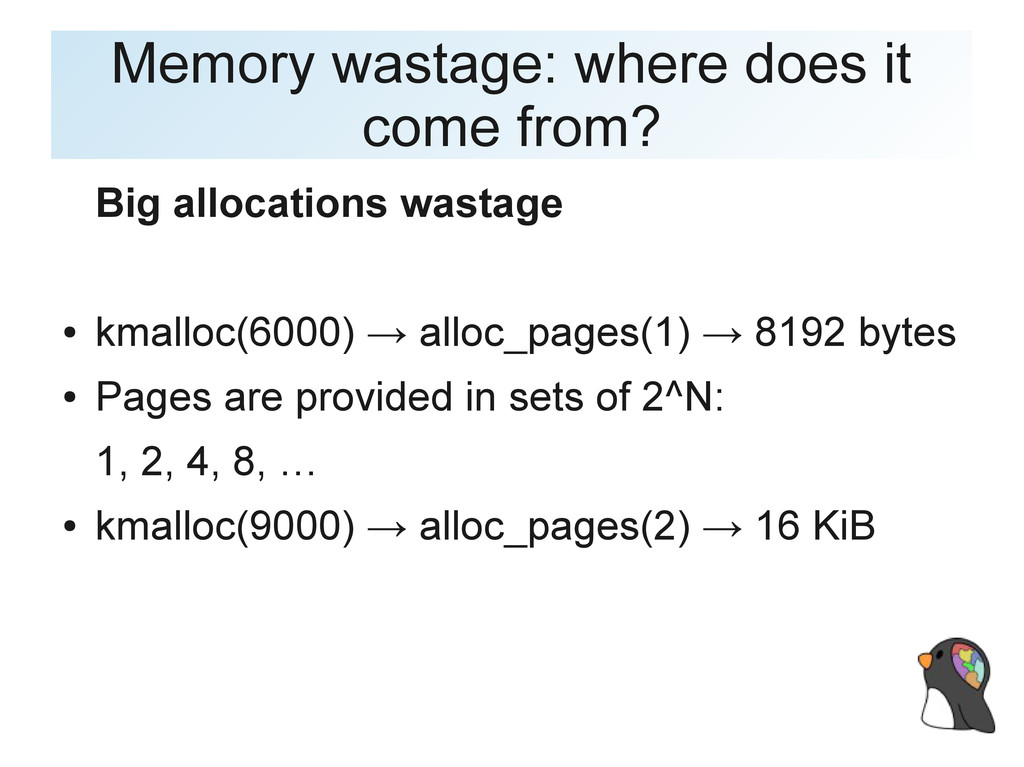
architecture handles memory in terms of pages. On x86: 4 KiB. • alloc_page(), alloc_pages(), free_pages() • Multiple pages are acquired in sets of 2N number of pages
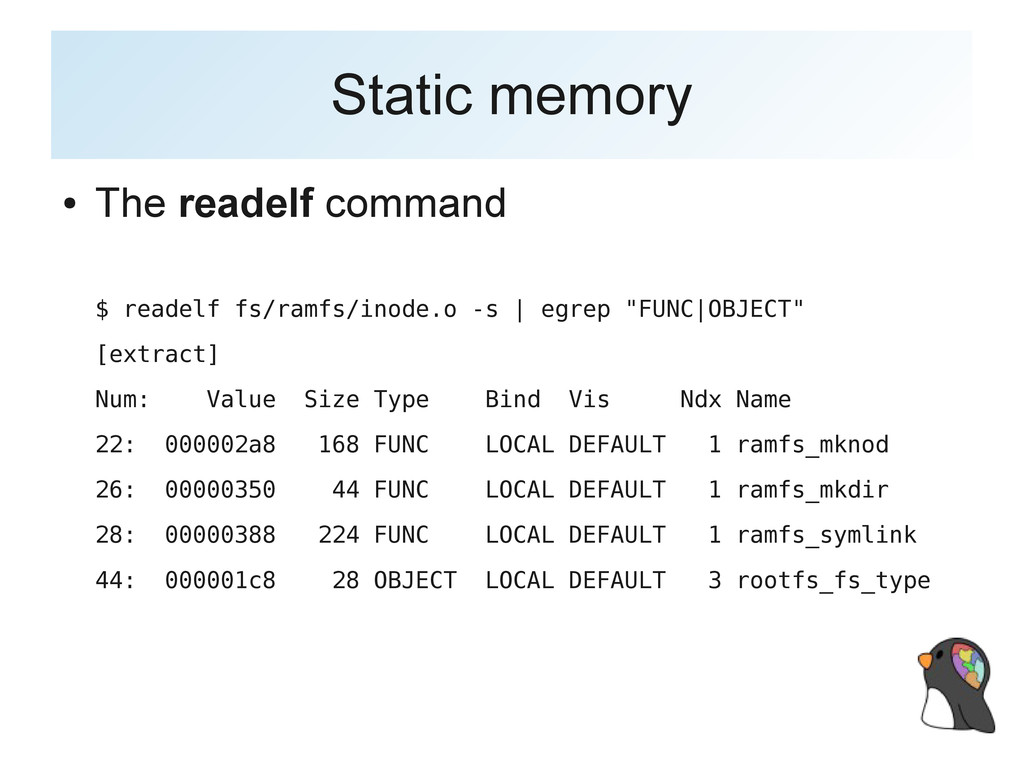
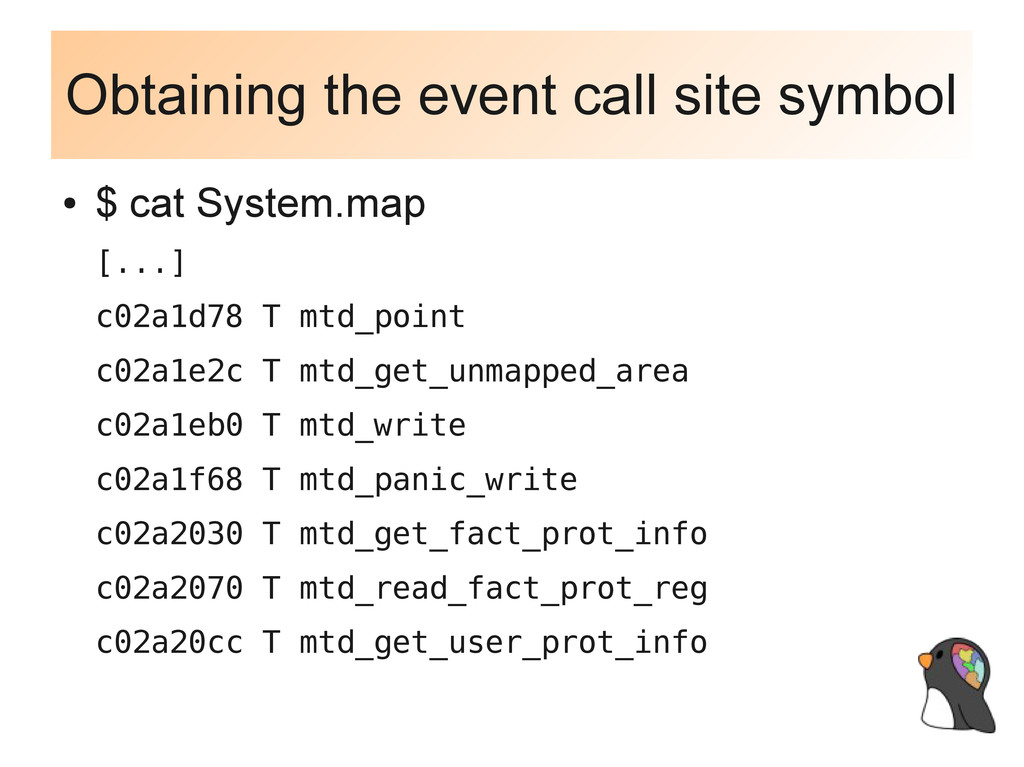
[...] c02a1d78 T mtd_point c02a1e2c T mtd_get_unmapped_area c02a1eb0 T mtd_write c02a1f68 T mtd_panic_write c02a2030 T mtd_get_fact_prot_info c02a2070 T mtd_read_fact_prot_reg c02a20cc T mtd_get_user_prot_info
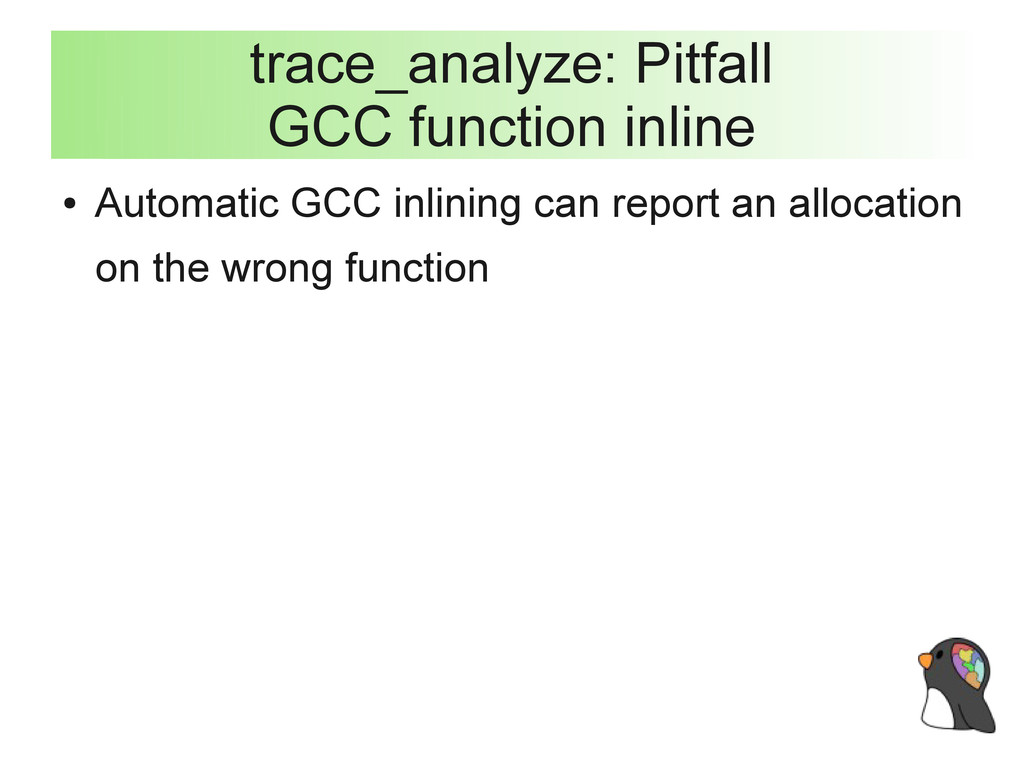
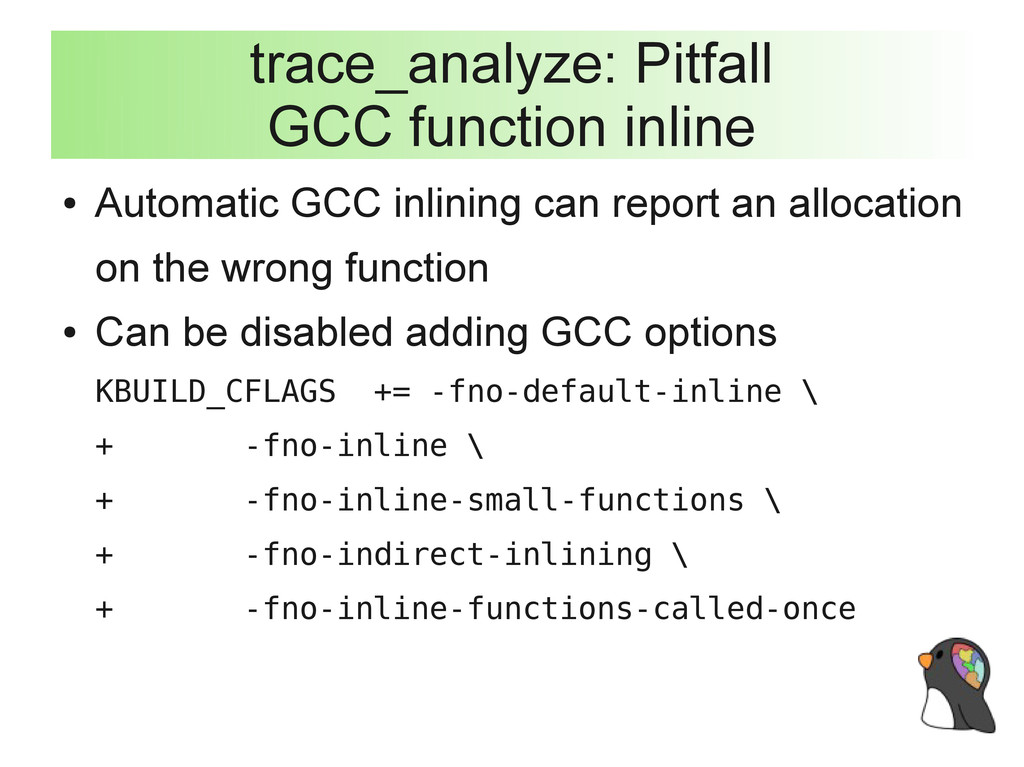
report an allocation on the wrong function • Can be disabled adding GCC options KBUILD_CFLAGS += -fno-default-inline \ + -fno-inline \ + -fno-inline-small-functions \ + -fno-indirect-inlining \ + -fno-inline-functions-called-once
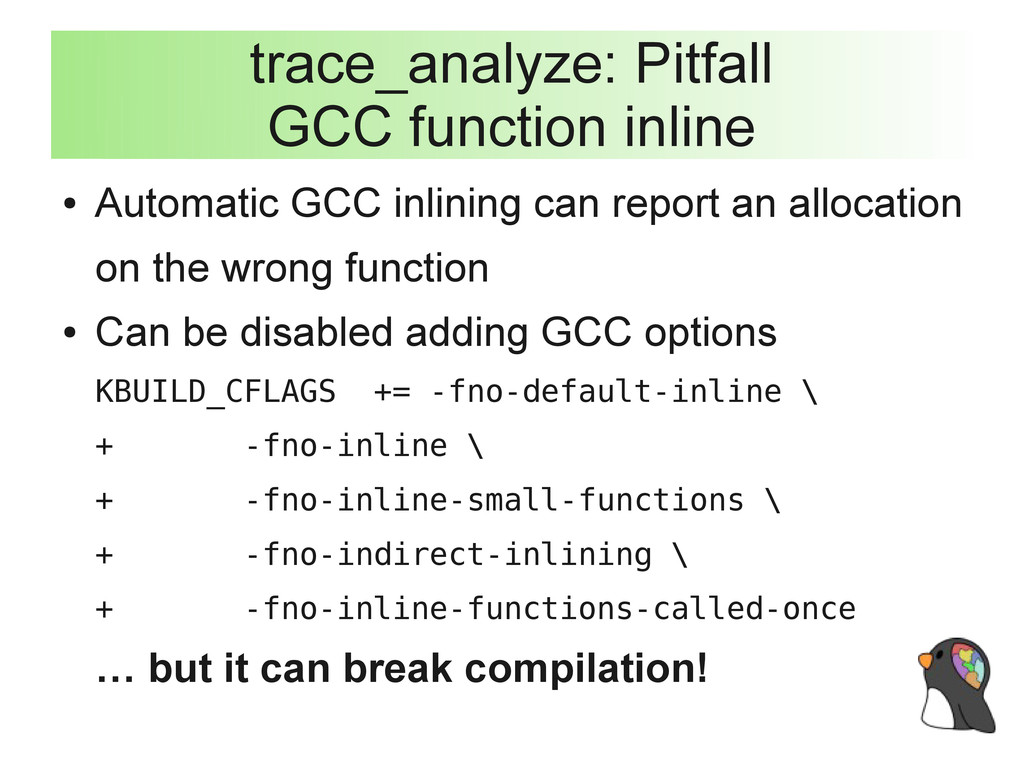
report an allocation on the wrong function • Can be disabled adding GCC options KBUILD_CFLAGS += -fno-default-inline \ + -fno-inline \ + -fno-inline-small-functions \ + -fno-indirect-inlining \ + -fno-inline-functions-called-once … but it can break compilation!